📕Book of Flow: Bounce
What comes after the groundbreaking Market Drop called in Fall-Off..?

📖 The Book of Flow: Bounce
First, YEET caught the 60-point SPY move down with Book of Flow: The Falloff. We tracked the relentless selloff and mapped the major positioning shifts in real-time.
Now, it’s time for the next chapter: Book of Flow: Bounce.
For weeks, we’ve been tracking nonstop bullish flow on this dip—not hedging, but outright speculation. The biggest whales aren’t just protecting positions—they’re loading up on long-dated bets, riding the volatility to a higher destination. Our thesis remains unchanged, and Friday was Day 1 of proving it.
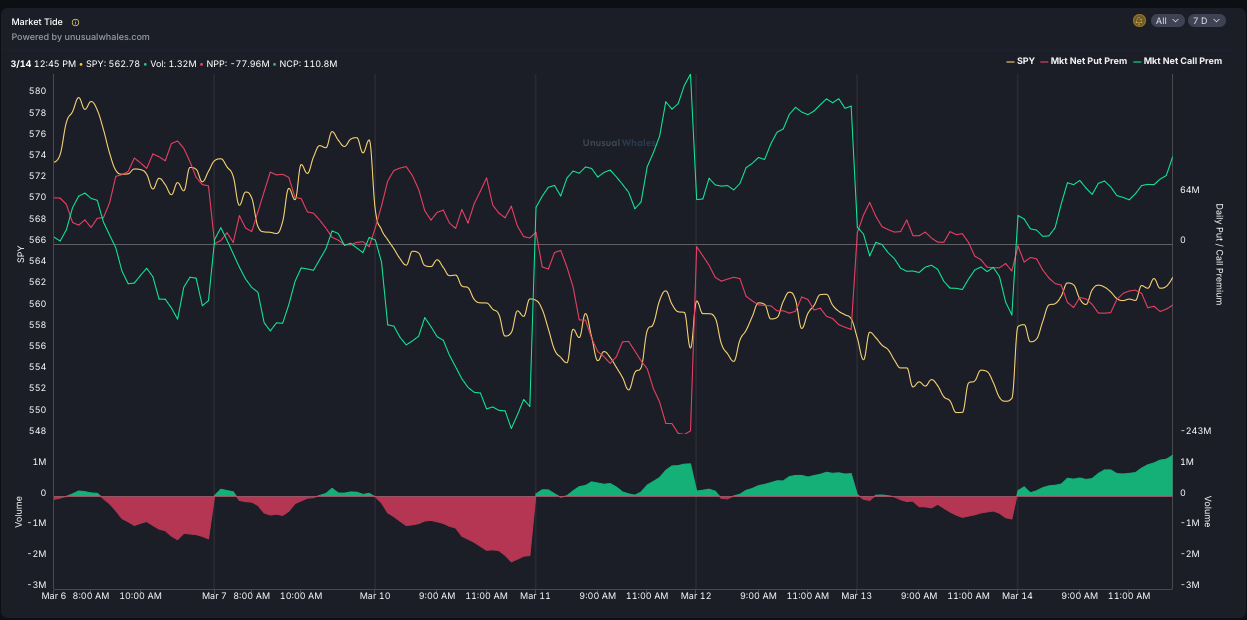
🌊 Market Tide: Signs of a Shift?
SPY closed strong at $562.81 on Friday, but the Market Tide from Unusual Whales showed a clear divergence:
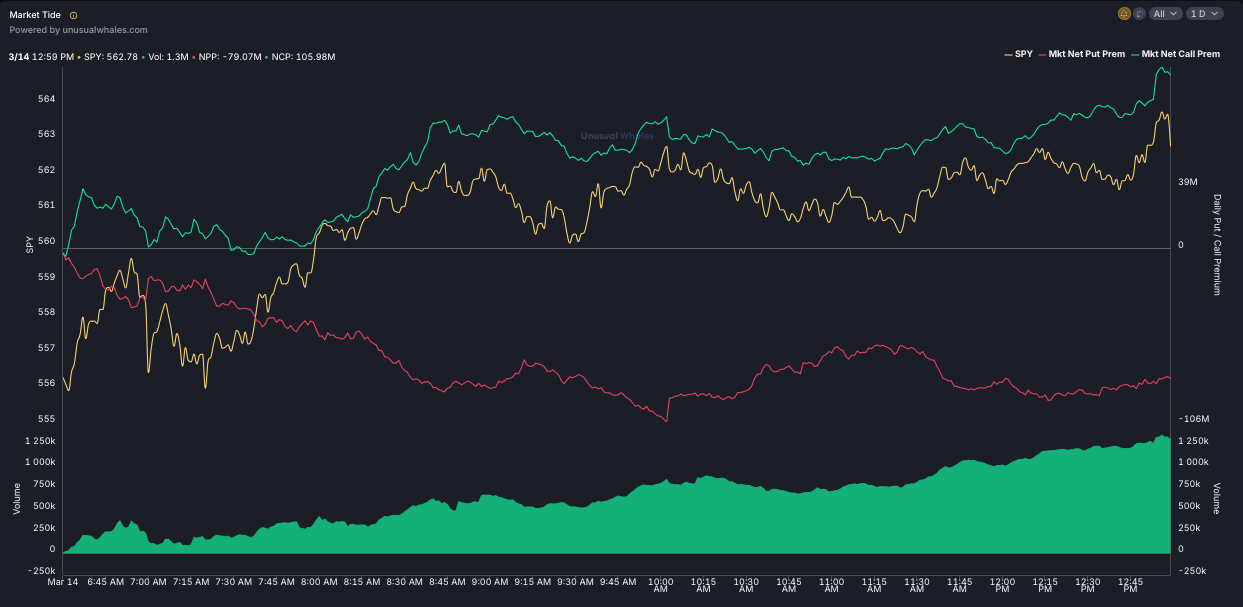
🟥 Net Put Premium: -79M (bearish hedges still in place)
🟩 Net Call Premium: +106M (call buyers stepping in)
If the market was truly weak, we’d expect puts to dominate. Instead, calls started catching up aggressively—a sign that big money is positioning for upside.
And this isn’t happening in isolation.
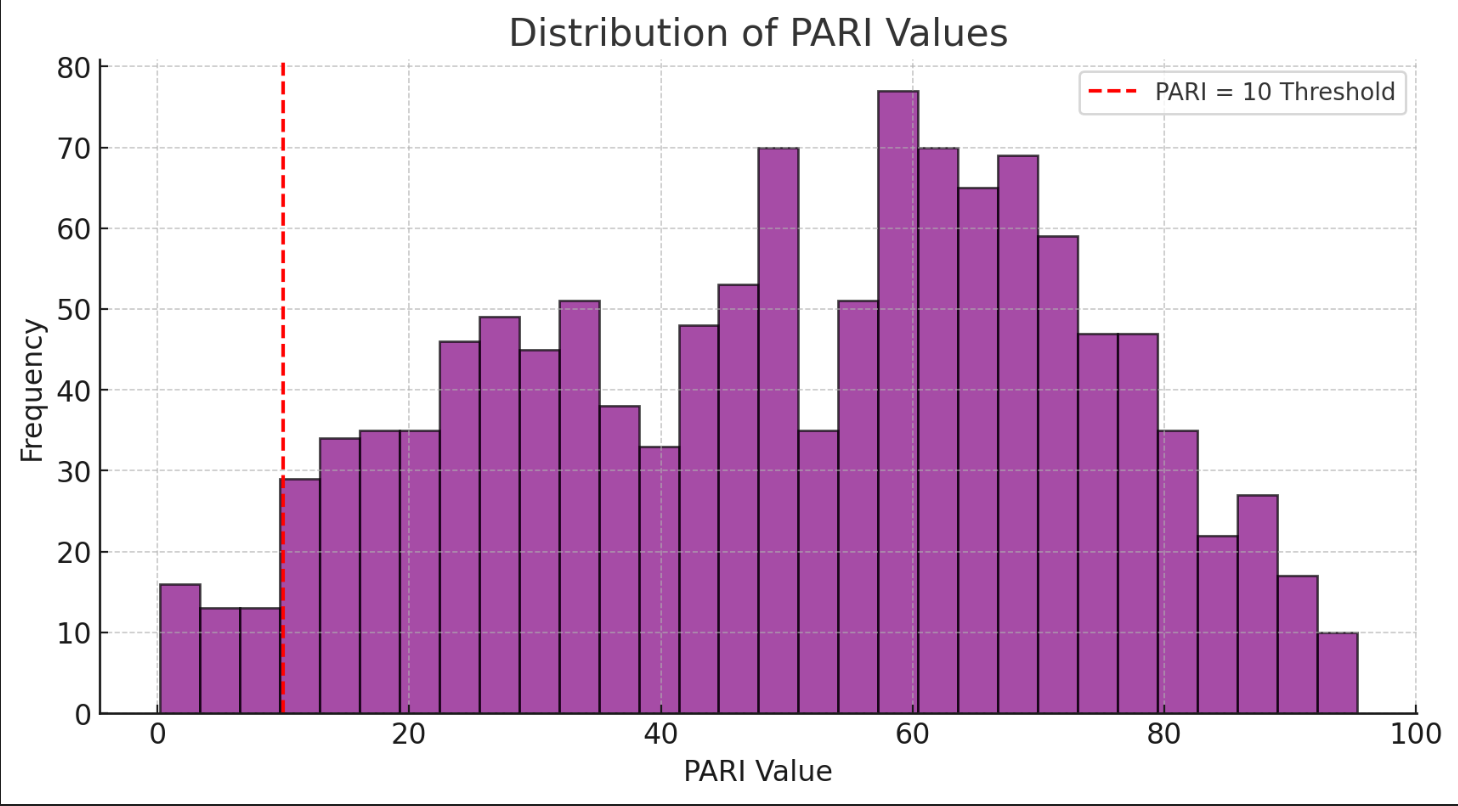
📊 Historical PARI Behavior: A Rare Signal That Matters
🚨The Price Action Risk Indicator (PARI) is a tool I developed to quantify market conditions by analyzing momentum, volatility, and trend persistence. By normalizing these factors into a percentile-based score from 0 to 100, PARI helps identify extreme overbought or oversold conditions. Historically, when PARI drops below 10, it signals a rare opportunity where SPY has frequently staged strong reversals. Understanding PARI means recognizing when the market is at a pivotal turning point—and right now, it's flashing one of its strongest signals in years.
This same day, our Price Action Risk Indicator (PARI) dropped to a stunning 9.55—an extremely rare event. To put this into perspective, this has only happened 37 times in the last five years.
So what usually happens next?
📉 SPY gets deeply oversold, but not for long.
📈 A sharp rally often follows.
⚠️ Volatility spikes tend to reverse.
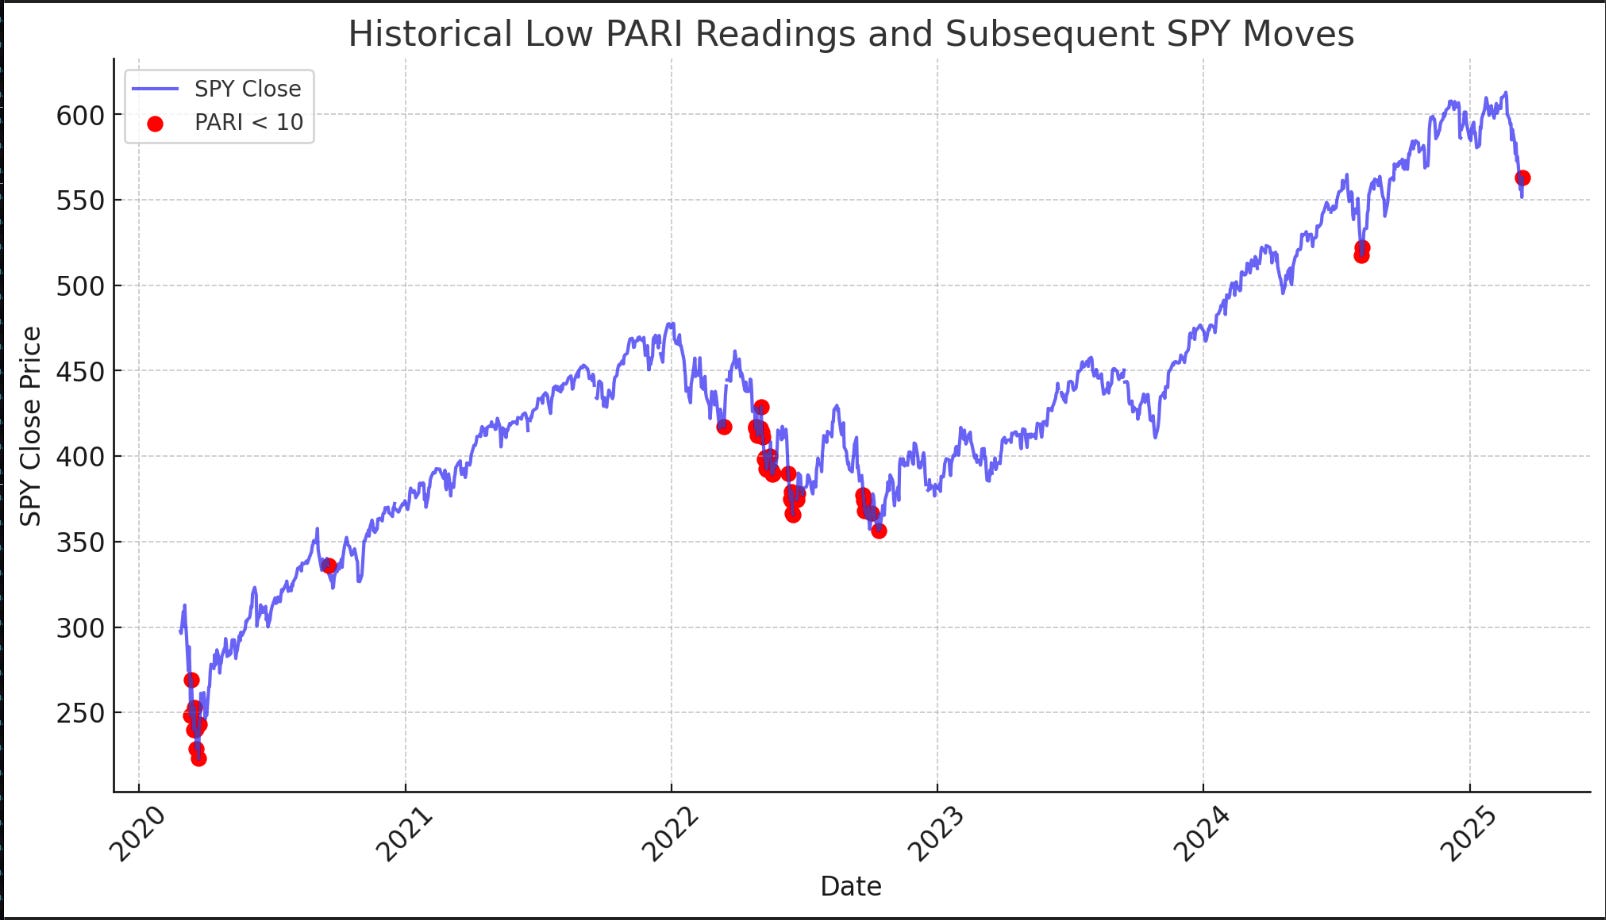
The last time we saw this setup was August 2024, and SPY ripped higher over the next five sessions. This isn’t just a hunch—this is data-backed.
The red dots show other times our PARI Metric has read historically low (less than 10)—it often preceded a significant rally.
And we aren’t just seeing it in the data—the charts are confirming the story.
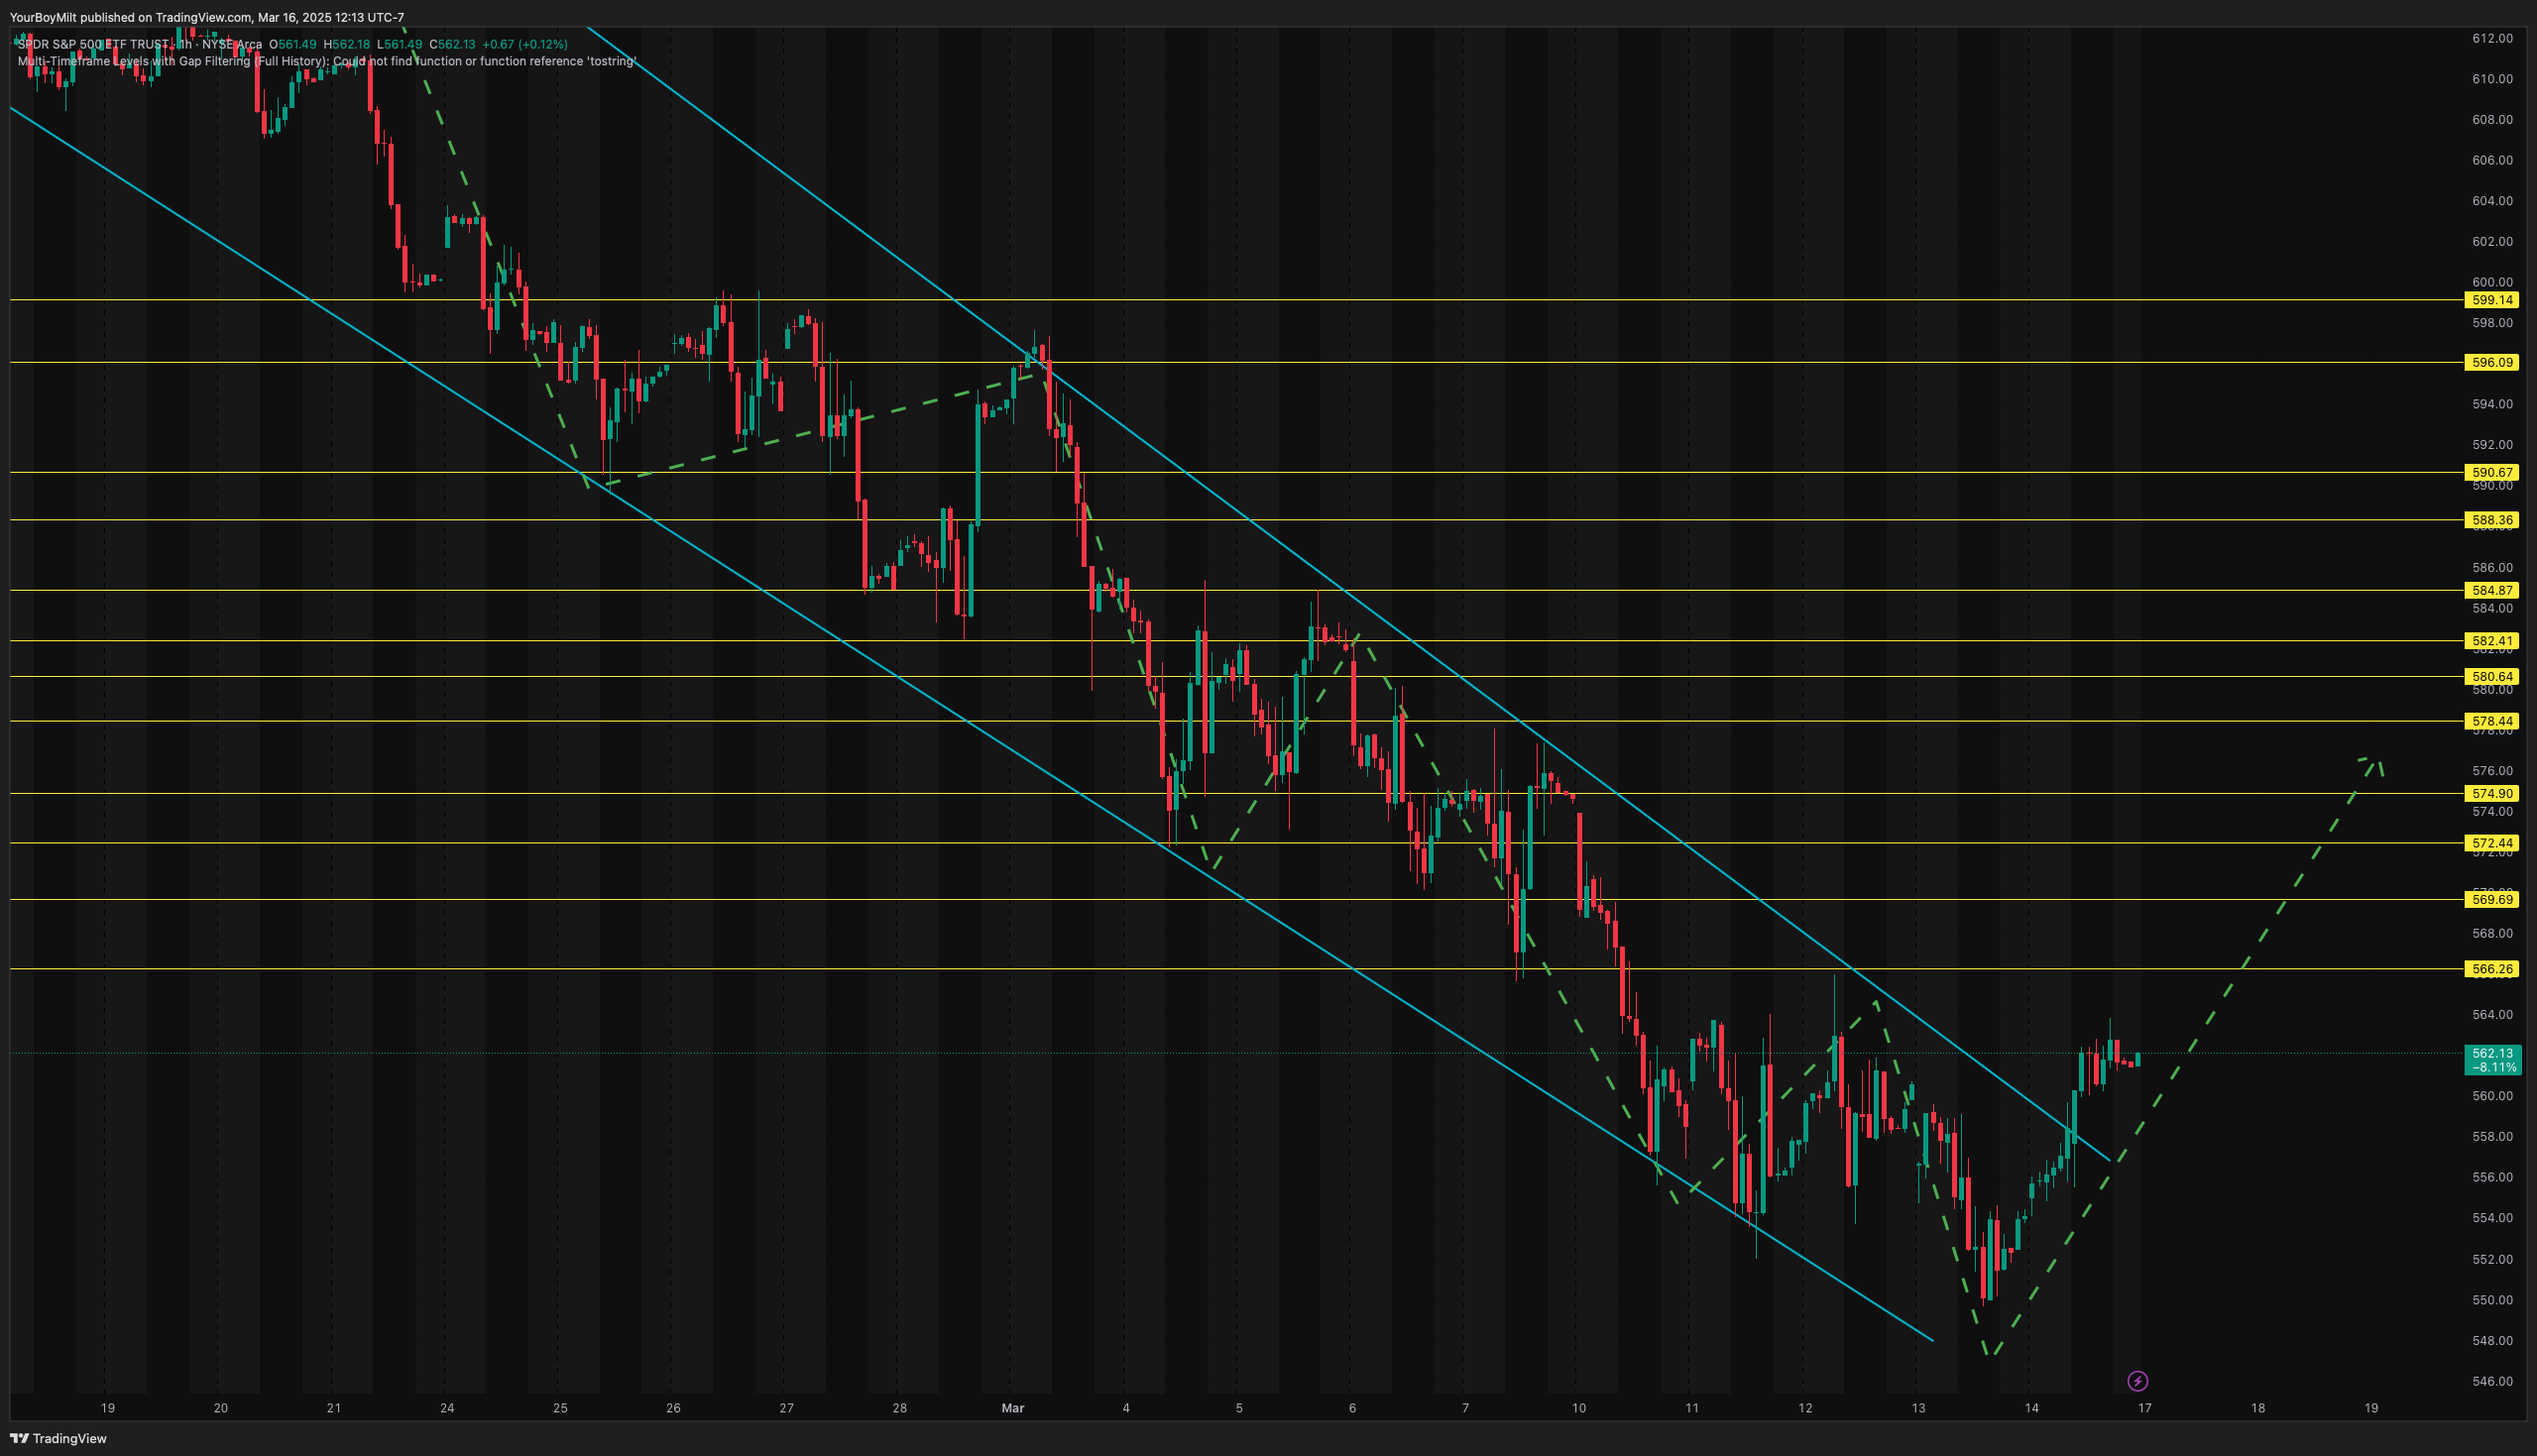
📈 The Technical Setup: Channel Break into a Flag
SPY’s price action is playing out like a textbook reversal setup:
✔️ Broke out of a long-term descending channel
✔️ Now forming a bull flag—classic continuation signal
✔️ Volatility is compressing—suggesting an expansion move is coming
And it’s not just SPY—major tech names are flashing similar setups.
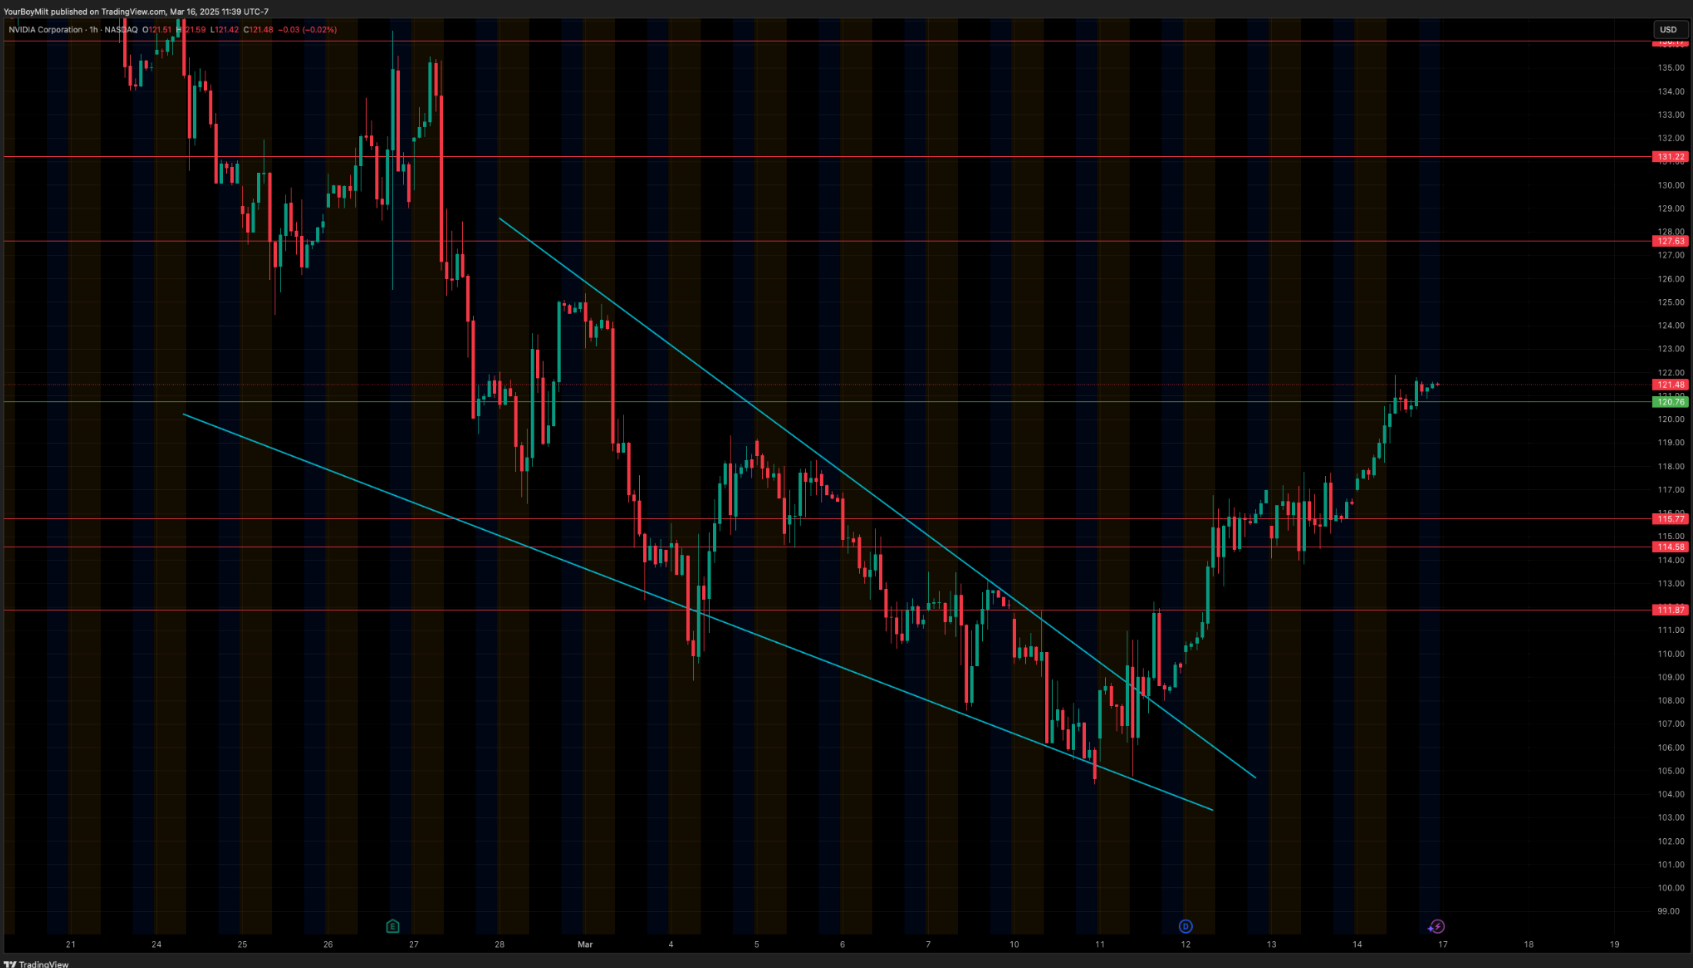
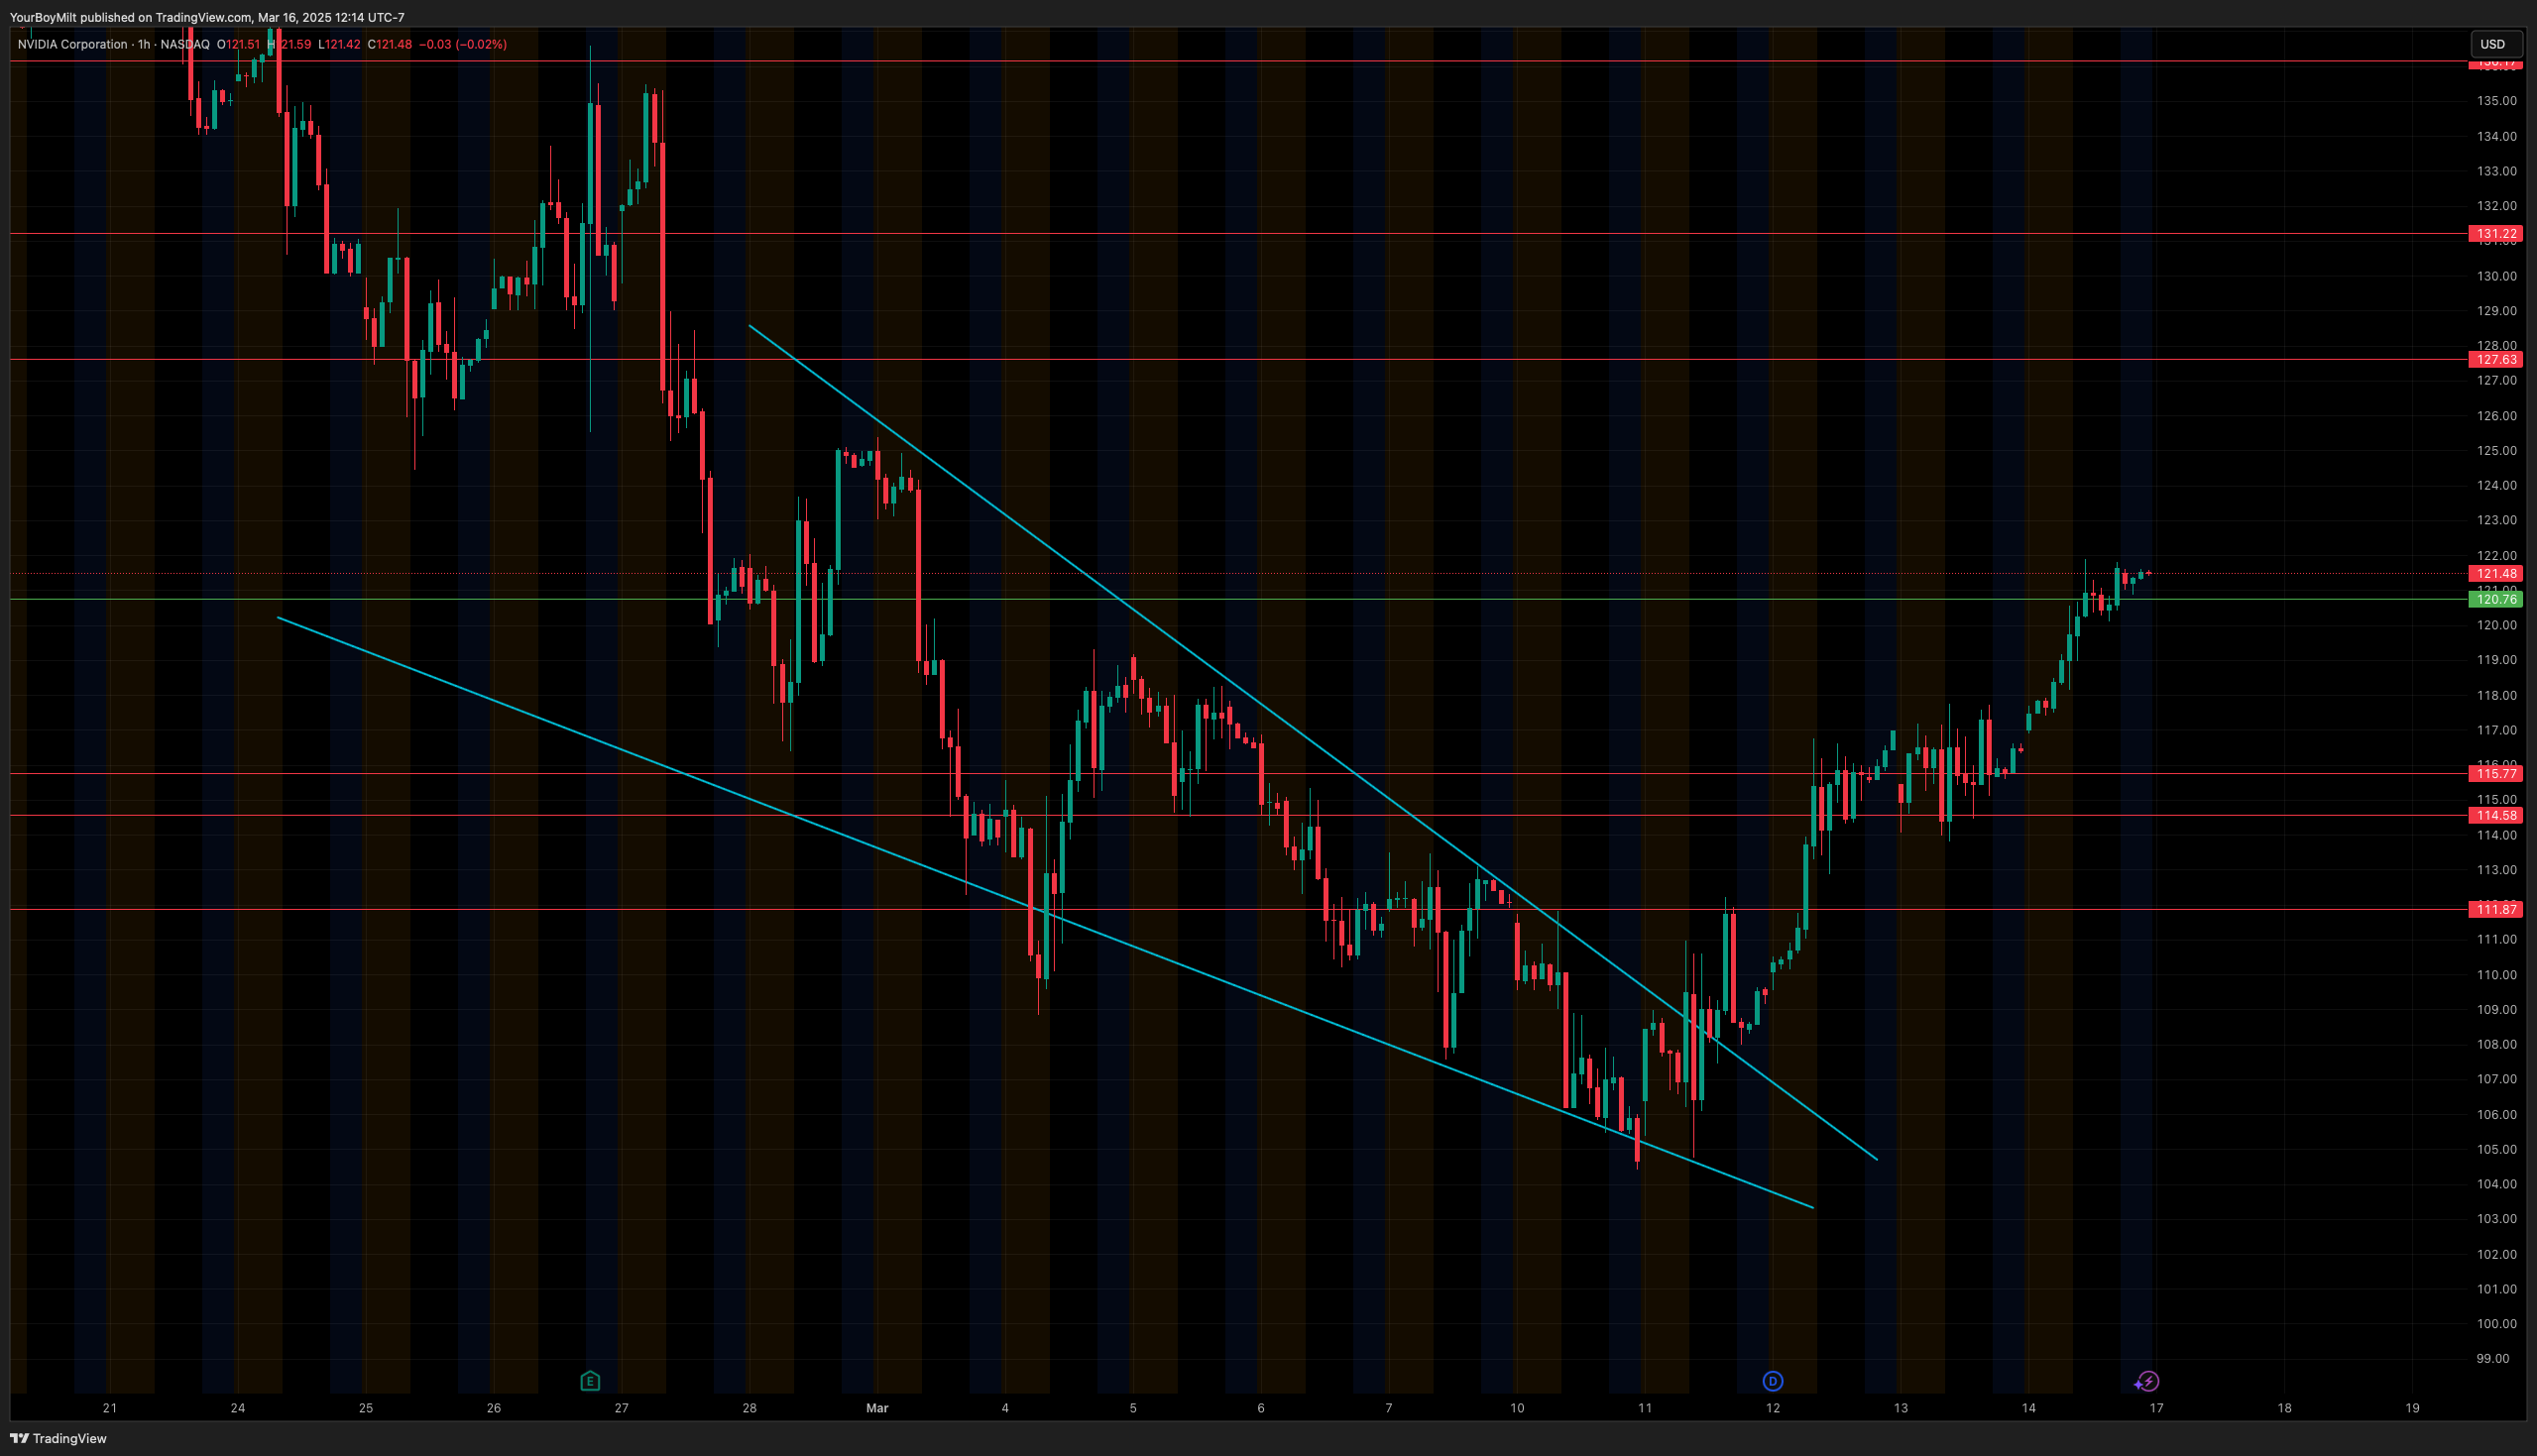
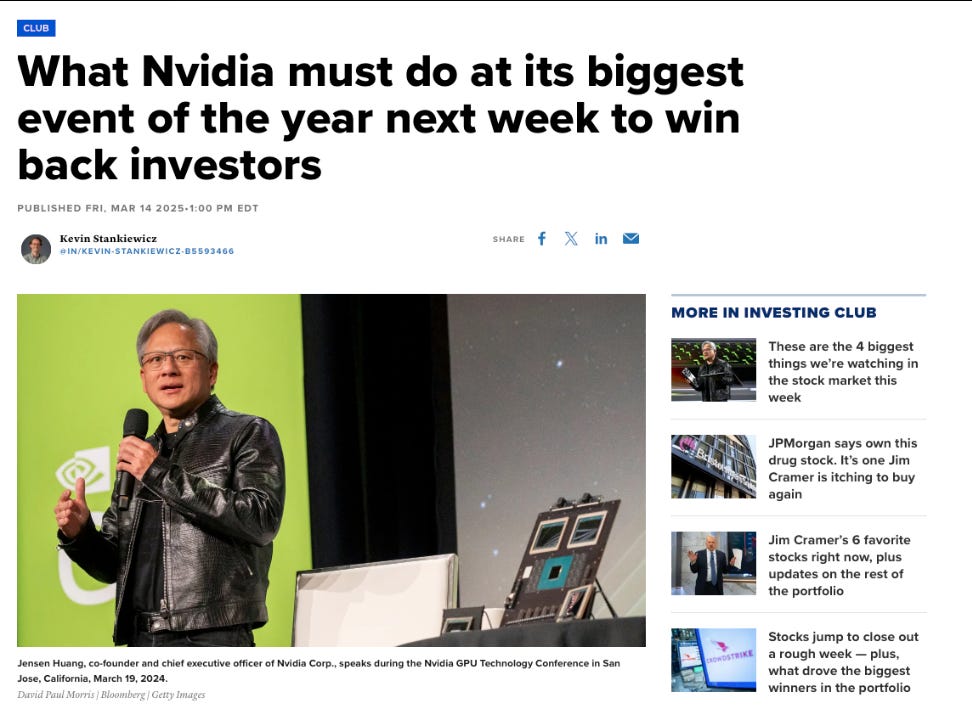
🚀 NVDA (Nvidia): Broke out of a falling wedge and now holding above resistance. Buyers are stepping in, and momentum is building into next week’s GPU event.
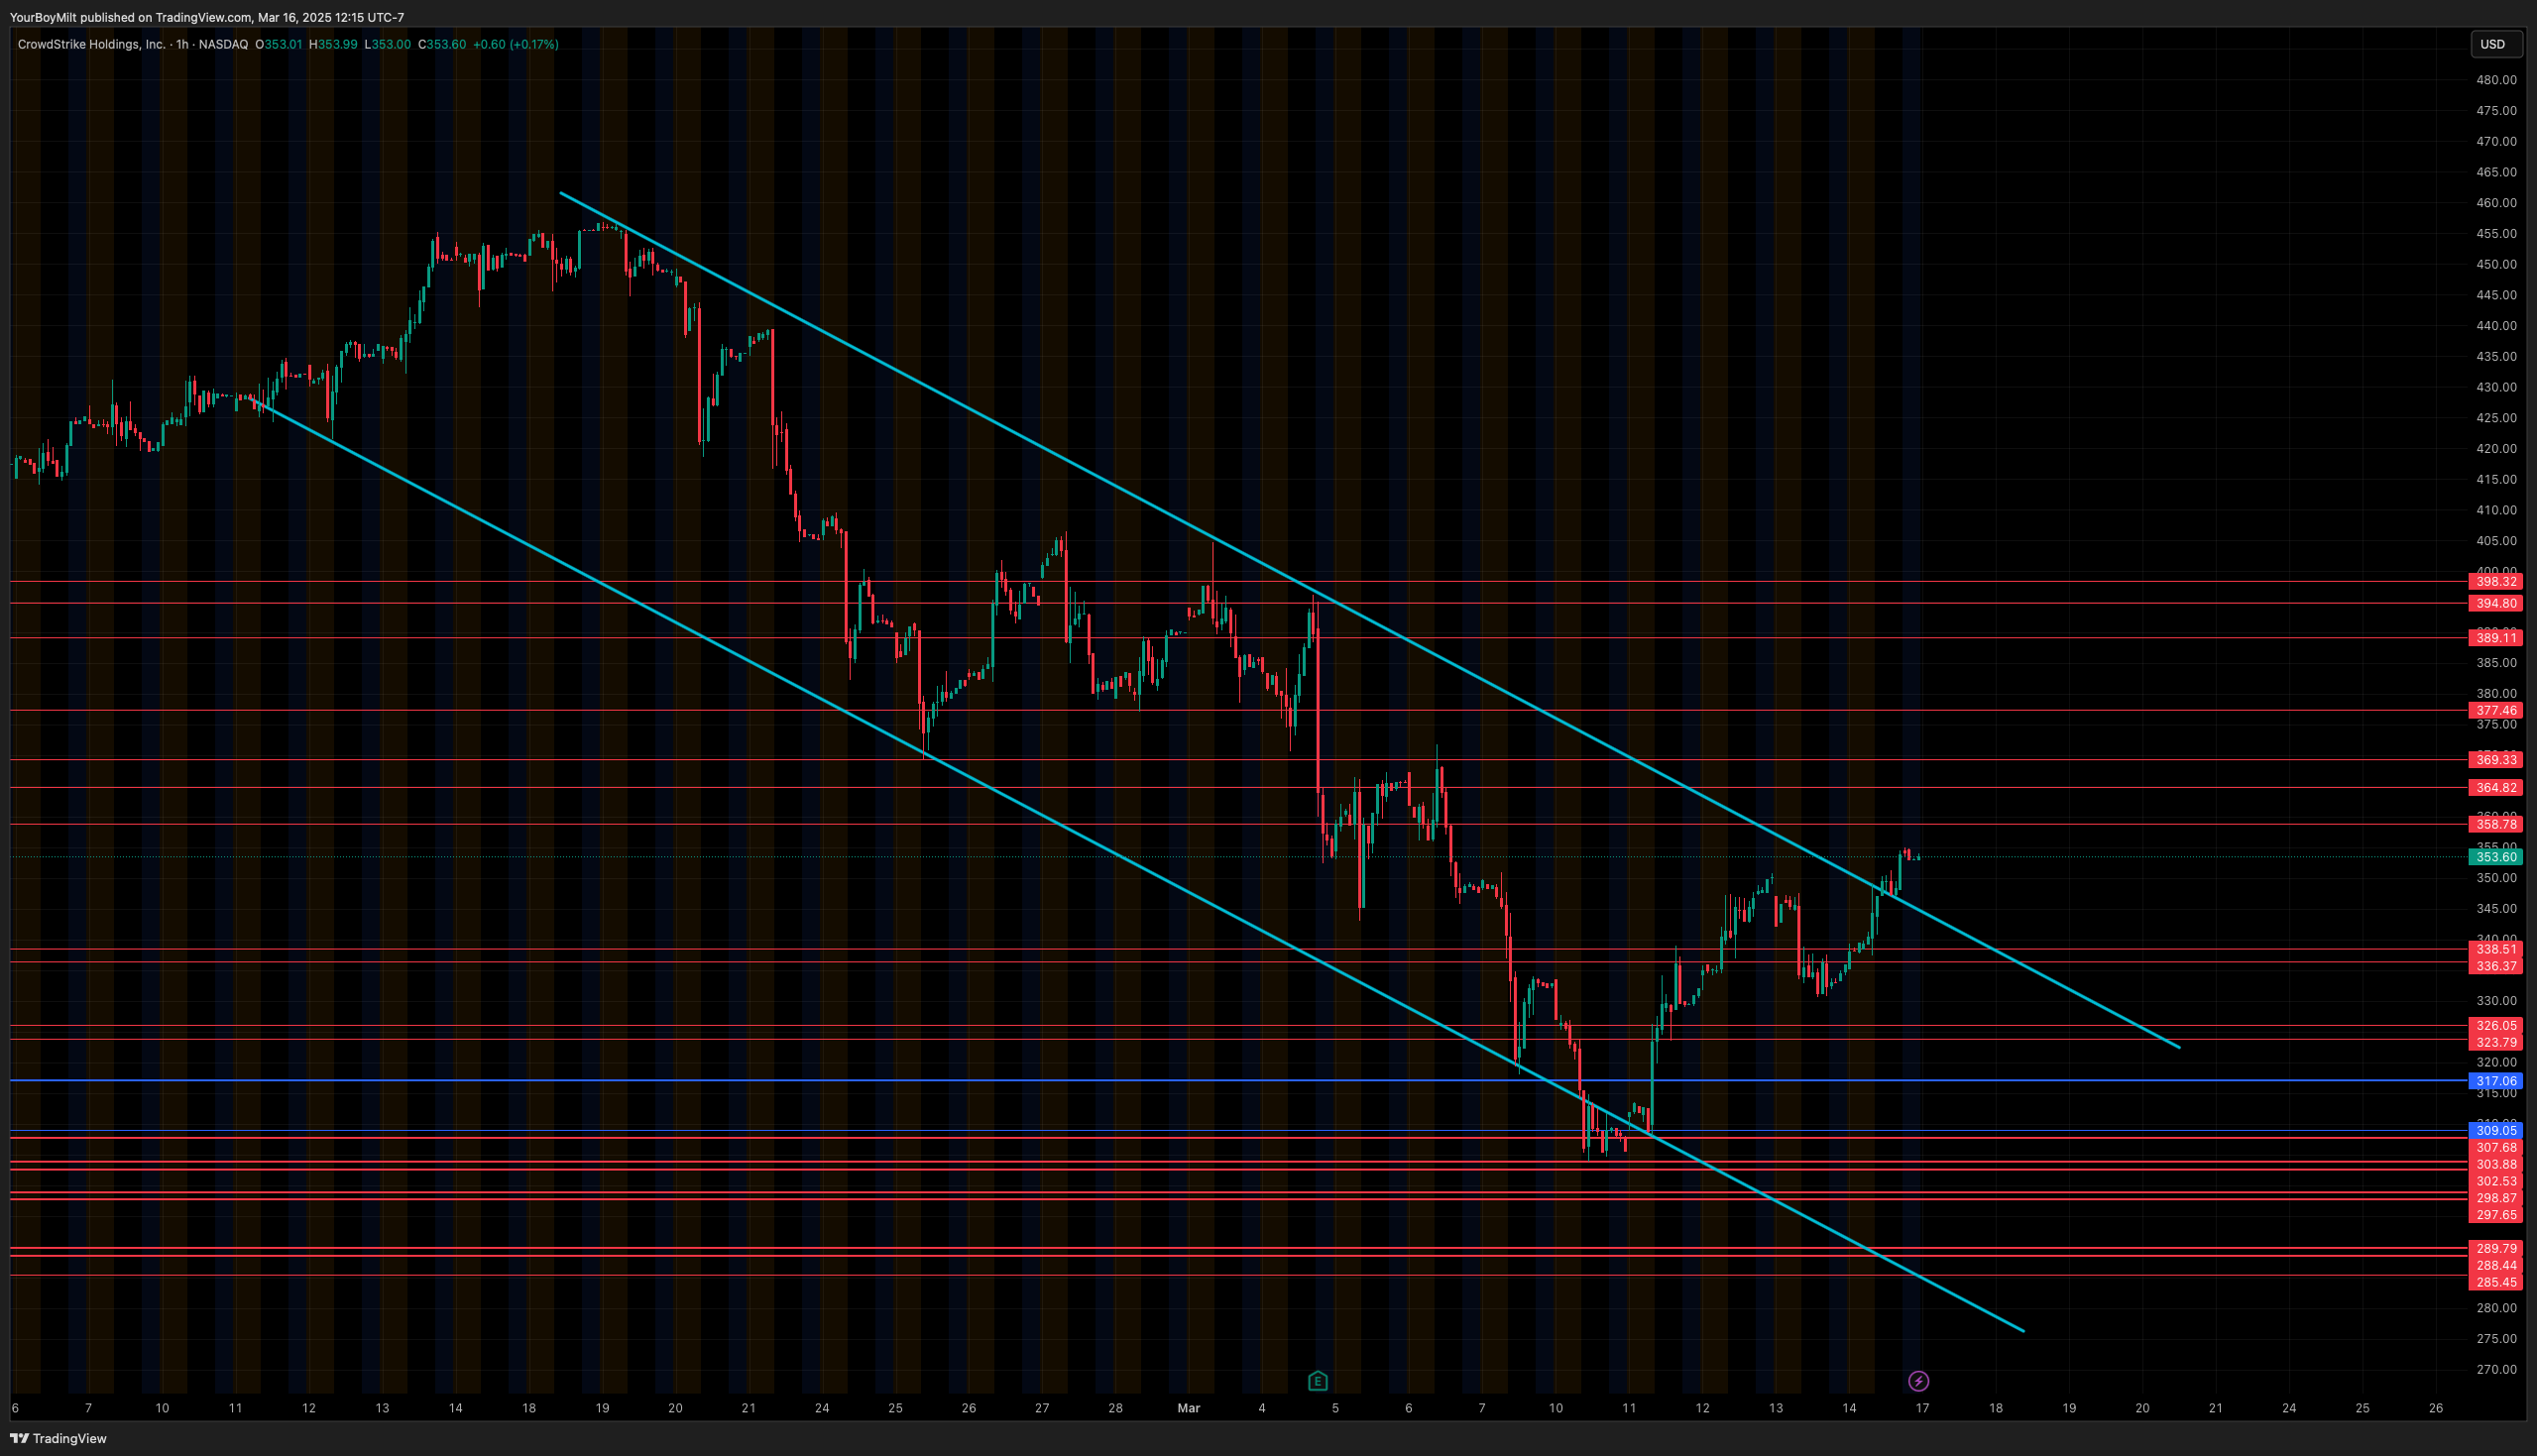
📊 CRWD (CrowdStrike): Just cleared a major channel breakout, confirming higher lows and signaling potential continuation.
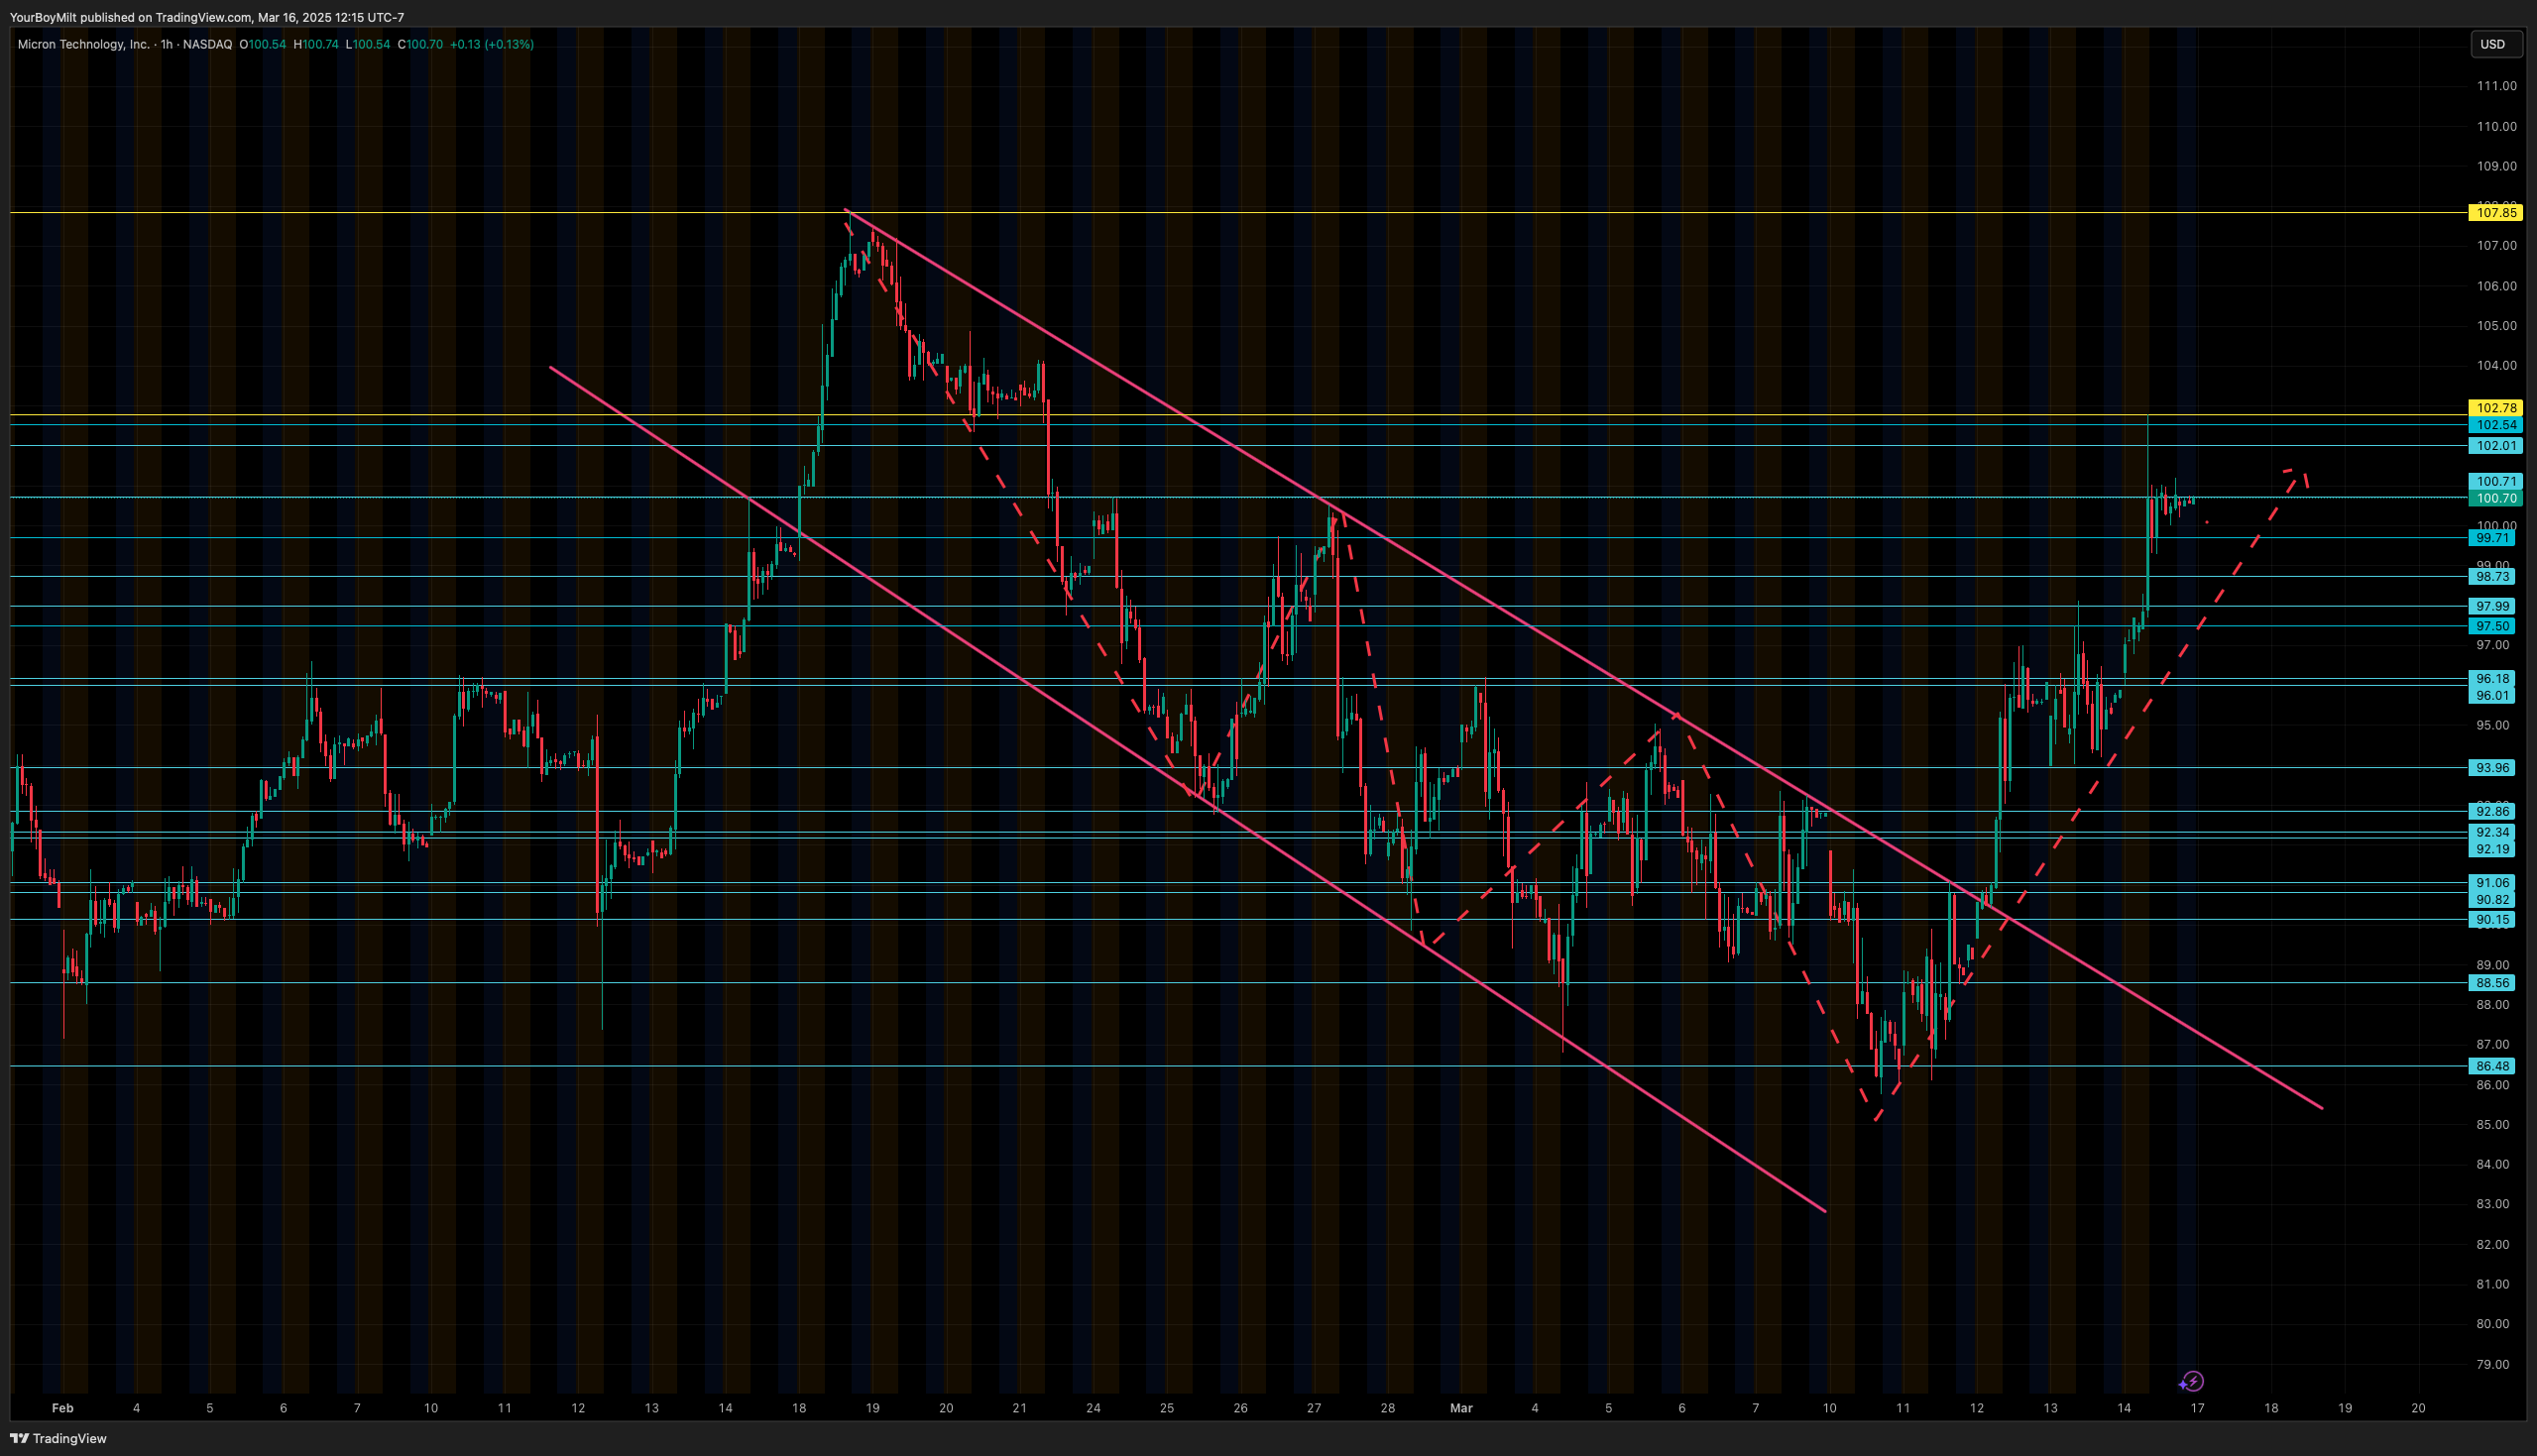
🔧 MU (Micron): Had a steep downtrend break, consolidating above support, suggesting that accumulation is taking place.
🔥 NVDA Flow: The Real Juice
One stock could be the canary in the coalmine for the next move higher: NVIDIA (NVDA).
NVDA’s big GPU event next week is already attracting whale-sized bets, and the options flow is screaming bullish speculation:
🔹 NVDA 3/21 129c, 130c, 131c
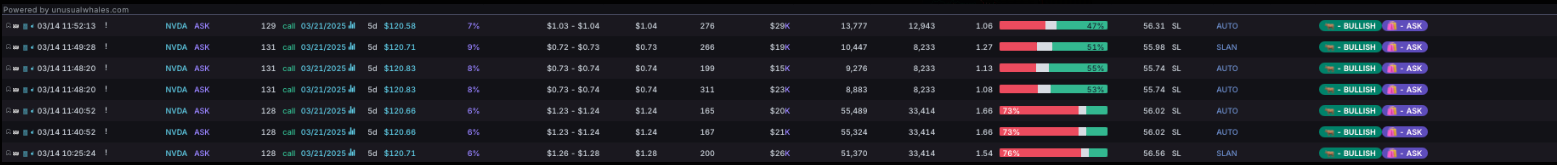
🔹 NVDA bullish 4/11 strikes
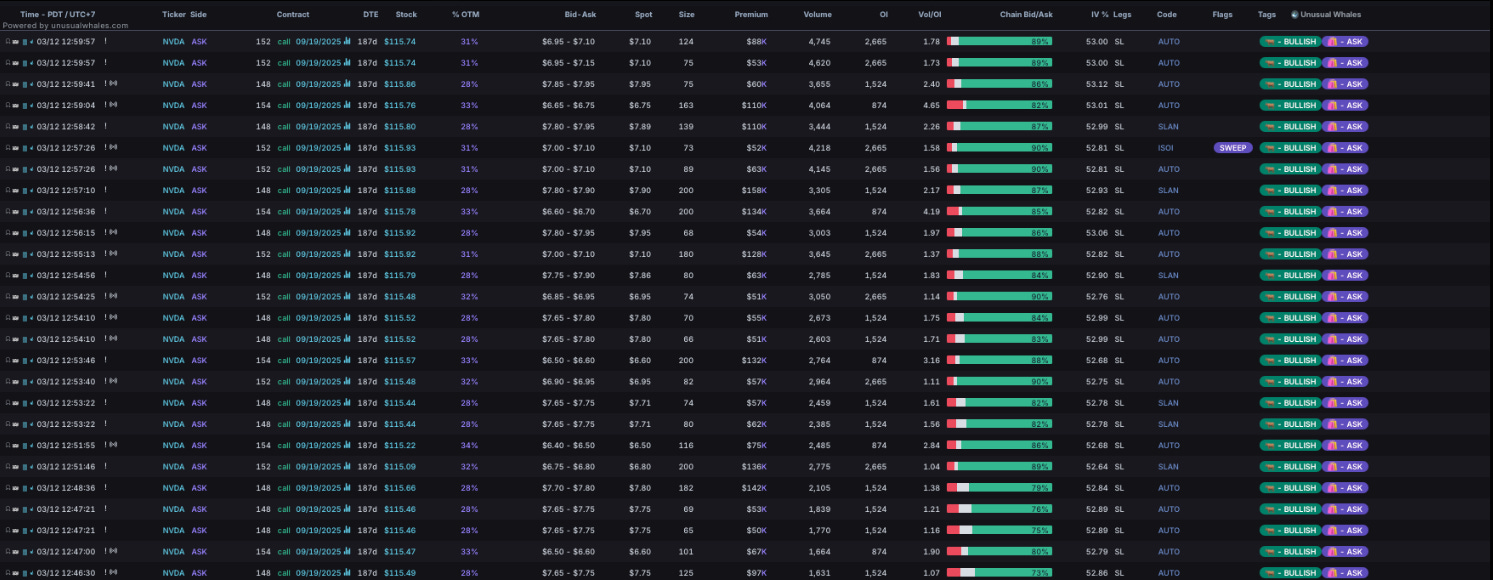
🔹 NVDA 9/19 $154C – Multiple large sweeps
But here’s where it gets really interesting—REMEMBER! NVDA has already broken out of a falling wedge, just like SPY. If this stock continues to rally into the event, it could provide the momentum needed to send the entire index higher.