
🐳BOTTOMFISH: Catching the deep red bottom
What lurks at the bottom of the market?

🐋BottomFish: Navigating the Market Depths
🐠 The Guppies & Plankton: Retail, Flow, & Market Tide Shifts
Welcome to BottomFish, where we dive deep into the murky market waters, trying to spot the opportunities (or the creatures) lurking at the depths. Let's start with the surface level—where the guppies and plankton, aka retail traders and market flow, are making waves.
🌊 Market Tide Recap: Signs of a Shift
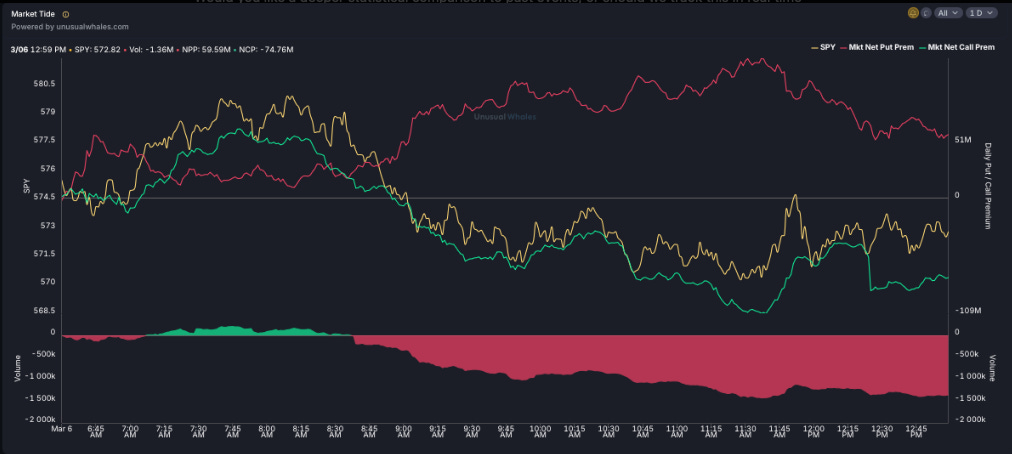
The market tide today, while still carrying bearish undercurrents, started to show signs of rotation toward bullish flow.
OTM call premiums stopped bleeding lower, suggesting that some traders are positioning for a potential move up.
The final stretch of the session saw a slowdown in put dominance, meaning that the massive wave of downside hedging may be reaching exhaustion.
Retail Flow: Still hesitant, but starting to show interest in speculative calls—a hint that sentiment is shifting.
Bottom line: The tide isn't fully bullish yet, but the current is changing.
🦈 The Sharks: Pure Price Action feat. PARI
Unlike guppies, the sharks don’t evolve. They don’t need to. Their method of survival has remained pure, unevolved, and brutally effective—just like price action. No trailing indicators, no ridiculous models—we let raw waves of volatility and momentum guide us with tried and true key levels.
🎨 Visual Breakdown: SPY’s Trend & The Shark-Like Predictability of Price Action
SPY remains in a clean downward channel, bouncing between key Fibonacci levels with the consistency of a species that hasn’t changed in millions of years.
Every bounce leads to rejection at a key level, every dip seeks liquidity—price action behaving in its most natural, unevolved form.
🌊 Net Put Premium remained high, but stalled into the close—are the sharks done feeding on fear? We think yes.
🦈 PARI as a Leading Indicator:
Daily PARI hit 17.89, the lowest since December 31, 2024
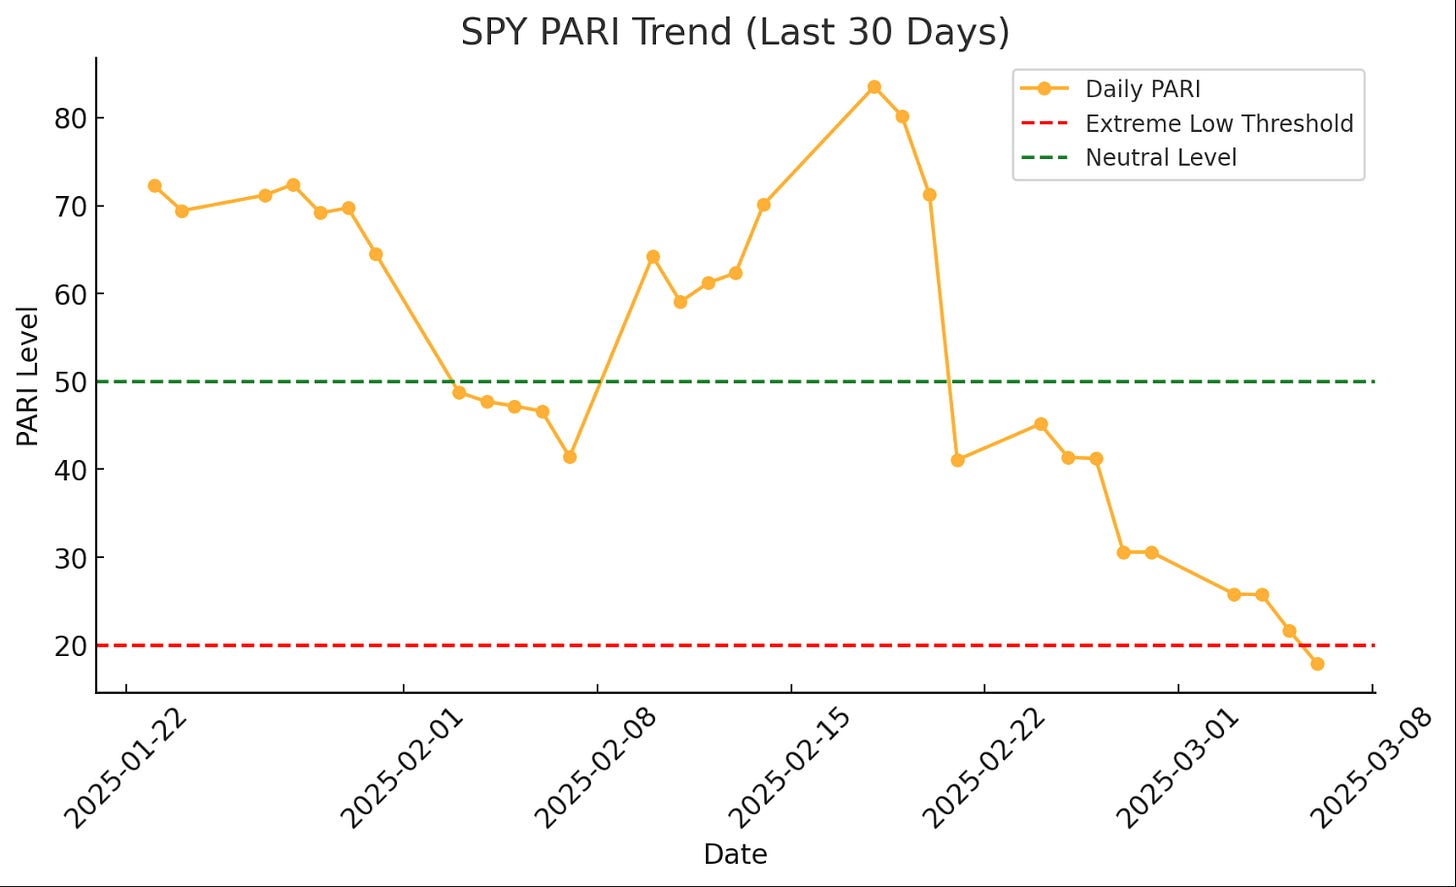
🚨DAILY PARI IS AT A HISTORIC LOW—FOR MORE ON WHAT THAT MEANS CHECK YEET PLUS SECTION BELOW
The intraday PARI (bottom of the SPY chart) has started climbing, meaning the market structure itself is shifting under the surface.When intraday PARI leads the daily trend, it often predicts a market reversal within the next few sessions. Get ready to go up! ( note pari at the bottom)
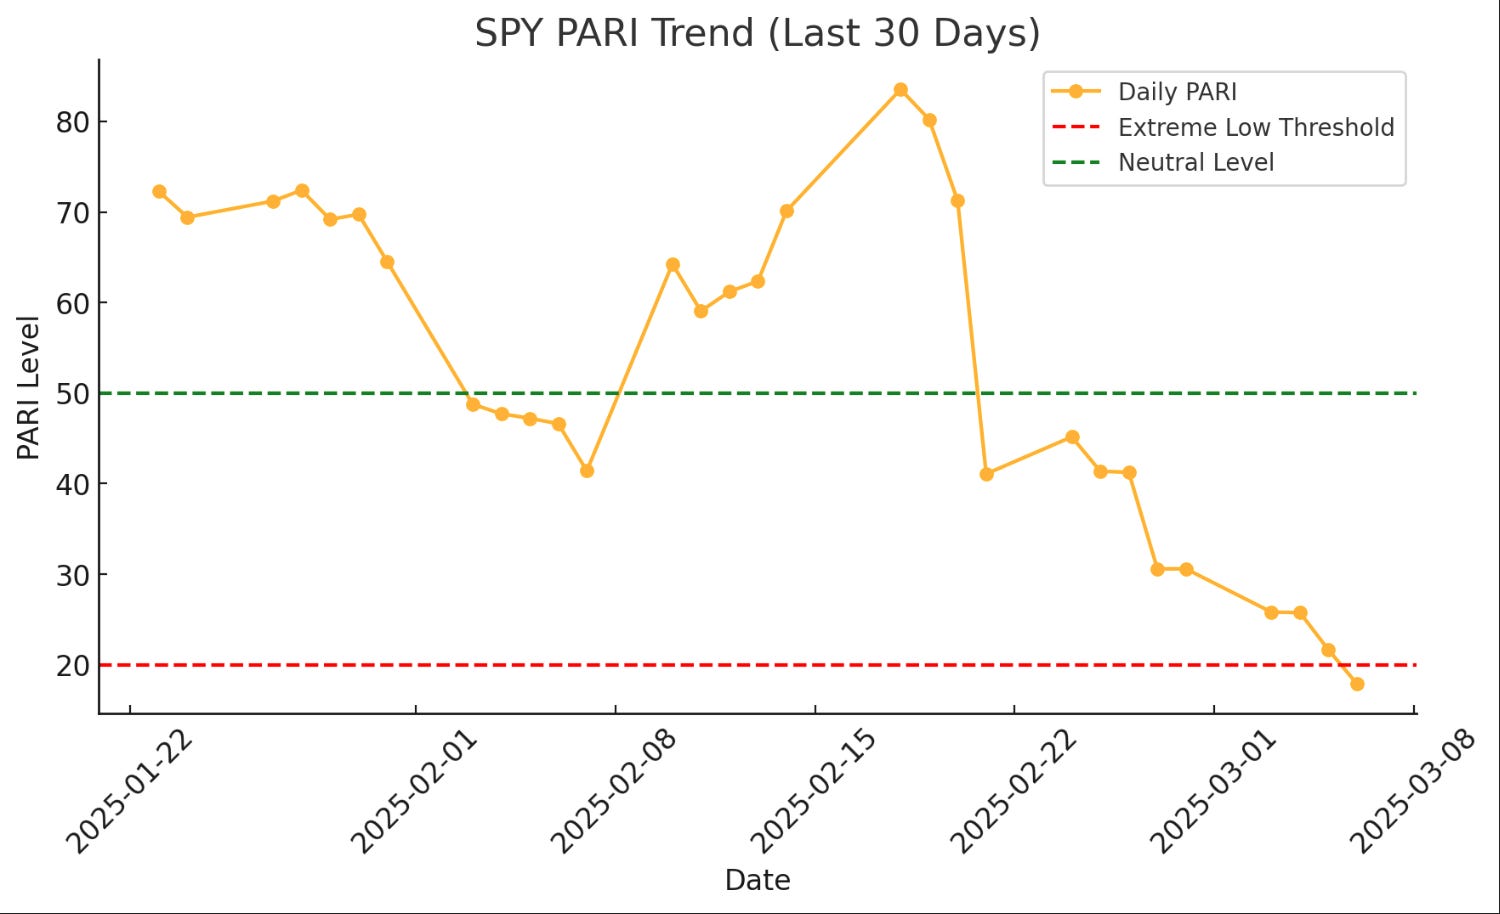
Comparison: When we last saw this setup in late December 2024, SPY bounced ~2% within a week. The sharks don’t evolve, and neither does price action—patterns repeat.
🦟 The Deep Abyss: The Jet Blue Fish & OTM Call Anomalies
Some things in the oceans stand out like anomoliese. The Jet Blue Fish of this market? These massive deep OTM call buys.
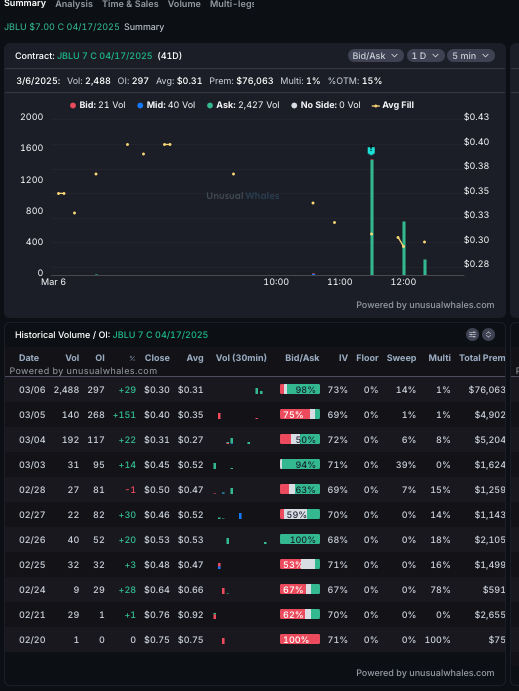
🐟 The Jet Blue Fish: Deep OTM Calls Looking for a Moonshot
💡 Volume-to-OI Ratio Insight:
The Volume-to-Open Interest (OI) ratio is crucial because it tells us whether today’s volume is meaningful or just noise.
On 3/6, volume (2,488) was nearly 10x the previous OI (297), meaning a massive influx of new positions rather than just recycling old contracts.
A high Volume/OI ratio (>1) signals potential fresh positioning, while a low ratio suggests traders are just flipping contracts.
If we see the OI increase by more than, say, 2/3 of that total volume in the following update, that’s a strong sign the majority of these contracts are being held, not just traded intraday.