
📉 CHART ART: The Anatomy of a Downtrend
Understanding how trends and levels worth together

YEET PLUS: our new simple segment requested in the garden, “Uppies or Downies” —designed to simplify whether I think we go up or down—at the bottom.
📉 CHART ART: The Anatomy of a Downtrend
1. The Rule of Three 📏
Don’t get baited by a random line. Two touches is a concidence, three is a trend.
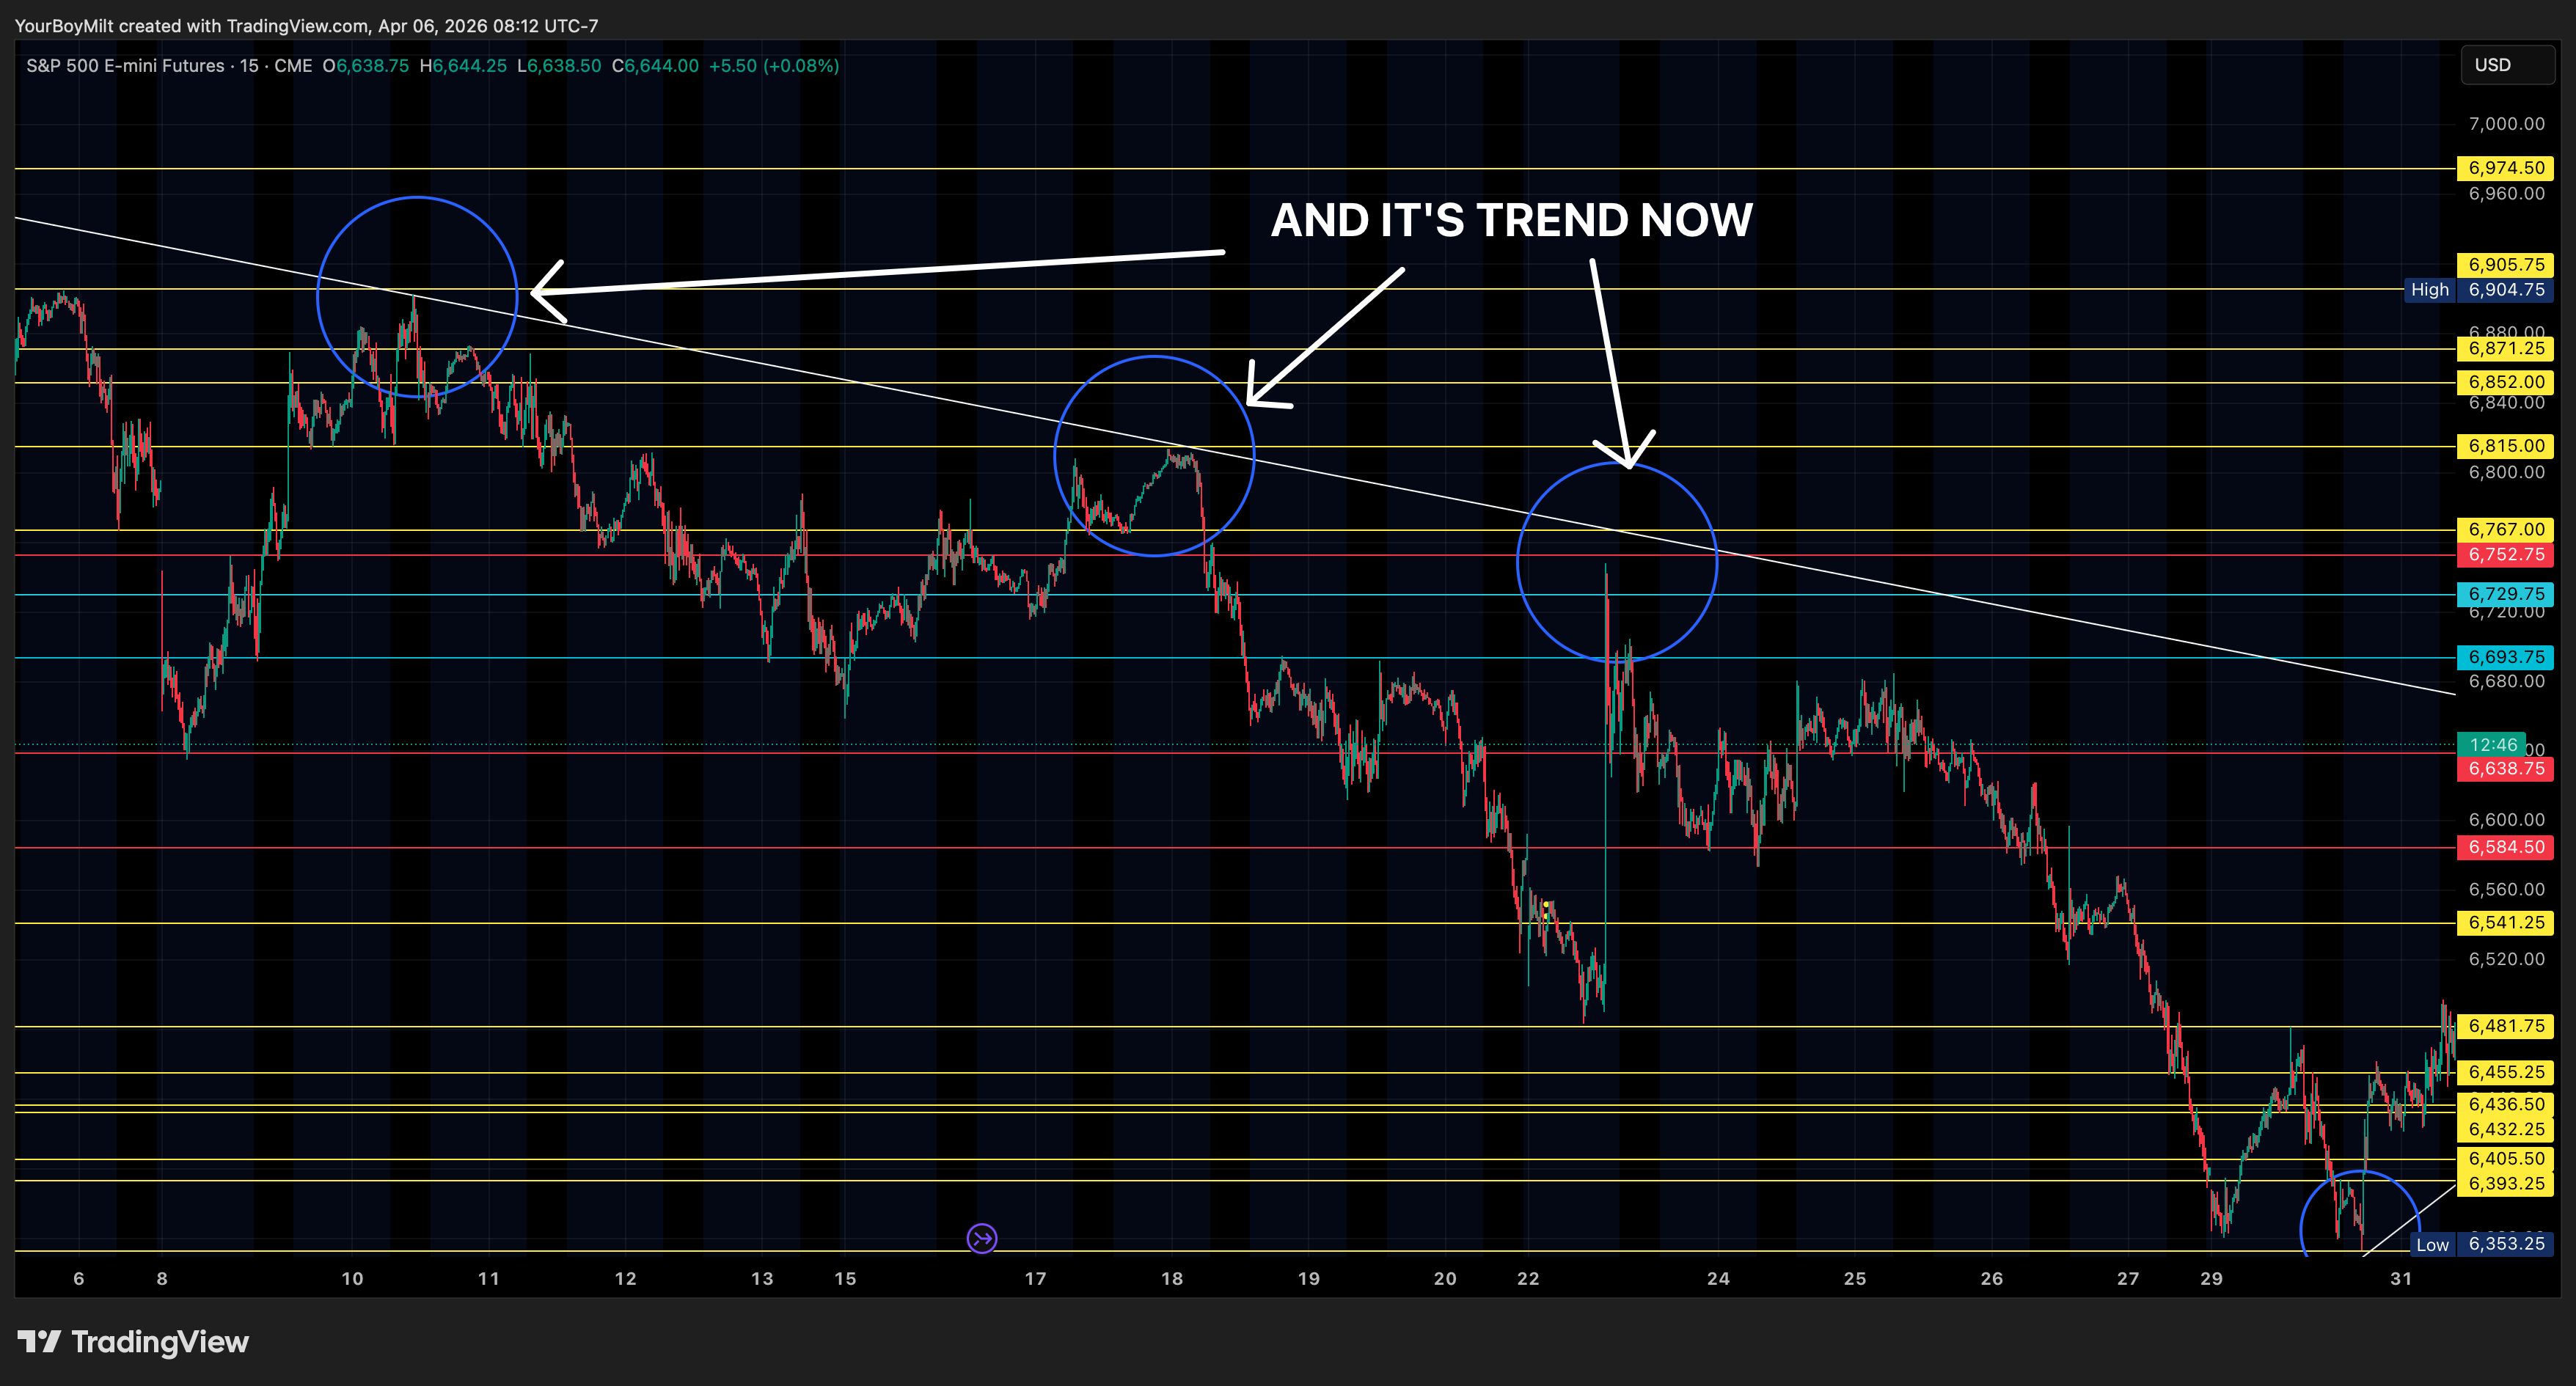
1 & 2: Just a coincidence.
3: Now you have a Trend. 📉 The trend line is simply the “explanation” of what’s happening at the levels. It tells you if you’re winning the fight or losing the script.
2. Failure at the Key Levels ❌
The circles on the top line aren’t just “touches”—they are failures.
The Rejections: Every time ES pushed up to a monthly level or a gap, it got rejected.
Lower Highs: It hits the level → it fails → it sets a lower high.
The Logic: Trends are really ONLY lower highs and lower lows or vice cversa.
You could play the levels alone, but the trend line helps you conceptualize the “constant losing” of those levels.
3. The Counter-Trend (The Hold) 🤝
Milt draws that bottom support line live:
The Pivot: It held the key level at the bottom.
The Reclaim: It dipped, then came back to reclaim.
3-Point Confirmation: Now we have a confirmed uptrend working against the primary downtrend.
4. “Things Getting Tight” 🤏
This is where the “Ping Pong” happens. 🏓
The Squeeze: You have a ceiling (Downtrend) and a floor (Uptrend) coinciding.
The Decision: Price is bouncing between rejecting the top and holding the bottom. It’s running out of room.
The Gap Logic: On the way up, the market skipped a bunch of backtests. When it gets “tight,” it’s forced to decide: does it go back to test those skipped levels below, or set a new higher high?
5. The Resolution ⚡
When it gets this tight, the “send” is coming. It’s either going to lose the floor or snap the ceiling to backtest the next level up. The tightness is just the market’s way of picking its next destination.