
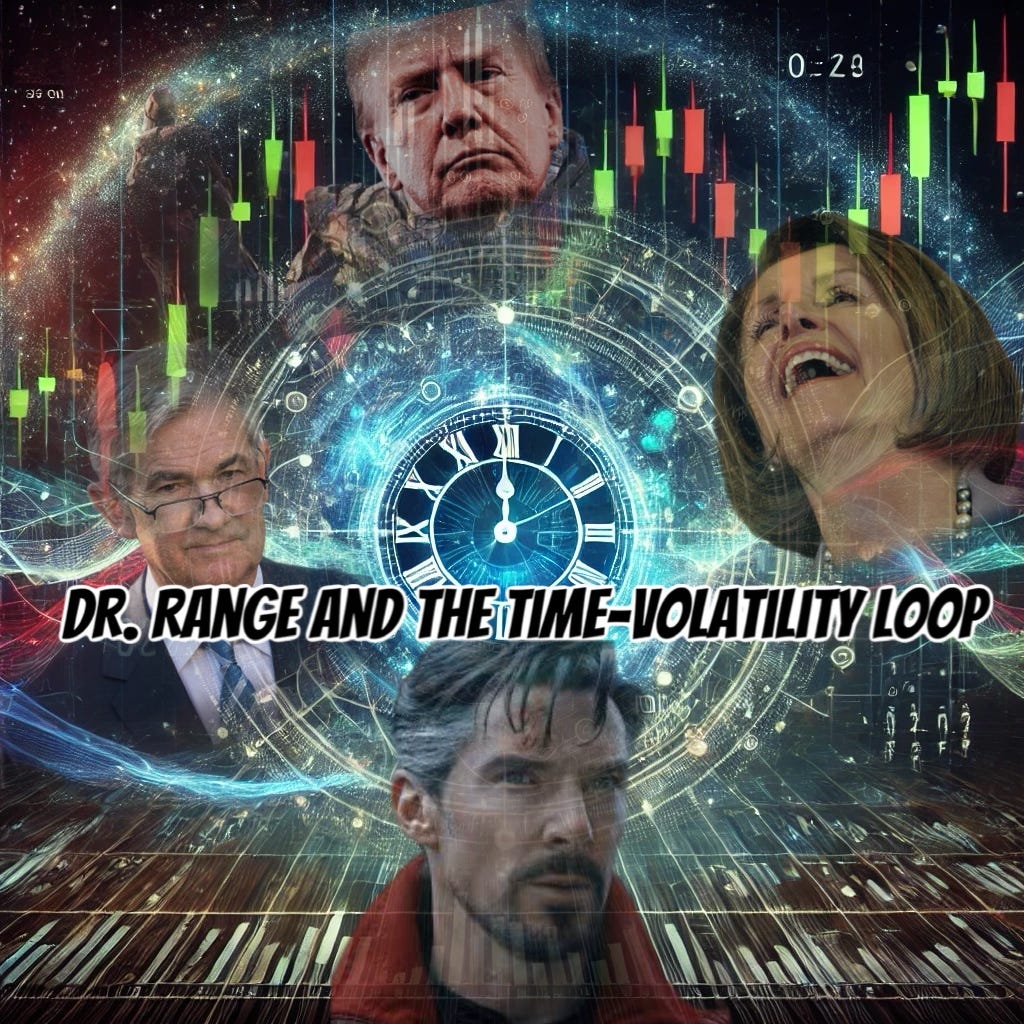
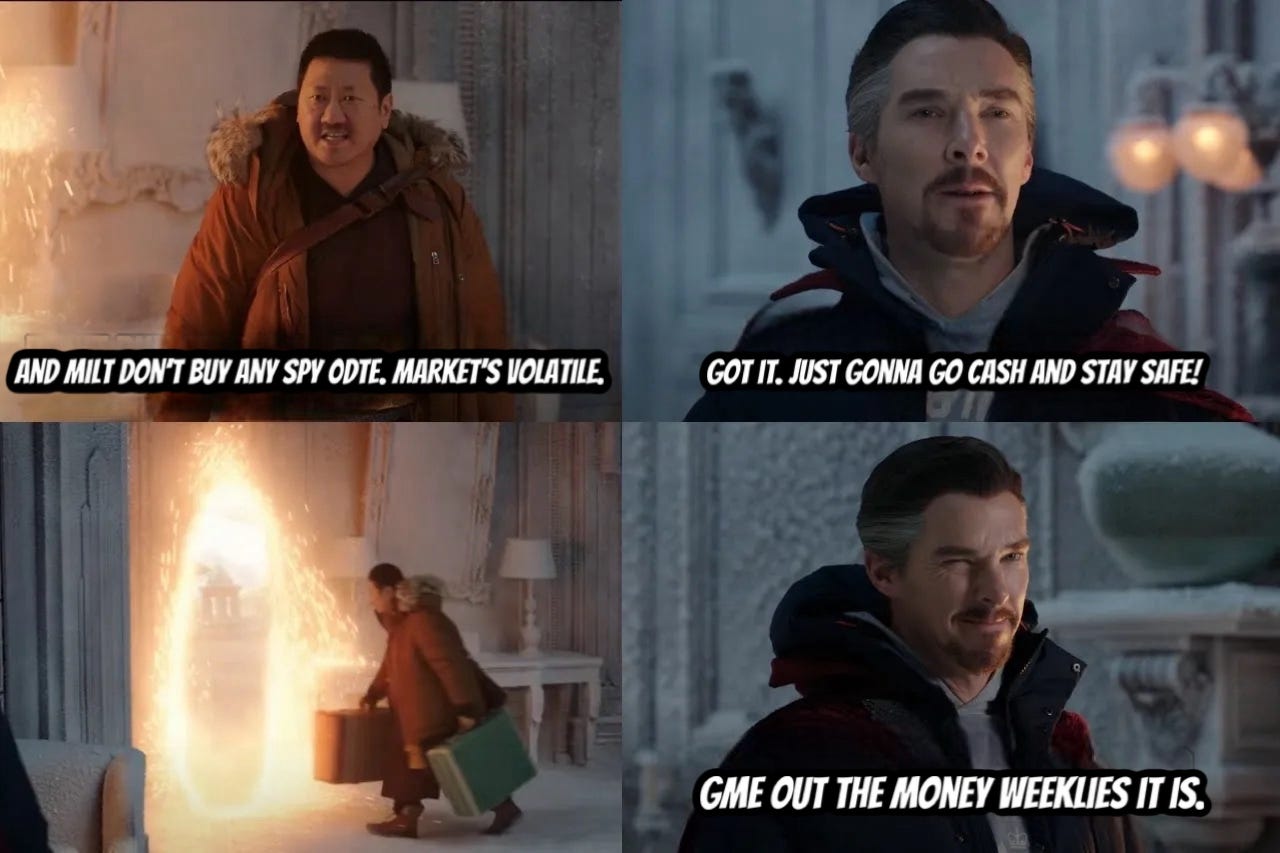
⏱️Dr. Range and the Time-Volatility Loop
Another Marvel ripoff to explore this market with!

This article references PARI Readings. PARI is an intraday and daily Price Action Risk Index I created based on a few factors. Here is a brief description for them, and the link for my TradingView account where you can add intraday PARI free.
For Daily PARI Readouts and analysis, subscribe to YEET Plus (it’s cheap AF)
PARI measures market fragility by analyzing momentum, volatility, and trend persistence. A falling PARI signals increasing risk of sharp moves, often preceding market instability. When PARI drops below 30, volatility surges, and sell-offs become more likely.
The Intraday PARI Indicator dynamically assesses real-time price action risk by tracking volatility, momentum, and trend persistence within the trading session. It provides a scaled risk score (0-100), where higher values indicate increased probability of price continuation and lower values signal heightened reversal risk.
🔮 THE WARNING FROM BEYOND TIME
Dr. Range sat before the great Chrono-Lattice, a web of market structure stretching infinitely in all directions—Margin calls echoed in a ceaseless loop. The fabric of time itself shimmered as he traced the widening megaphone, a pattern repeating across dimensions.
PARI pulsed erratically. The majestic new indicator’s glow had dimmed over the past two weeks, flickering from the 40s, to the 30s, to the 20s. The message was clear: the market was not moving forward—it was spiraling backward, trapped in an endless loop of retests and failures. Pops to be sold.
⏳THE FRACTURED TIMELINE
In the recent past, the market had run freely, momentum carrying it to ever-higher realms. But something changed. Two weeks ago, the path began to split.
🔮 The Decline Was Foretold
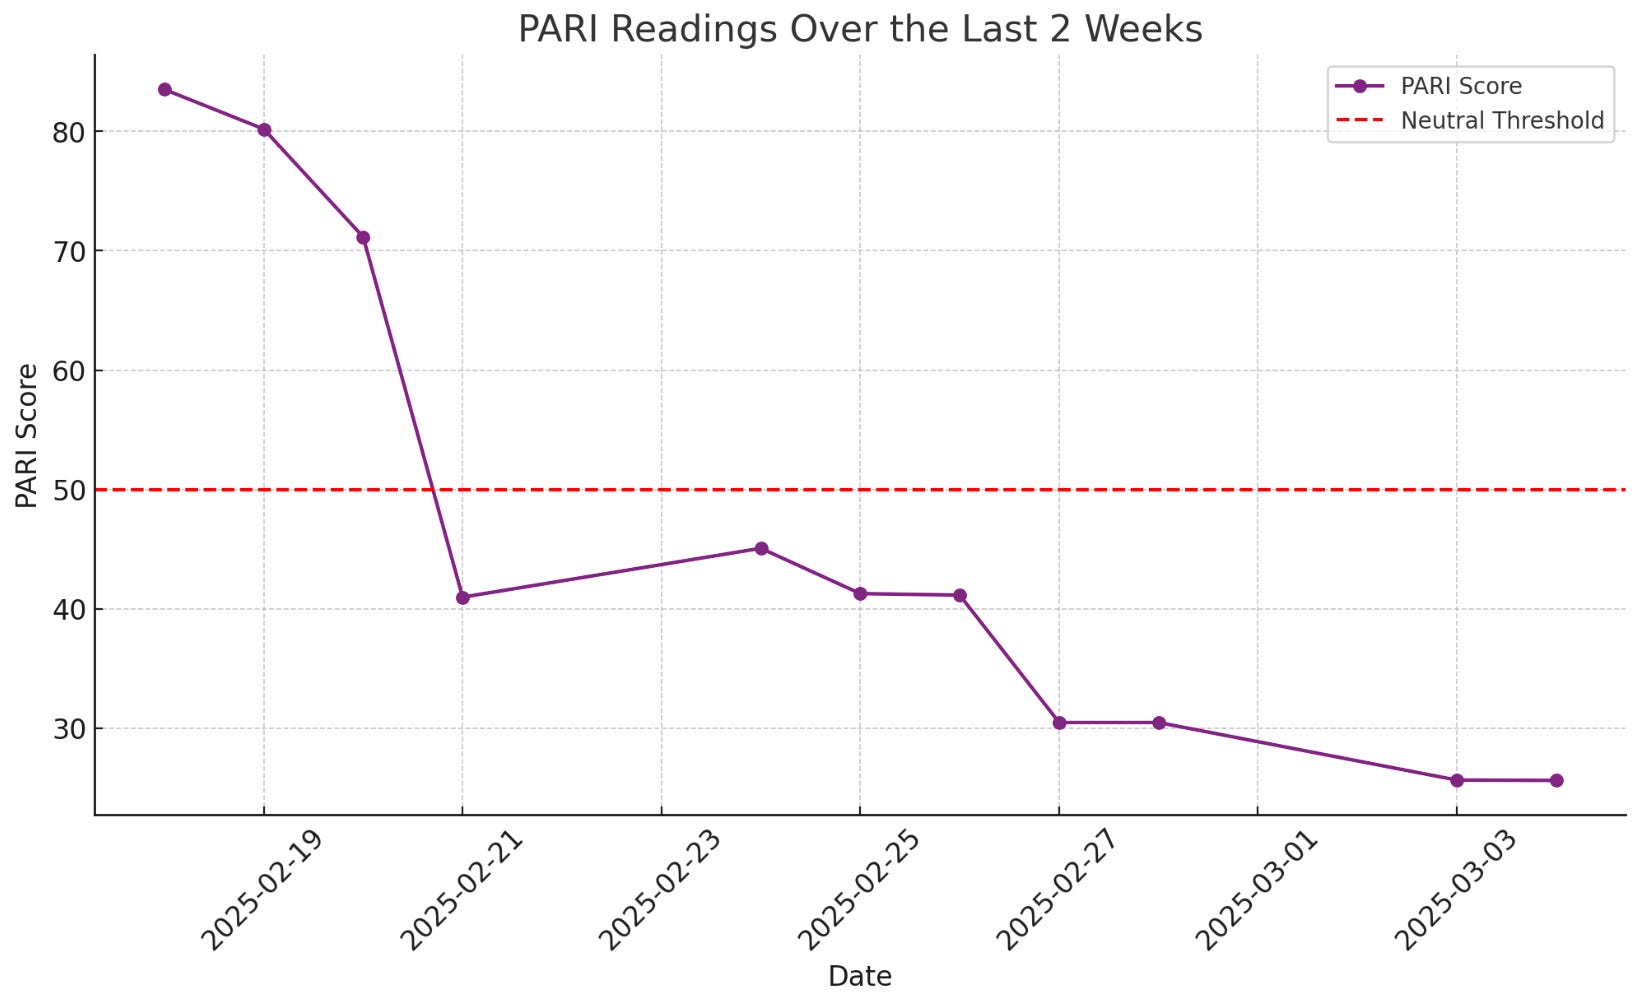
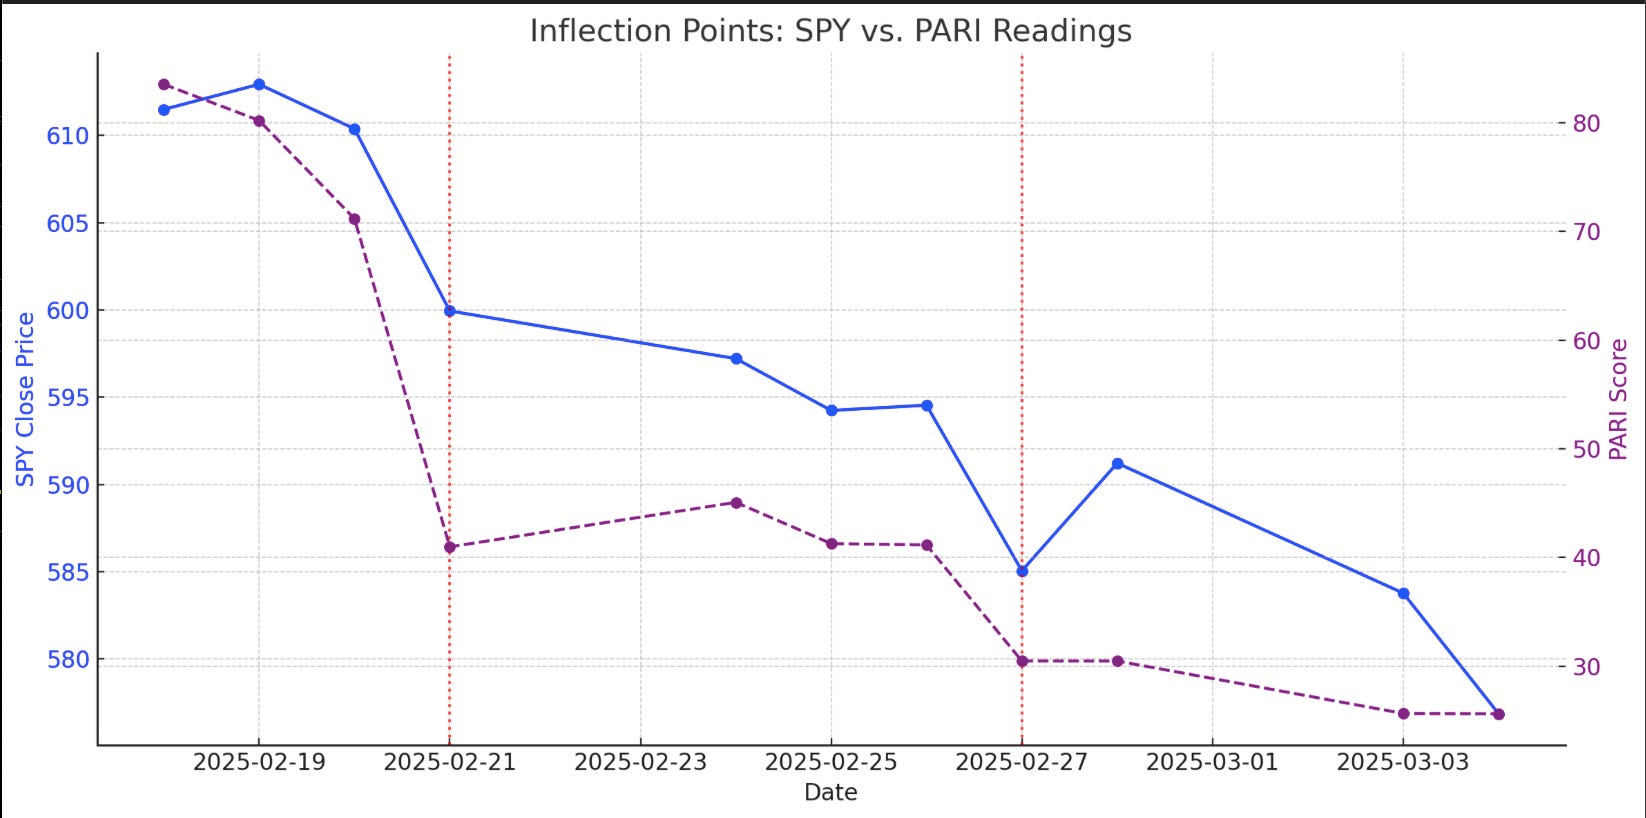
In mid-February, PARI had radiated strength, 85+ on the scale of stability—a realm of conviction and movement.
Then, cracks appeared in the continuum. PARI plunged before price ever did, a warning only visible to those who knew where to look.
The divergence widened: momentum drained, structure remained, and the illusion of trend became clear.
Dr. Range had seen this before. Time was trying to return to a place it had already been.
🔮 Historical Recurrences of PARI’s Collapse:
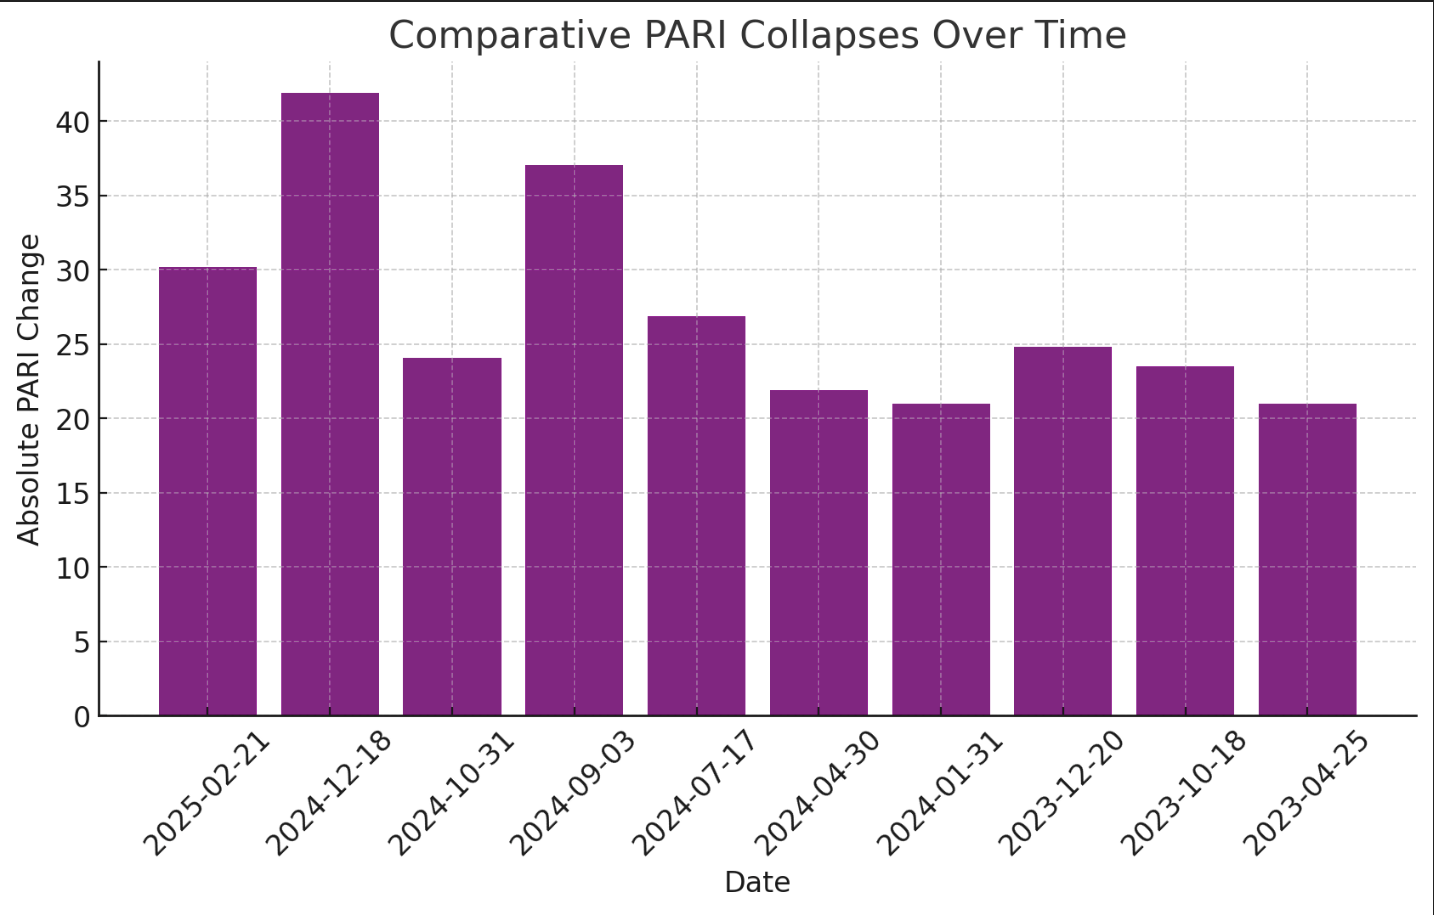
Feb 21, 2025 – A 30-point drop in PARI foreshadowed the breakdown that led to today’s structural rejection.
Dec 18, 2024 – A massive 41-point collapse, mirroring today’s conditions, with SPY at 586.28.
Sept 3, 2024 – A 37-point collapse, aligning with liquidity exhaustion before a major shift.
💀 This wasn’t just today’s problem—it was a repeating cycle, an echo of past liquidity crunches.
🩸MARCH 4TH: THE CONVERGENCE OF FATE

The market always tests the past before deciding its future. Today was no different.
SPY climbed back toward a monthly level, a relic of liquidity long left behind. This was a place where decisions had been made before, where the market had once either vaulted higher or been cast back down. Focus here on the monthly level, 582.44
Dr. Range saw the rejection before it happened. Intraday PARI was becoming weak, signaling a reversal, and so the market could not sustain itself at those heights. After the first monthly rejection we went into a freewill through time and space—that just so happened to be exactly the level needed of a monthly backtest.
Today seemed like a lot of things—but it was as simple as a tennis volley. All they did was reject a monthly and backtest the other below after the rejection. Simple Mechanics.
THE CURSE OF THE MEGAPHONE – A MARKET TRAPPED IN TIME
Time is not linear. It is a circle, spiraling outward, ever-expanding, yet always returning to familiar places.
🌀 SPY’s megaphone is not a breakout pattern. It is a containment field. The wider it stretches, the more violently it pulls price back into itself.
🔮 The backtest is not failure, it is necessity. Support and resistance are echoes of past choices, demanding recognition before the next timeline can emerge.
📉 Today’s rejection was not random. It was simply the latest iteration of a sequence that has played out before, and before that, and before that.
Dr. Range sighed. He had seen this cycle before. The question was—would this timeline ever break?
🎲THE FUTURE OF SPY – TWO POSSIBLE TIMELINES
Two paths appeared.
✨ The Market Breaks Free
In one vision, PARI surged as it starts to flatten, often happening before a curl upward at the lower 205th Percentile Extreme boundary. Then after reversing back above 30, breaking through 40, then 50, then beyond. The structure could no longer contain the move—SPY vaulted above the megaphone, leaving its recursive fate behind.
The Loop Continues
In another, the curse held strong. SPY remained trapped within the widening jaws of volatility, each attempt to break out met with rejection. The market was forced to return to its past, again, and again, and again.
Dr. Range knew one thing for certain. Without a resurgence in PARI, this timeline would never break.
Tomorrow a new adventure starts as one of our very own YEET Discord Mods takes on a $,1000 Challenge

🐳THE FINAL PROPHECY: YEET Plus
1) Today’s PARI Read and Context
2) FOLLOWING THE FLOW
⭐️SIGNATURE YEET Plus Trade with the new filter—FARCRY
(YEET Signture Trades have an 80% record of returning 100% or more a point during their lifespan)