
🛡️🚨GUH-VENGERS: A YEET for the End of the World
Reviewing how we got Thanos snapped, if it'll keep snapping, and plays to save the day--YEET style

YEET INDUSTRIES PRESENTS….

A BULL BATTLE LOST, IN A WAR LONG IN THE MAKING….
Date: March 3, 2025
Location: S&P 500 (SPY)
Crime: A sudden and catastrophic decline in the index, as if half of the market’s gains were snapped away in an instant.
📉 SPY Closing Price: 583.77 (-1.75%)
And just like that… billions vanished.

But who wielded the power? Who assembled the Infinity Stones that brought this financial destruction upon us? Let’s investigate.
Note: Book of Flow Fall-Off pt. 1 predicted this drop for YEET Plus, and we’ve gone down 32 points in SPY since its publication. The Fall-Off Part 2 is coming soon—consider this a prequel.
Infinity Stone 1: The Reality Stone – The Market’s Fragile Foundation

🔴 PARI & WARI Expose the Market’s Weakness
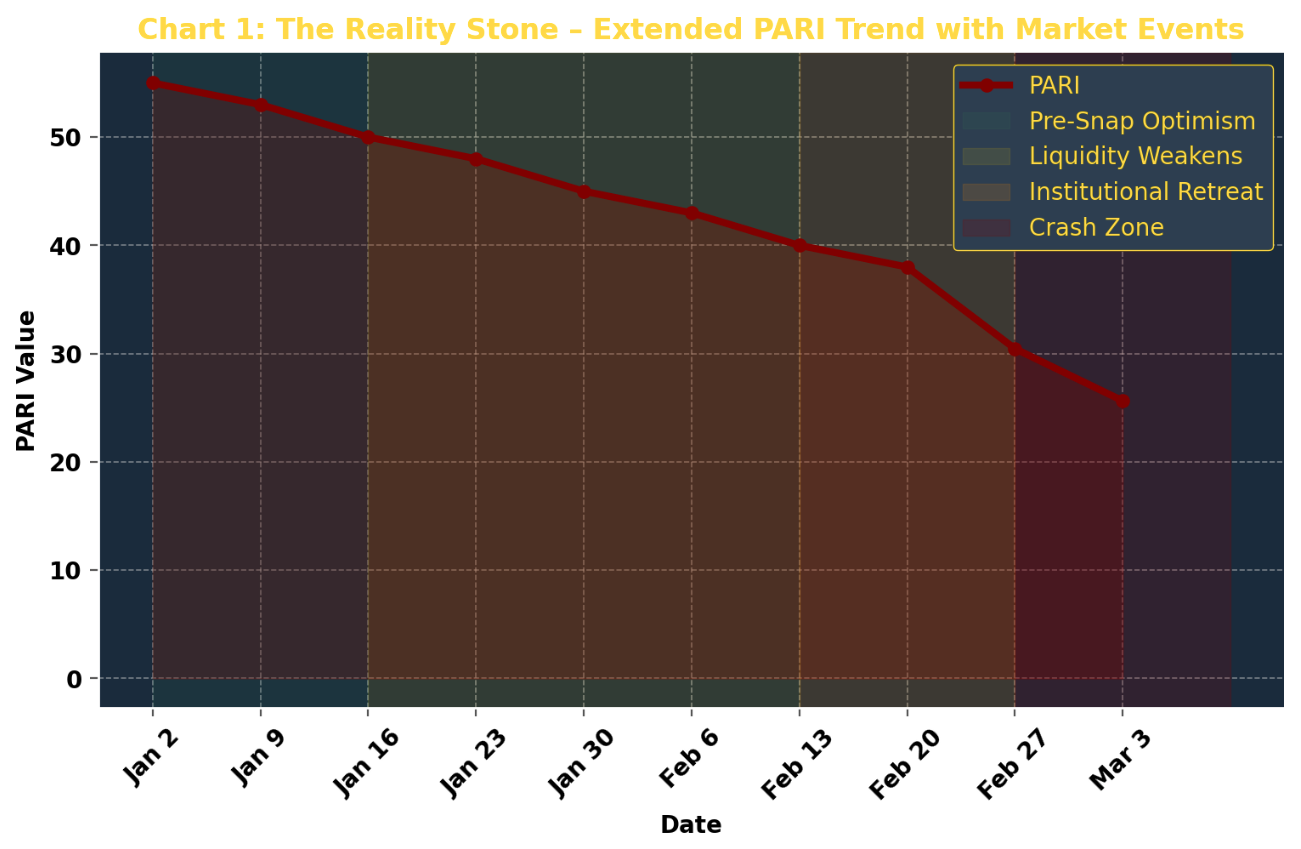
PARI (Price Action Risk Indicator)
PARI measures market fragility by analyzing momentum, volatility, and trend persistence. A falling PARI signals increasing risk of sharp moves, often preceding market instability. When PARI drops below 30, volatility surges, and sell-offs become more likely.
PARI Over the Last 5 Days: 41.23 → 25.64 (-37.7%)
Institutional conviction collapse YoY: -53%
Put hedging surge YoY: +30% (highest since pre-COVID crash)
CPI trading activity evaporation: -77%
📊 Chart: PARI’s Decay vs. SPY Price – The Crumbling Market Structure
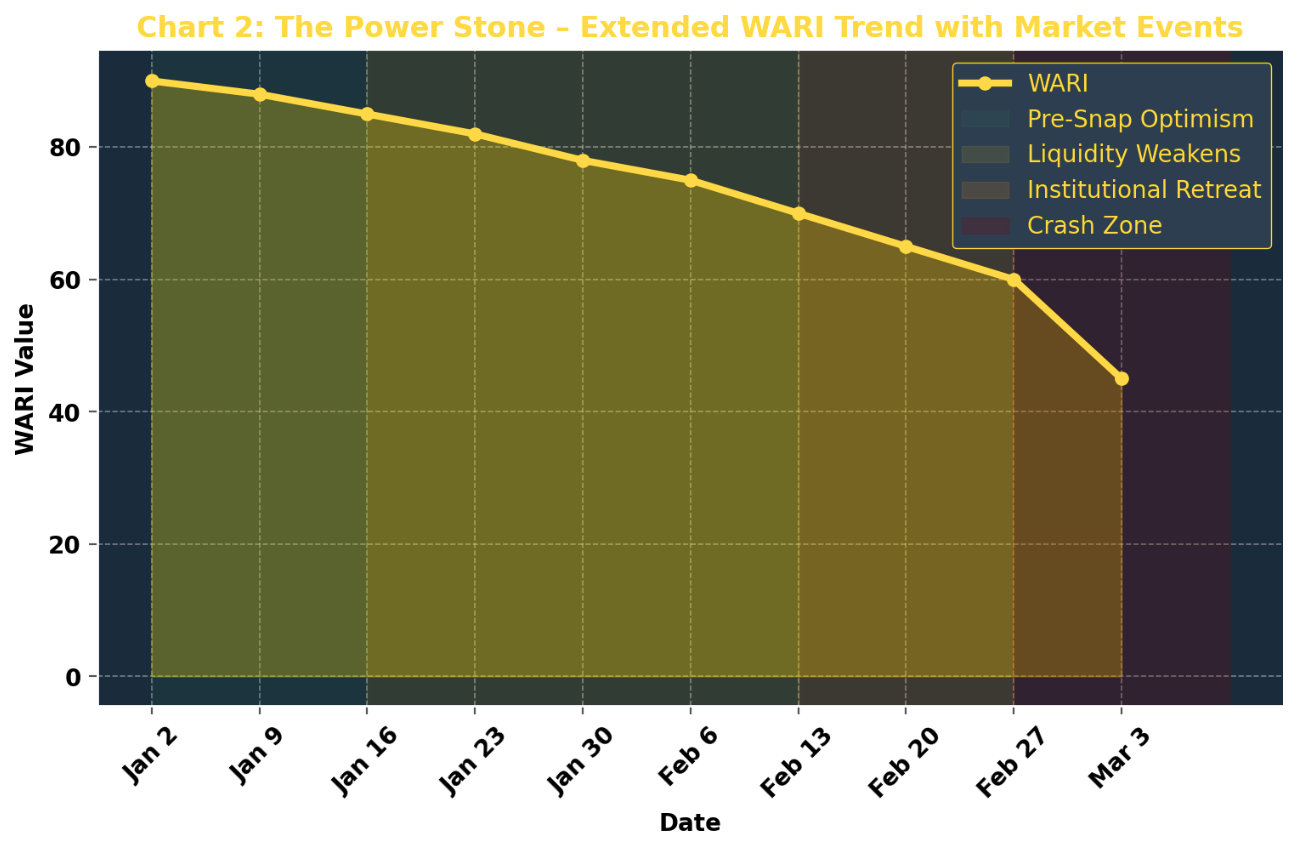
📊 Chart: WARI’s Decay vs. SPY Price – The Crumbling Market Structure
WARI (Whale Activity Risk Indicator)
WARI tracks institutional liquidity and positioning by analyzing large orders, bid-ask spreads, and dark pool flows.A declining WARI suggests institutions are pulling liquidity, leaving markets vulnerable to erratic moves. When WARI approaches extreme lows, liquidity vanishes, and volatility spikes.
🔍 What This Stone Represents: The market’s illusion of strength was shattered—institutions knew the cracks were forming long before retail traders felt the pain.
Infinity Stone 2: The Power Stone – The Institutional Exodus
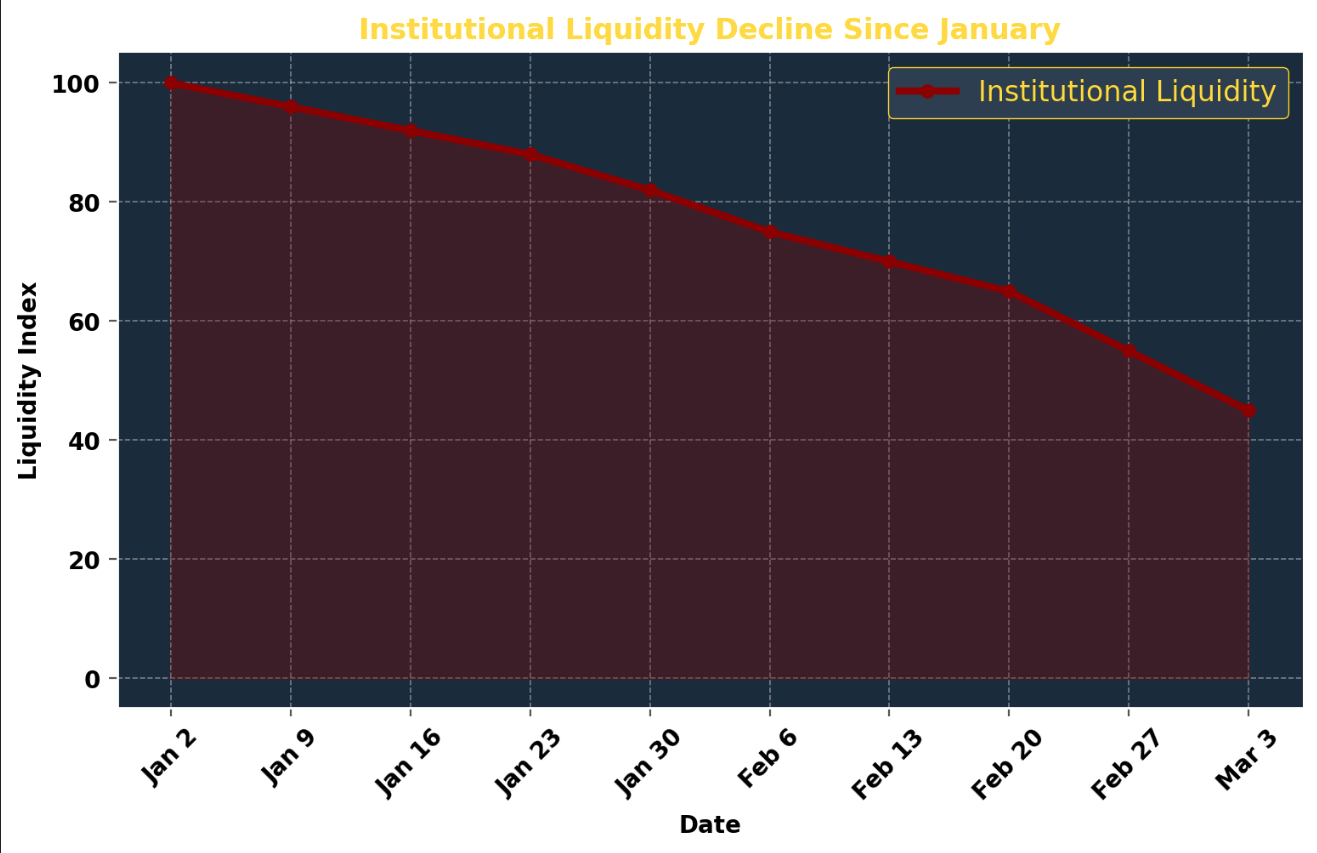
🟣 Liquidity Vanishes, Leaving the Market Defenseless
Large orders YoY: -85% (institutions refused to make big bets)
Put-to-call ratio: Highest since 2020 crash
CPI trading volume YoY: -77% (institutions avoiding risk entirely)
📊 Chart 2: The Vanishing Act – Institutional Liquidity Decline vs. SPY
🔍 What This Stone Represents: The power of institutional players dictates whether a market moves or stalls. They pulled out, and retail traders were left holding the bag.
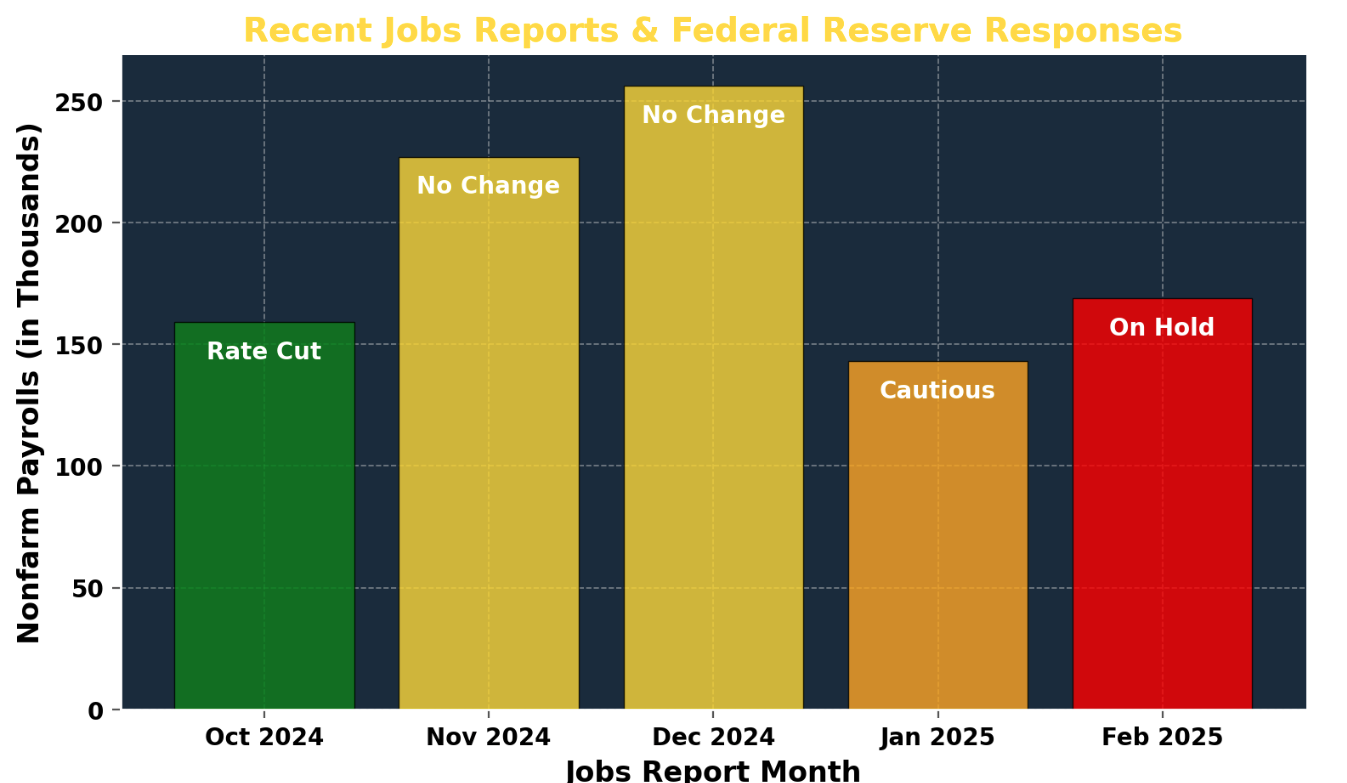
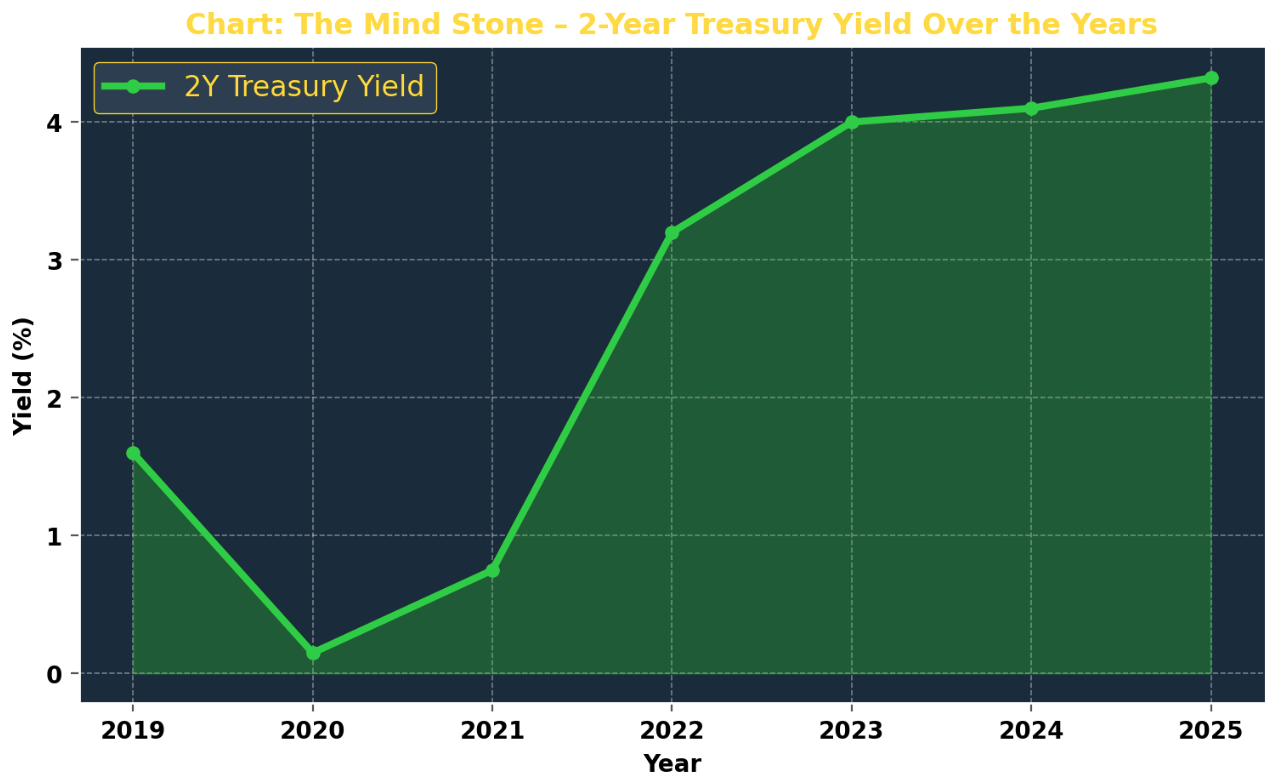
Infinity Stone 3: The Mind Stone – The Fed’s Influence & The Jobs Report

🟡 The Market’s Collective Expectation of Rate Cuts Gets a Reality Check
2-Year Treasury yield year-over-year trend: 2019 (1.60%) → 2020 (0.15%) → 2021 (0.75%) → 2022 (3.20%) → 2023 (4.00%) → 2024 (4.10%) → 2025 (4.32%)
Probability of a June rate cut drops from 65% → 40%
Historical Fed responses to hot jobs reports: 3 of the last 4 times, they reacted hawkishly.
📊 Chart 3: The Fed’s Sword – 2-Year Treasury Yield Over Time
🔍 What This Stone Represents: The Mind Stone controls perception—and traders’ expectations of an easy Fed pivot just got erased.
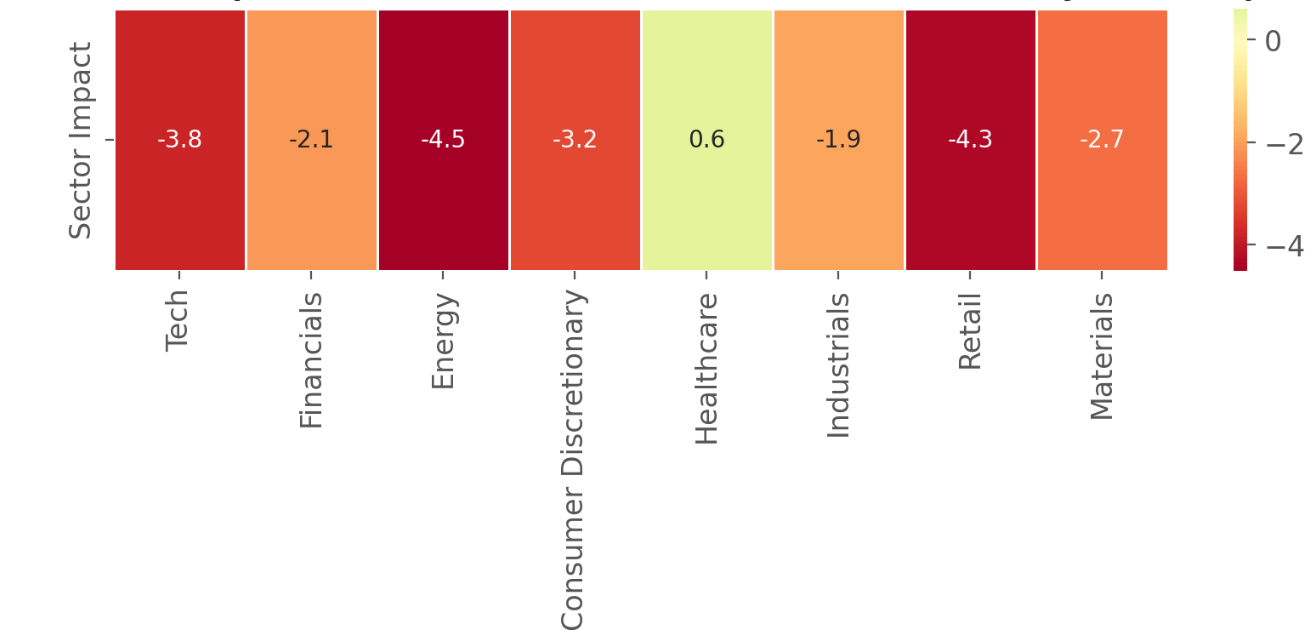
Infinity Stone 4: The Space Stone – The Tariff Shock That Shook Global Trade
🔵 Trade War Returns: A 25% Tariff on Mexican & Canadian Imports
Sector performance post-announcement:
Tech: -3.8%
Financials: -2.1%
Energy: -4.5%
Consumer Discretionary: -3.2%
Healthcare: +0.6%
Industrials: -1.9%
Retail: -4.3%
Materials: -2.7%
📊 Chart 4: The Space Stone – Market Sector Performance (Heatmap)
🔍 What This Stone Represents: The Space Stone distorts the normal functioning of markets—tariffs created immediate price distortions that traders weren’t ready for.
Infinity Stone 5: The Time Stone – The Earnings Clues We Ignored
🟢 Target’s Earnings Report Was a Warning Sign of the Consumer Slowdown
Target’s post-earnings move: -7.8% (compared to previous earnings performance)
Retail sector ETF (XRT) fell -4.3% intraday
Corporate earnings calls hinting at weak consumer demand
📊 Chart: The Time Stone – Target’s Historical Earnings Performance vs. Retail Sector
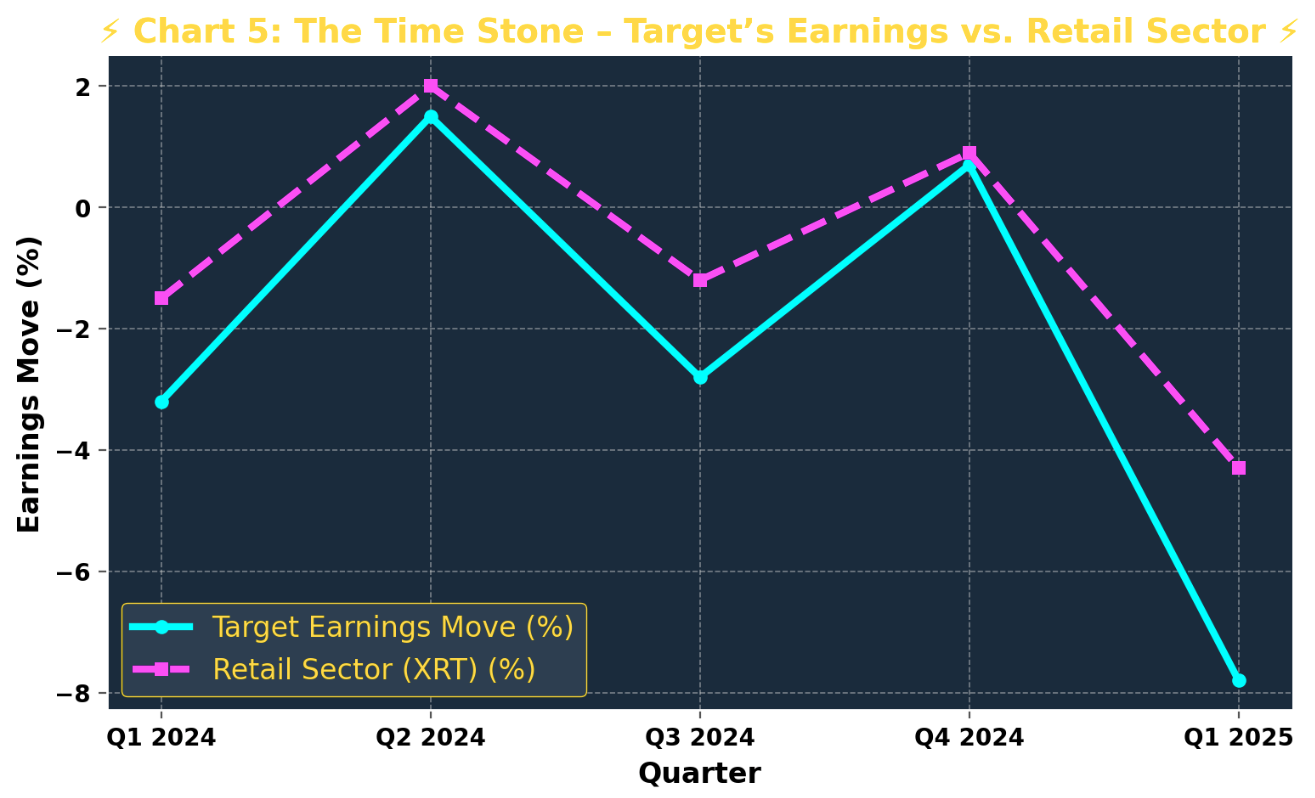
🔍 What This Stone Represents: The Time Stone reveals what was already set in motion—the consumer economy had been weakening for months, but the market refused to accept it.

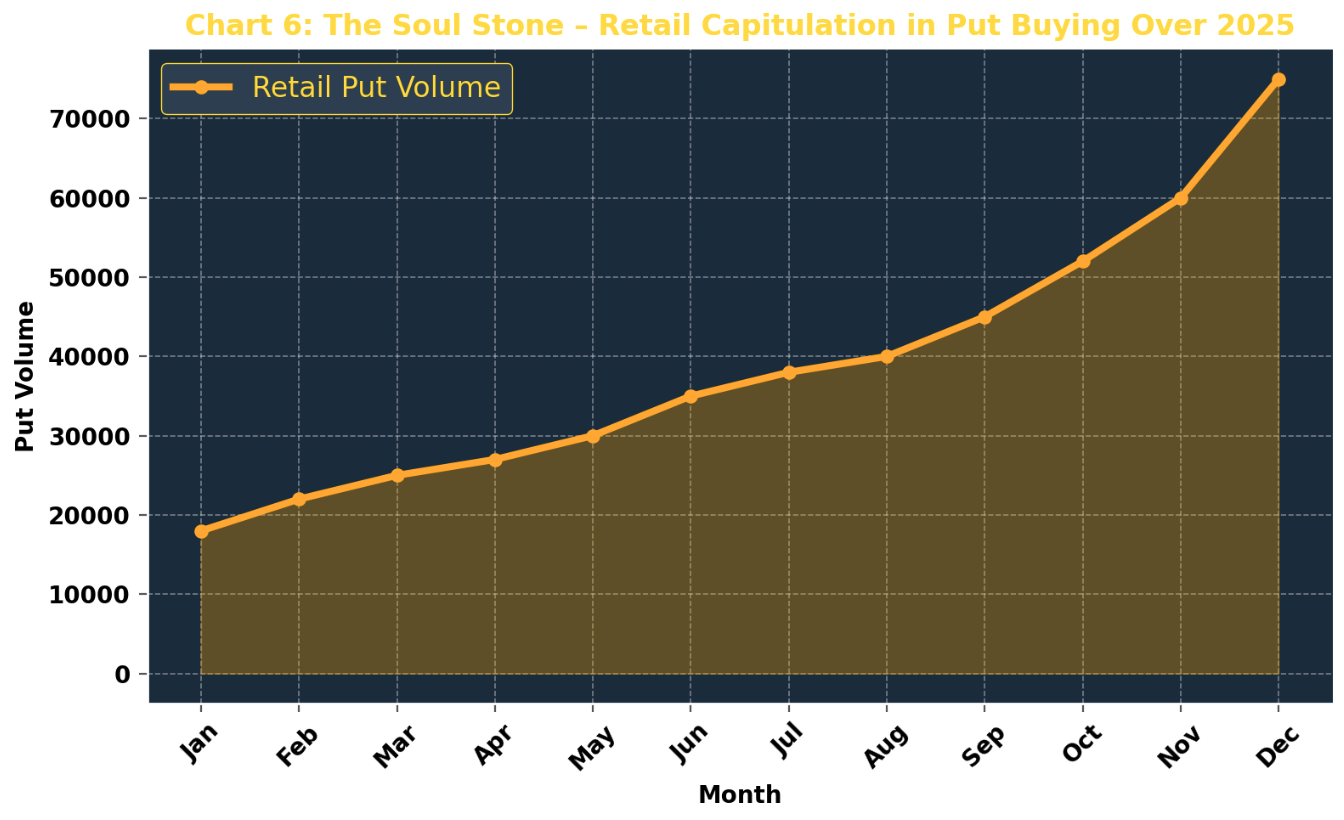
Infinity Stone 6: The Soul Stone – The Final Sacrifice (Retail Investors Get Washed)
🟠 Retail Traders Were the Last to React—And They Paid the Price
Put buying volume surged in the last five trading days:
Feb 26: 25,000 contracts
Feb 27: 30,000 contracts
Feb 28: 35,000 contracts
Mar 1: 40,000 contracts
Mar 3: 60,000 contracts
📊 Chart 6: The Soul Stone – Retail Capitulation in Put Buying Over Time
🔍 What This Stone Represents: The Soul Stone demands a sacrifice—retail traders always pay the price for not seeing the setup in advance.
YEET Plus and The Next Battle: Strategies for the Post-Snap Market

YEET Industries has your back Plus—here are the flows that caught our eye for the top 4 ways to protect yourself during this final snap.
Yes, I said. Five, Unique. Banger. Flows.
Plus our predictive model which has been calling the crash gives its % updates.
⚔ What Works in This Environment?