
🚨NVDA PARI Alert: Price Action Risk Index Shows a Potential Mega Short Coming
Nerd stuff.

🚨Basically, the Price Action Risk Index has shown swift weakness as NVDA floats at all time highs—a downside gift
August 13, 2025 🚀📊⚠️
💡 Narrative Thesis
Think of NVDA’s rally as a high-performance sports car 🚗💨 — it’s been flooring it to all-time highs, looking picture-perfect on the outside. But when you pop the hood, the gauges are telling a different story. Our PARI score — which blends momentum and volatility risk — just dropped 13 points in three days, even as price keeps coasting at record levels.
That’s the kind of bearish divergence that’s whispered “pullback incoming” more than once in NVDA’s history. And unlike SPY, which tends to drift down politely, NVDA’s “oops” moments can be sudden, deep, and a little dramatic. 🎭
📊 The Last 10 Days — PARI’s Slow Descent Setup
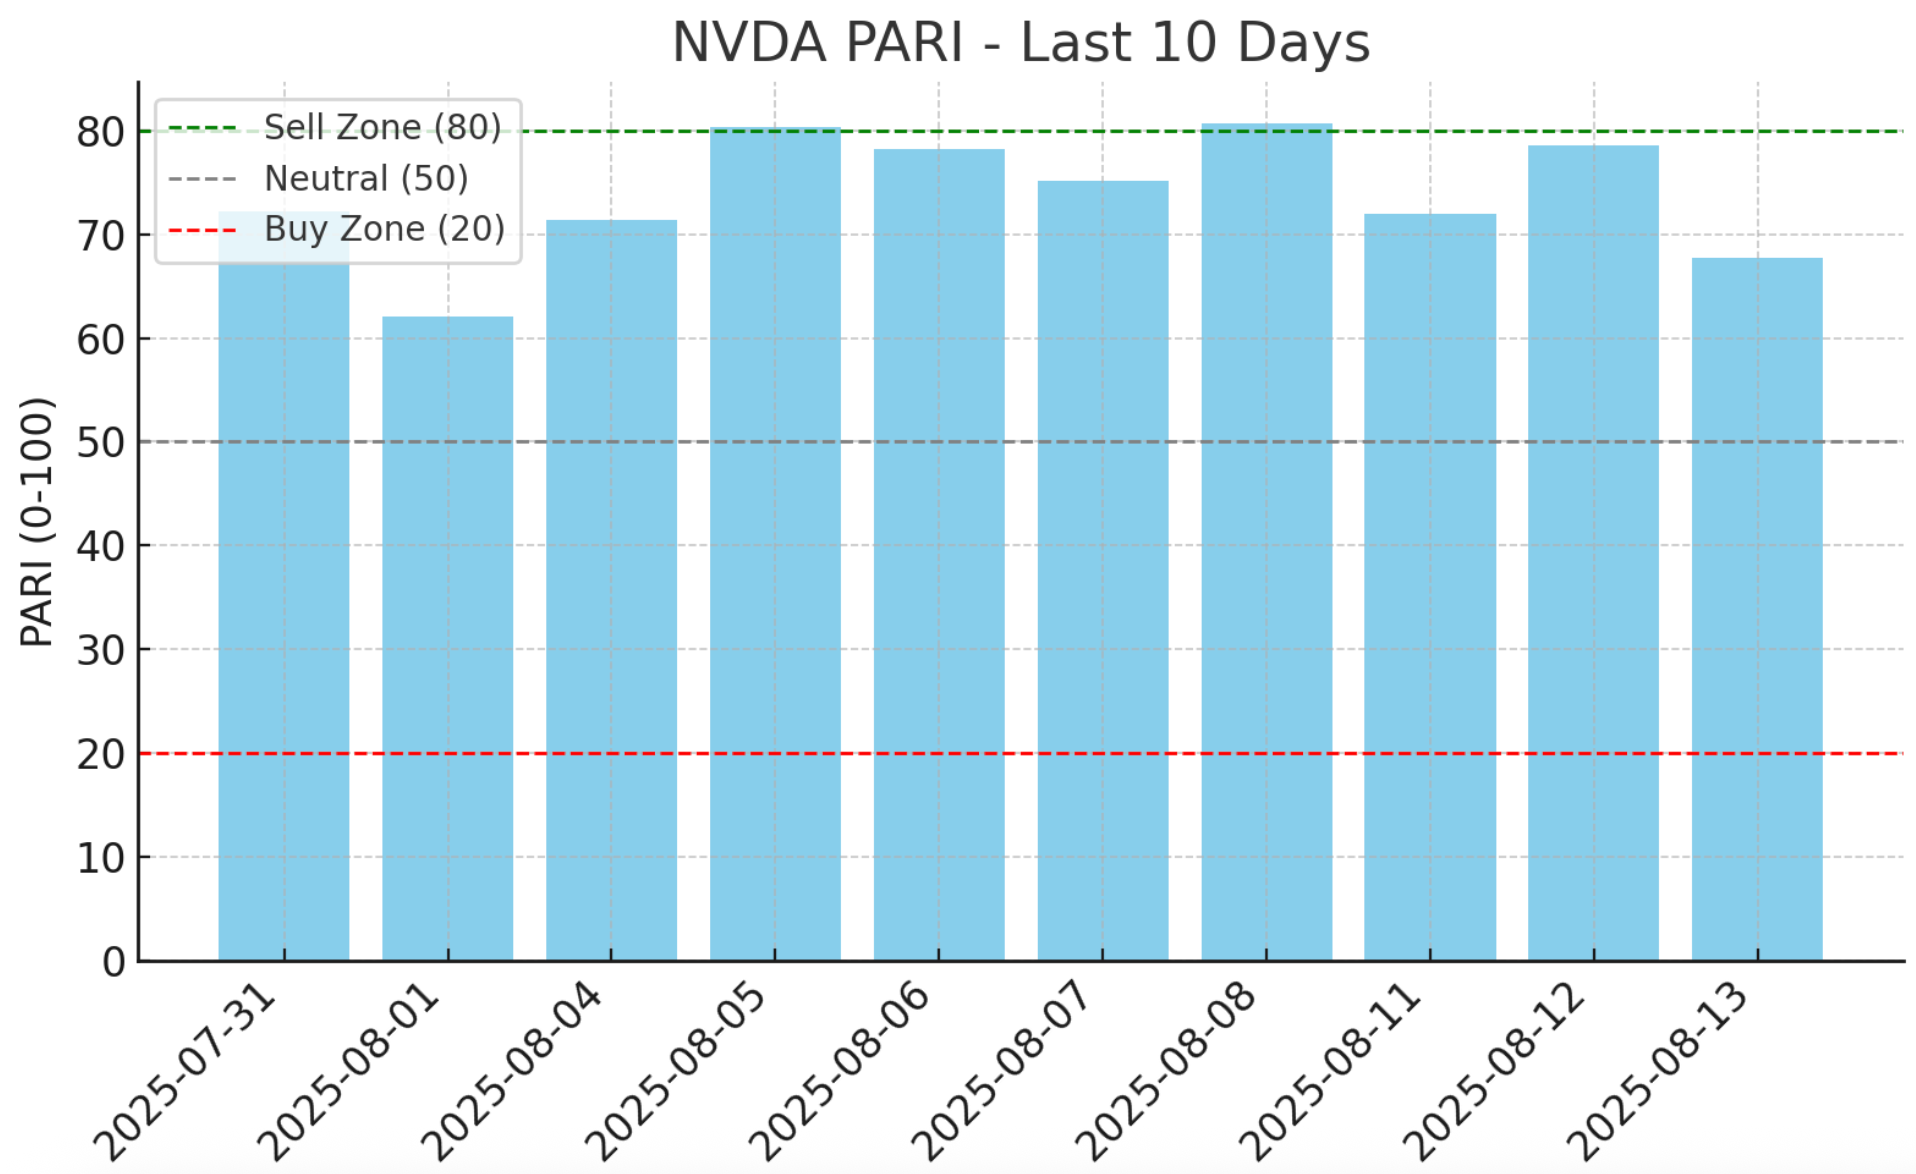
(Blue bars = PARI, dashed lines = key thresholds)
3 sessions ago: flirting with 80+ (Sell/Caution zone).
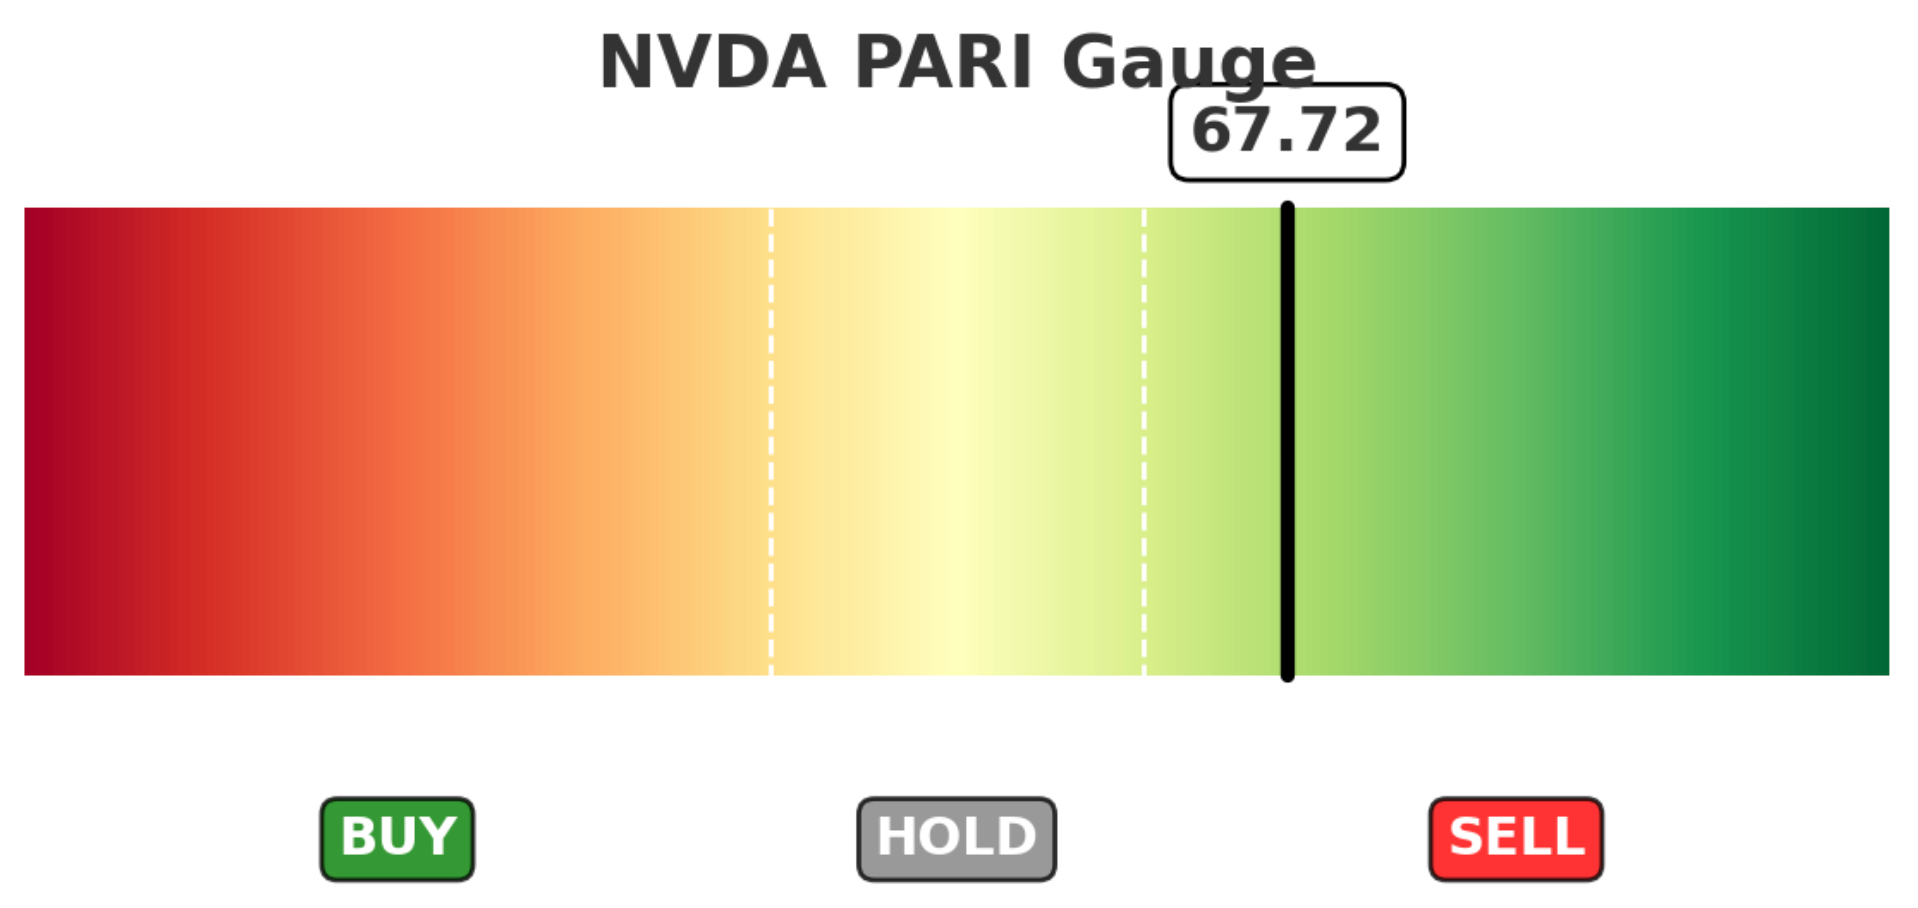
Today: 67.7, back into the upper-mid zone.
Price: basically unchanged at +2.1% in 10 days.
Translation: Price is still flexing, but internal strength is cooling. That’s your yellow-light moment.
📉 Under the Hood — 30-Day Overlay
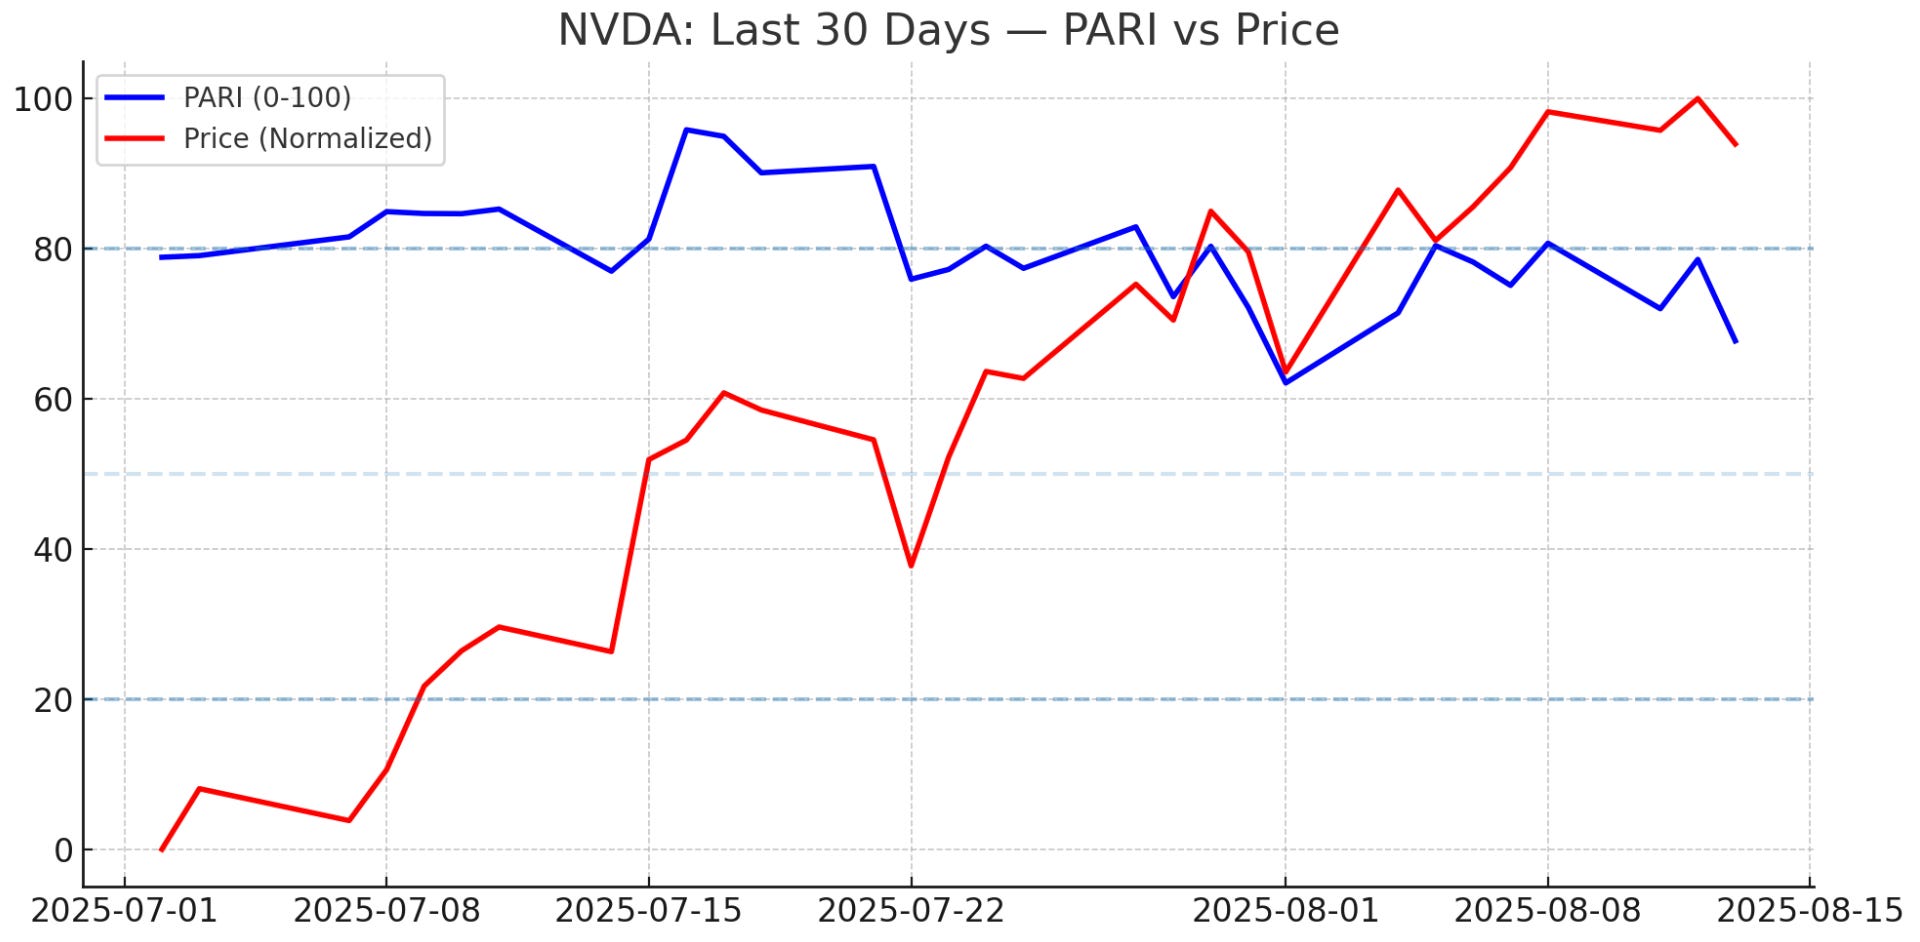
(Blue = PARI, Red = normalized price)
Price is still drifting up like nothing’s wrong.
PARI has rolled over — momentum down, volatility up.
This pattern shows up before NVDA’s “fast air pockets” more often than not.
📚 Why NVDA PARI ≠ SPY PARI
SPY: Tide chart 🌊 — smooth and predictable cycles.
NVDA: Heart monitor ❤️🔥 — quick spikes, sharp drops.
For NVDA, it’s not just about being above or below 80 — it’s the speed of the drop that matters.
Right now: Down 13 points in 3 days = fast.
🕵️ Backtest: What Happens Next?
We scanned the past 5 years for this exact setup:
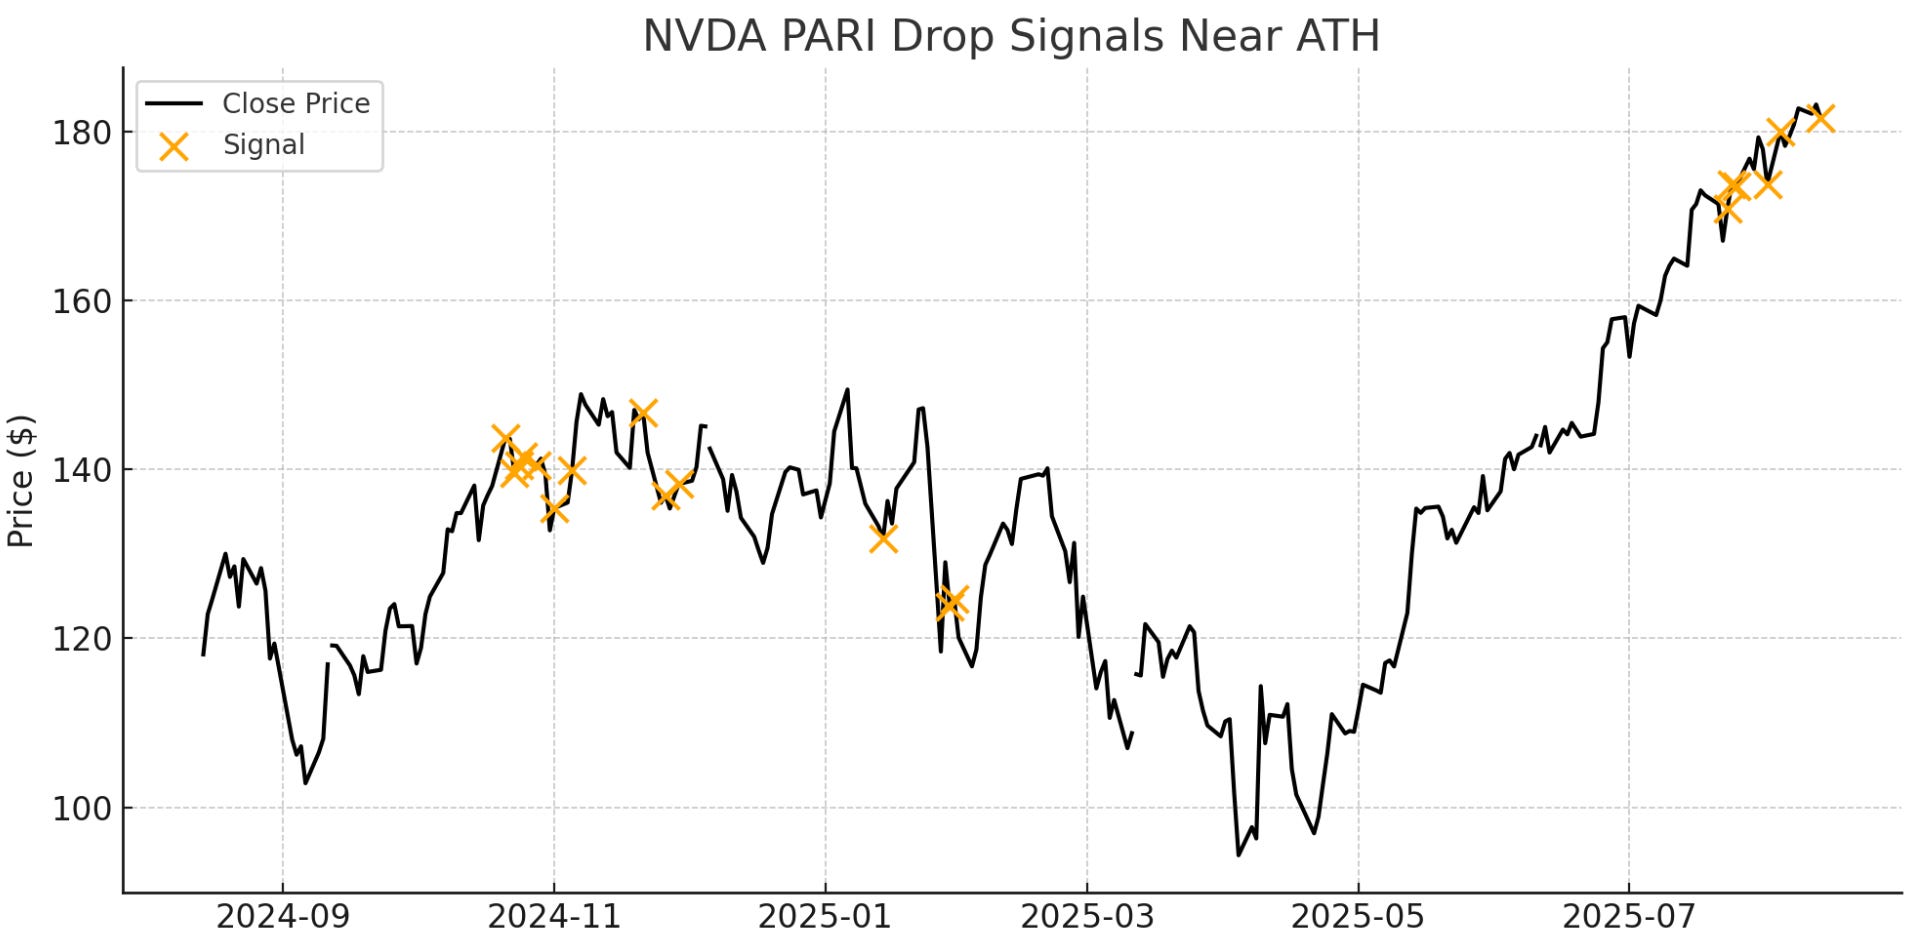
PARI drops ≥ 10 points in ≤ 5 sessions while NVDA is within 2% of its all-time high.
Results:
5 matches in the past 5 years.
Hit rate (10-day forward drop): 60% of the time price was lower.
Hit rate (20-day forward drop): 60% of the time price was lower.
Average move:
10 days after: −−0.3% overall (but ranged −5.3% to +6%)
20 days after: −−0.1% overall (ranged −3.2% to +4.5%)
Biggest drop: −5.33% in 10 days (Oct 21, 2024).
Key note: NVDA sometimes pops after this drop, but when it fails, it fails fast.
📅 Historical Rhymes
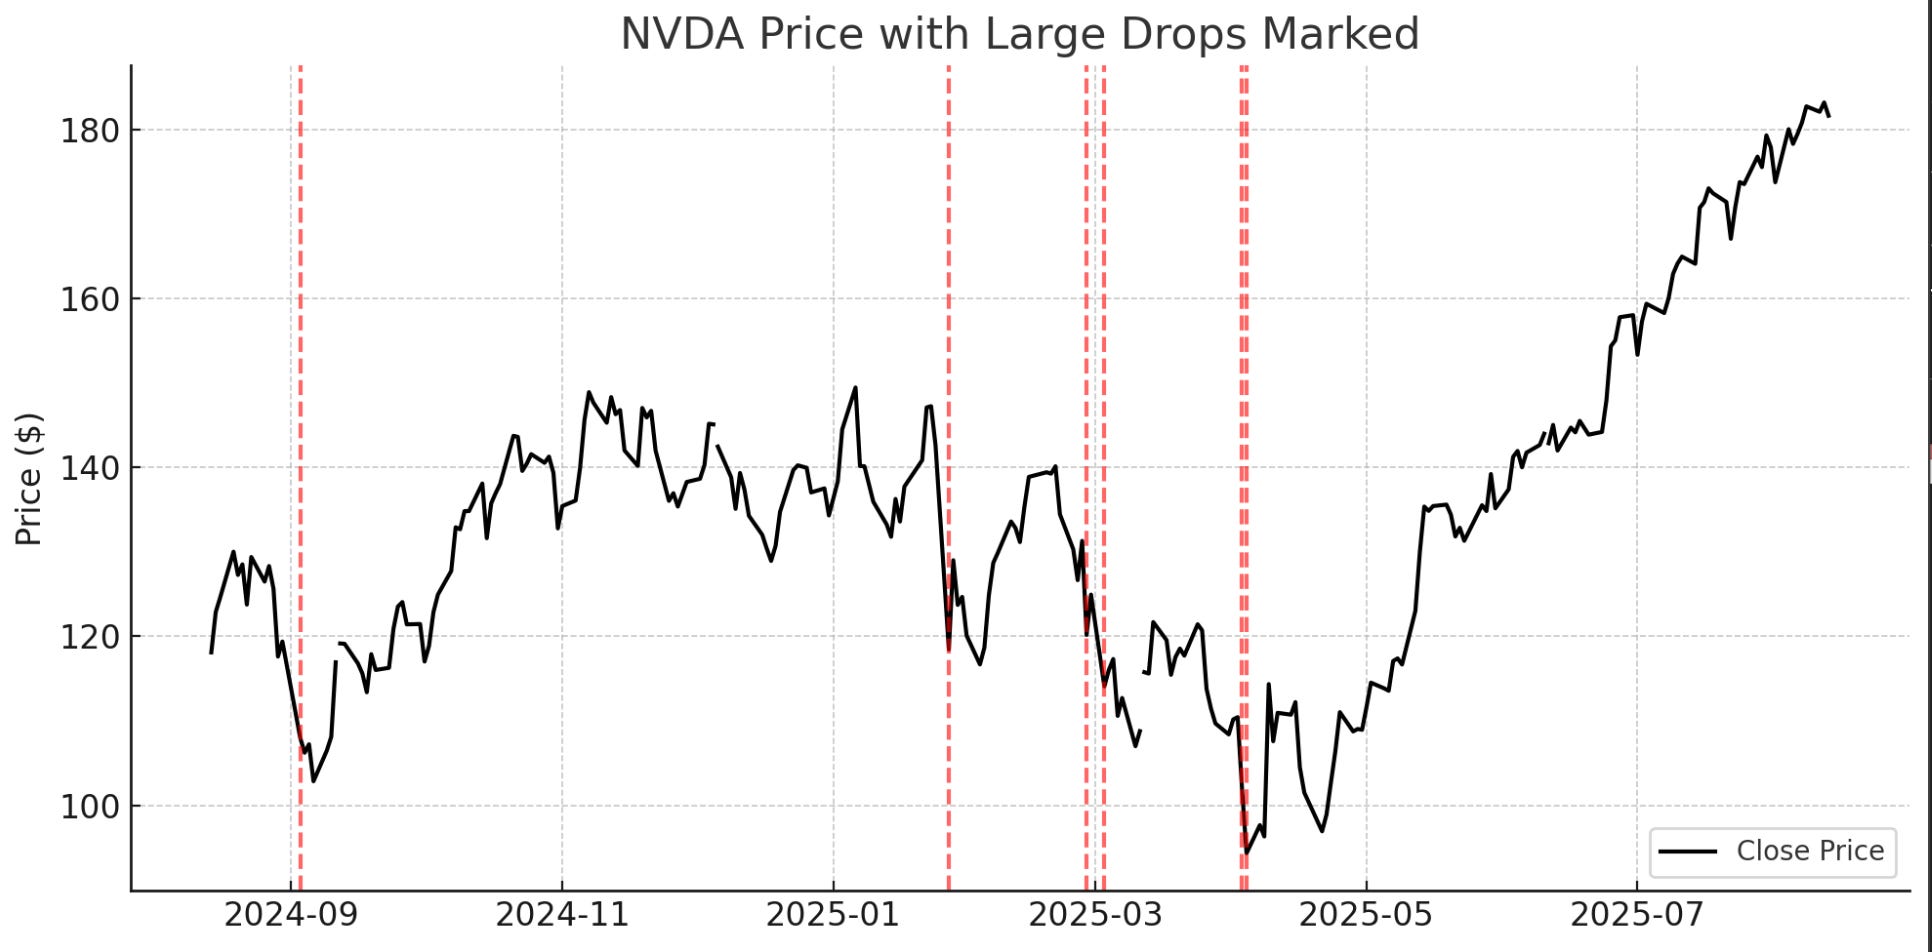
Jan 27, 2025: Big PARI slide → −17% in 1 day.
Apr 22, 2024: Sharp PARI turn → ~−10% into earnings.
2022 Bear Market: Slow bleed PARI → −62% peak to trough.