
🦢 ORANGE SWAN DAILY + NVDA Orange Swan Experiment
What is the market mood during this volatility?

🦢 ORANGE SWAN DAILY
We’ve now had 5 straight sells — five Orange Swan prints in a row down in the Bearish Pressure / Sell-Off Zone. When this thing clusters like that, it’s not noise… it’s the market telling you, “Yeah , we’re still in a downtrend.”
🟠 What Orange Swan Actually Measures
Orange Swan is our real-time fear/greed meter built out of flow, not vibes:
Calls vs Puts → which side whales are actually buying
Premium size → big checks = big influence
Ticker type → indexes (SPY, QQQ, etc.) get extra weight
DTE →
0–2 DTE: 🚨 urgent money
3–10 DTE: ⚠️ strong conviction
10–30 DTE: baseline
30+ DTE: 🐢 long-term positioning
All of that gets turned into a score from 0–10
0–2.5: Bearish Pressure / Sell-off zone
2.6–4.5: Cautious
5: Neutral
7.5+: Bullish / Risk-on
So when we talk about “Orange Swan is low,” that means whales are buying downside, not upside, weighted by how serious their bets are.
📉 Yesterday’s Reading: 1.77 (Bearish Pressure)
Yesterday clocked in at 1.77, another clean hit in the sell-off zone.
What it meant:
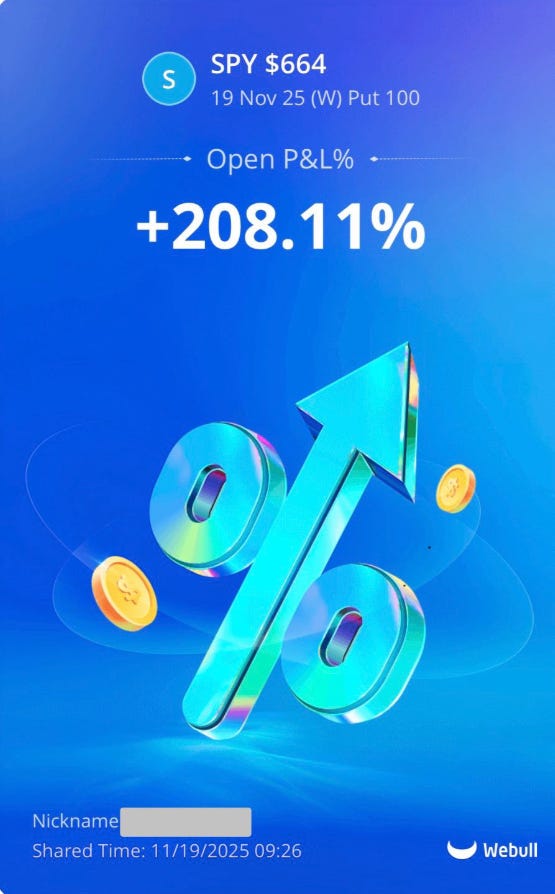
Heavy SPY/QQQ put activity
More short-dated downside than upside
Calls existed, but they were tiny premium nibbles vs huge put checks
Trend read:
“We’re still in a sell-the-rip environment.”
Four straight bearish pressure prints at that point — then today makes it five.