
🚨PARI Says Pullback: YEET for 9/22/25 (and daily PARI announcement!)
big issue

Ran PARI for today, and good news for the YEET Faithful—I was able to restructure a little at work, so now we can do PARI daily each day for Plus as well as Yolo of the Day—thanks for your patience!
🔑 Key
🟥 Red = Monthly
⬜ White = Weekly
🟨 Yellow = Homemade
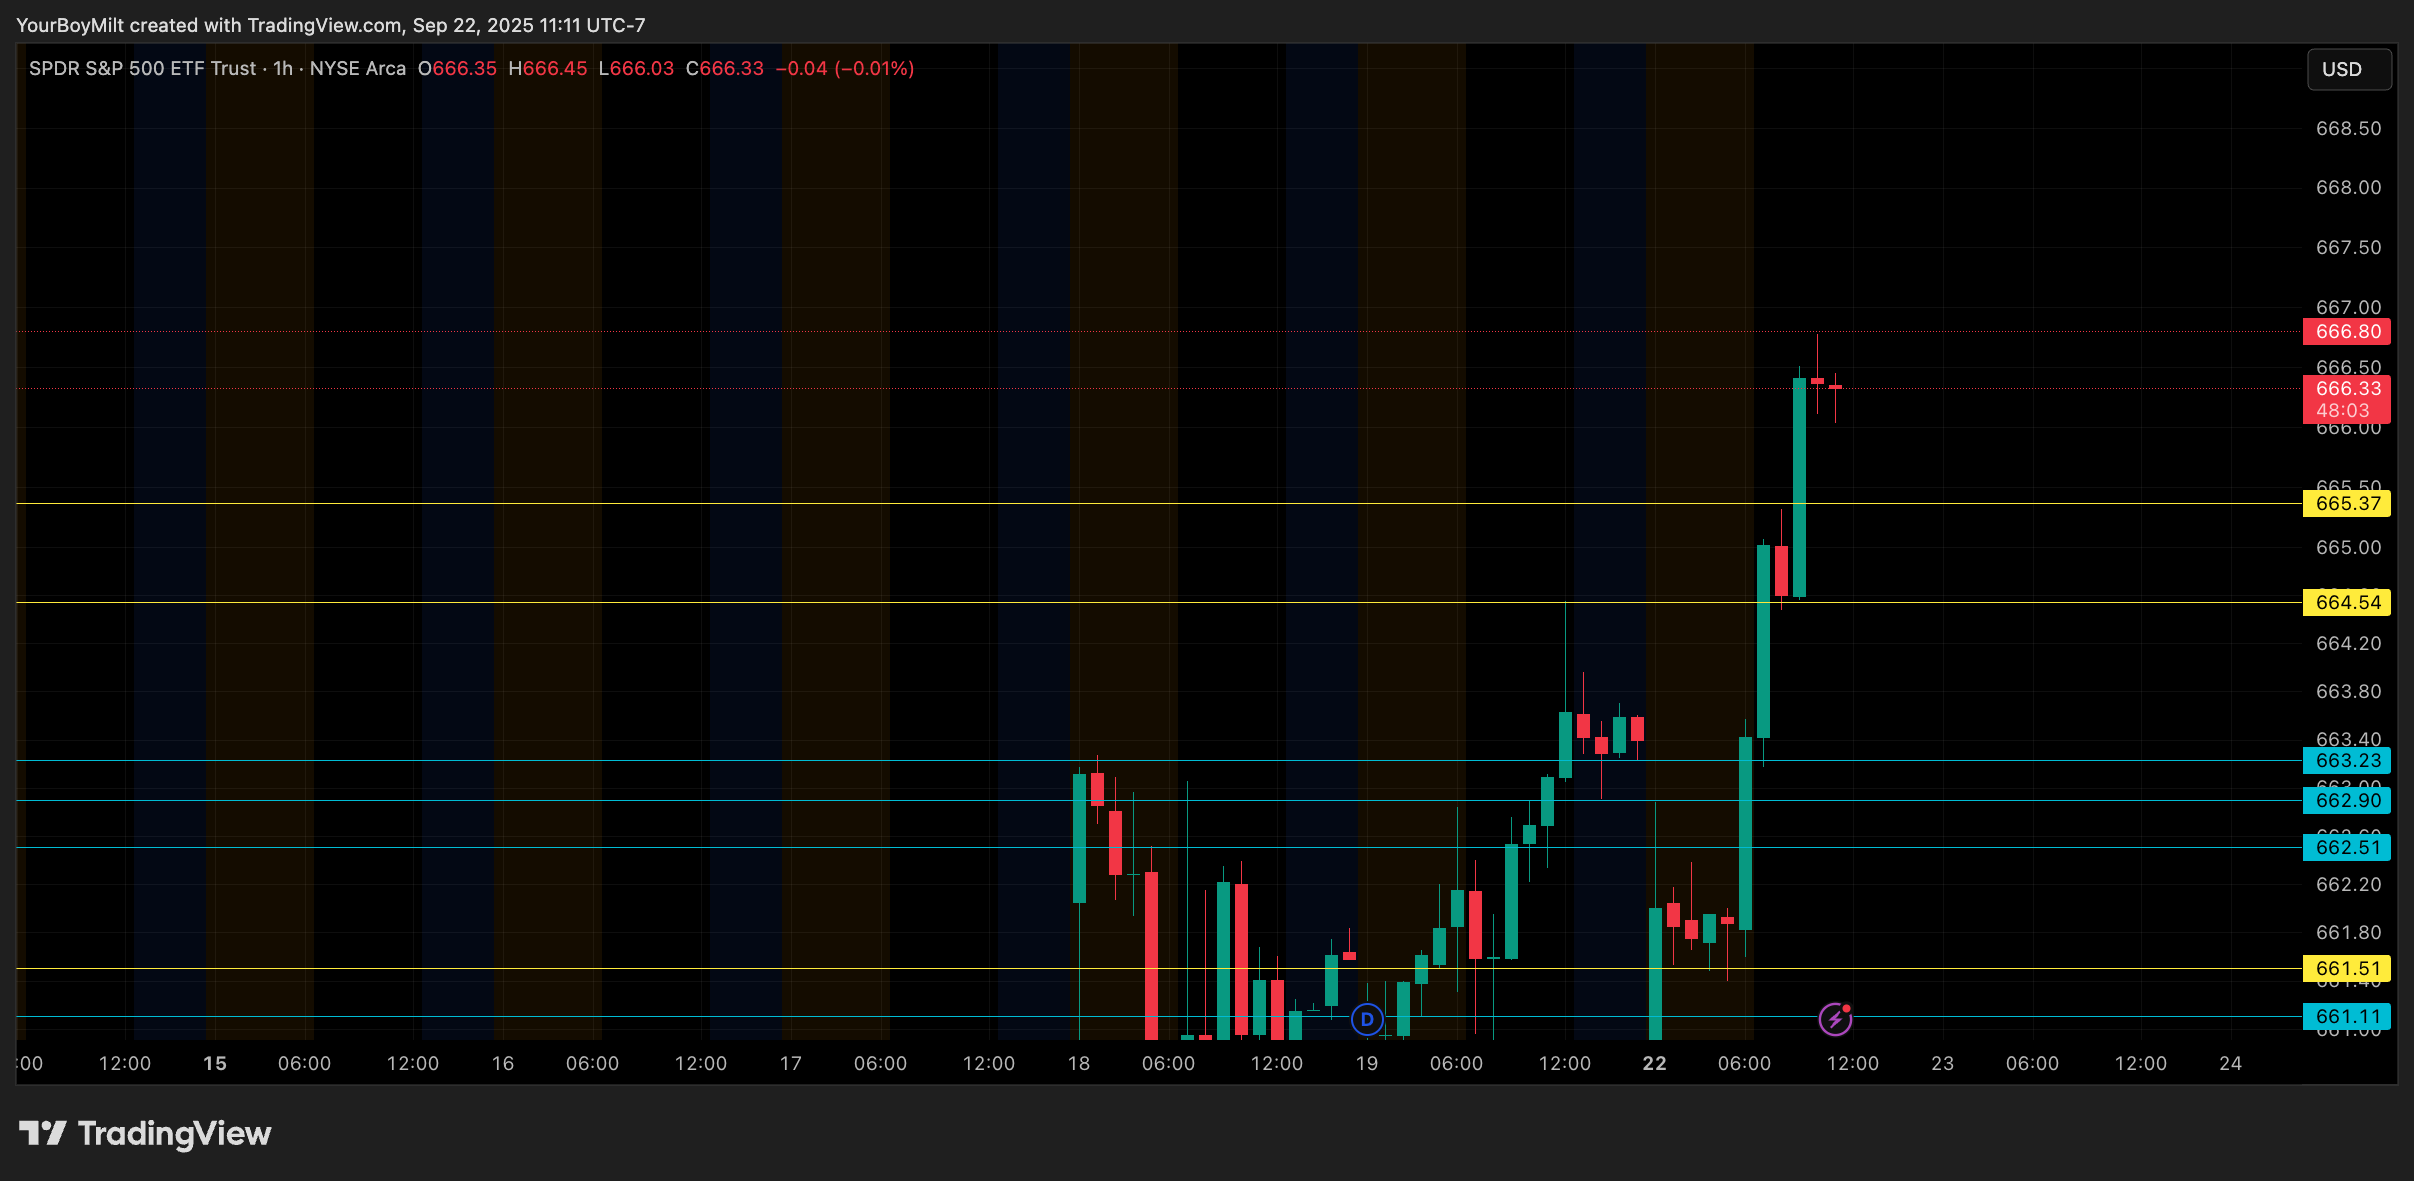
Current SPY Levels
🟥 666.80 (monthly)
🟨 665.37 (homemade)
🟨 664.54 (homemade)
🟦 663.23 / 662.90 / 662.51 (cluster — shorter-term support/resistance)
🟦 661.51 / 661.11 / 660.73 (cluster)
⬜ 659.71 (weekly)
🟨 659.21 / 659.11 / 658.38 (homemade cluster)
🟨 656.22 (homemade)
🟨 654.76 (homemade)
⬜ 652.22 (weekly)
🟨 650.88 (homemade)
📰 PULLBACK TIME: Time to Cool the Jets — SPY PARI, Sept 22, 2025
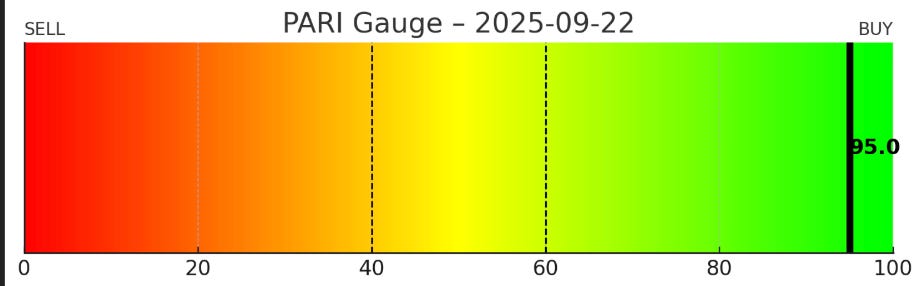
For the last two weeks, the market has been running on rocket fuel. Each dip has been bought, every test of support shrugged off, and the tape has that unmistakable “everything’s fine” glide to it. But under the hood, our Price Action Risk Indicator (PARI) is flashing something we rarely see: a reading up near 95 out of 100.
On the surface, that looks amazing — the gauge couldn’t be greener, momentum couldn’t be stronger. But for us, that’s actually the danger signal. Think of PARI like a thermometer. When it’s cold, no one wants to step outside (sub-40 readings, the chop zones). When it’s in the 60s and 70s, it’s perfect weather for trends to run. But when it pushes into the 90s? That’s a fever. Markets don’t stay that hot forever.
🔥 How We Got Here
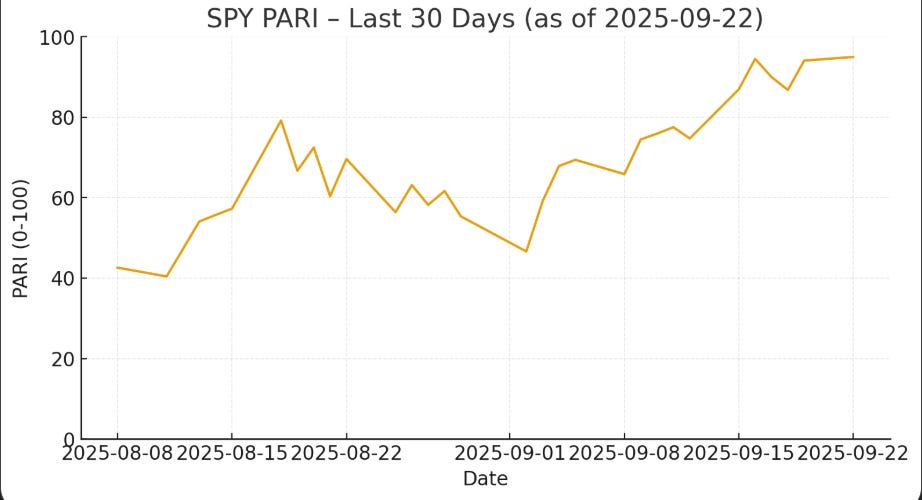
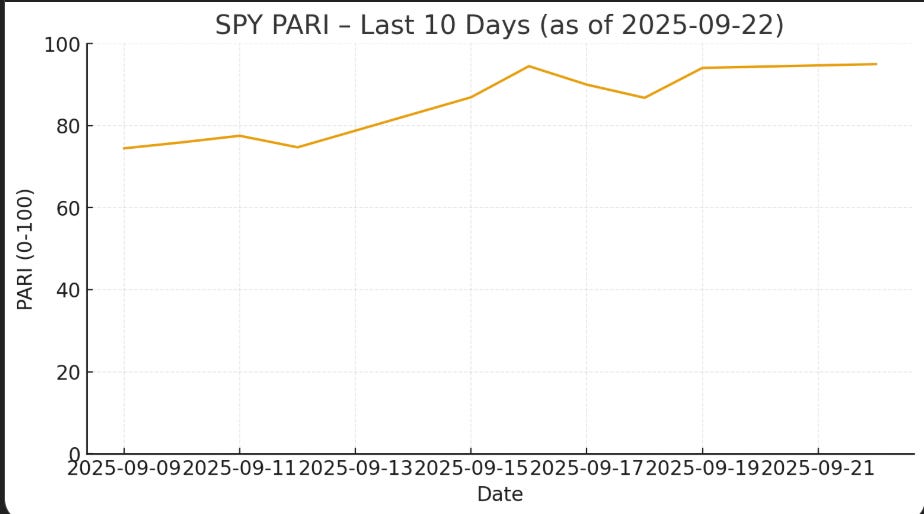
Over the last 30 days, PARI has marched from the low-40s to the mid-90s in almost a straight line. That’s rare. Even over the last 10 days, every pullback was shallow — the indicator refused to dip under 70, let alone threaten a neutral reset. That kind of persistence screams buyers crowding the tape.
The climb: from neutral to thrust without pause.
⚖️ What It Means
Yes, the gauge looks bullish. But historically, these high-end prints mark exhaustion. It’s not that price has to fall apart immediately — often the first act is sideways drift, not collapse. Think of it like a runner sprinting the first lap of a marathon. They’re ahead, sure, but the next stretch isn’t going to look the same.
When PARI presses into the 90s, expected returns forward one to two weeks actually flatten. That doesn’t mean short everything — it means temper the expectations. If you’ve been long, this is the spot to trim, lock in, or at least cool position sizing. If you’re waiting on entries, the odds favor better risk/reward once this fever breaks.
🧊 Cooling Down Isn’t Bearish
The trap here is thinking “cooling down” = “short it.” That’s not the message. PARI doesn’t say trend is ending; it says the risk balance shifts. Imagine sitting on a beach at noon, full sun, no shade — you’re not in danger yet, but if you stay too long you’ll burn. Same idea here.
95 out of 100: the fever zone.
🛠 The Playbook
For day traders, expect chop up here. Breakouts don’t travel as cleanly once the fever sets in. A sideways Tuesday can look bullish in the morning and bearish in the afternoon. Manage quick.
For swing traders, stop thinking “add” and start thinking “scale out.” Trim into strength, recycle cash. Waiting for PARI to reset into the 60s often delivers cleaner swing entries.
For options traders, this is the spot to stop paying up for calls. If you must express bullish bias, keep it light — debit spreads over straight long calls, defined risk over open risk.
🧭 Levels Still Matter
Price is camped under the monthly at 666.80. That magnet has been pulling for days. If we tag and stall there with PARI at fever pitch, the setup for digestion is textbook. Below, the 662–663 cluster is your first tell if buyers lose grip.
👉 Bottom line:
We’re in thrust mode, but thrust doesn’t last forever. PARI at 95 says the next chapter is less about vertical upside and more about cooling off. Protect wins, lean out of the FOMO, and let the market breathe.