📕Poor Milton's Almanac, A 2025 Trade Manual: Chapter 1
Your guide to everything trading and beyond in 2025

Note: be sure to be signed up for YEET Plus and the Garden for continued access to the 12 Days of YEETmas. Starting next week, it’s exclusively in the Garden. So far:
✅Day 2: 100% SPY, 120% FOUR, 45% TSLA
✅Day 1: 380% SPY, 330% SPY, 130% PLTR
There have been no losses.
When Benjamin Franklin wasn’t busy doing unseemly things, he was in the process of creating a lot of stuff. My favorite of that stuff was a collection of stuff known as Poor Ricard’s Almanack. For those who’ve never heard or seen one, it’s a collection of useful tools, musings, measurements, predictions, and whatever else can give a period of time context and excitement.
Chart Education (Beginner, Intermediate, Advanced): 🌱 🌿 🌳
Flow Education: 🌱 🌿 🌳
Trade Prep: 🌱 🌿 🌳
Trade Approach (Mentality, Tools, Ideas): 🧠 🔧 💡
💡 Chart Pro Tip: 🎯 (Targets) 🚪 (Entry/Exit) 📊 (Trade Management)
💡 Flow Pro Tip: 🎯 (Targets) 📰 (News) 🔍 (Tracking) 📈 (Filters)
🧠 Trade Approach: Let’s Get You Through the Week
Whether you use hand-written lists or automations, it’s critical you have a system. Not for the value of organization—I’m as disorganized as they come—but because it directly affects your win percentage.
💡The Moment You Introduce Hunches, Exceptions, and Concessions into trade choices—especially flow—is the moment you’re getting lucky rather than improving.
🛠️ Preparation: Weekly Market Prep Checklist
Flow 0% 🐋 —|—————————————————————————| 📊 100% Chart
🧠 Know Your Indices: This is our foundation. Where are we, what are the possibilities, and what opportunities am I waiting for?
ES needs to be seen in three views:
A view that lets us see all activity at once.
A view that isolates key structure like trendiness and breaks.
A “sandbox” where we can draw fresh patterns etc., from a place uncluttered.
For those who are the intro to charts/beginner level, I will be going over these monthly level sets in live sessions this week and will record the videos for plus.
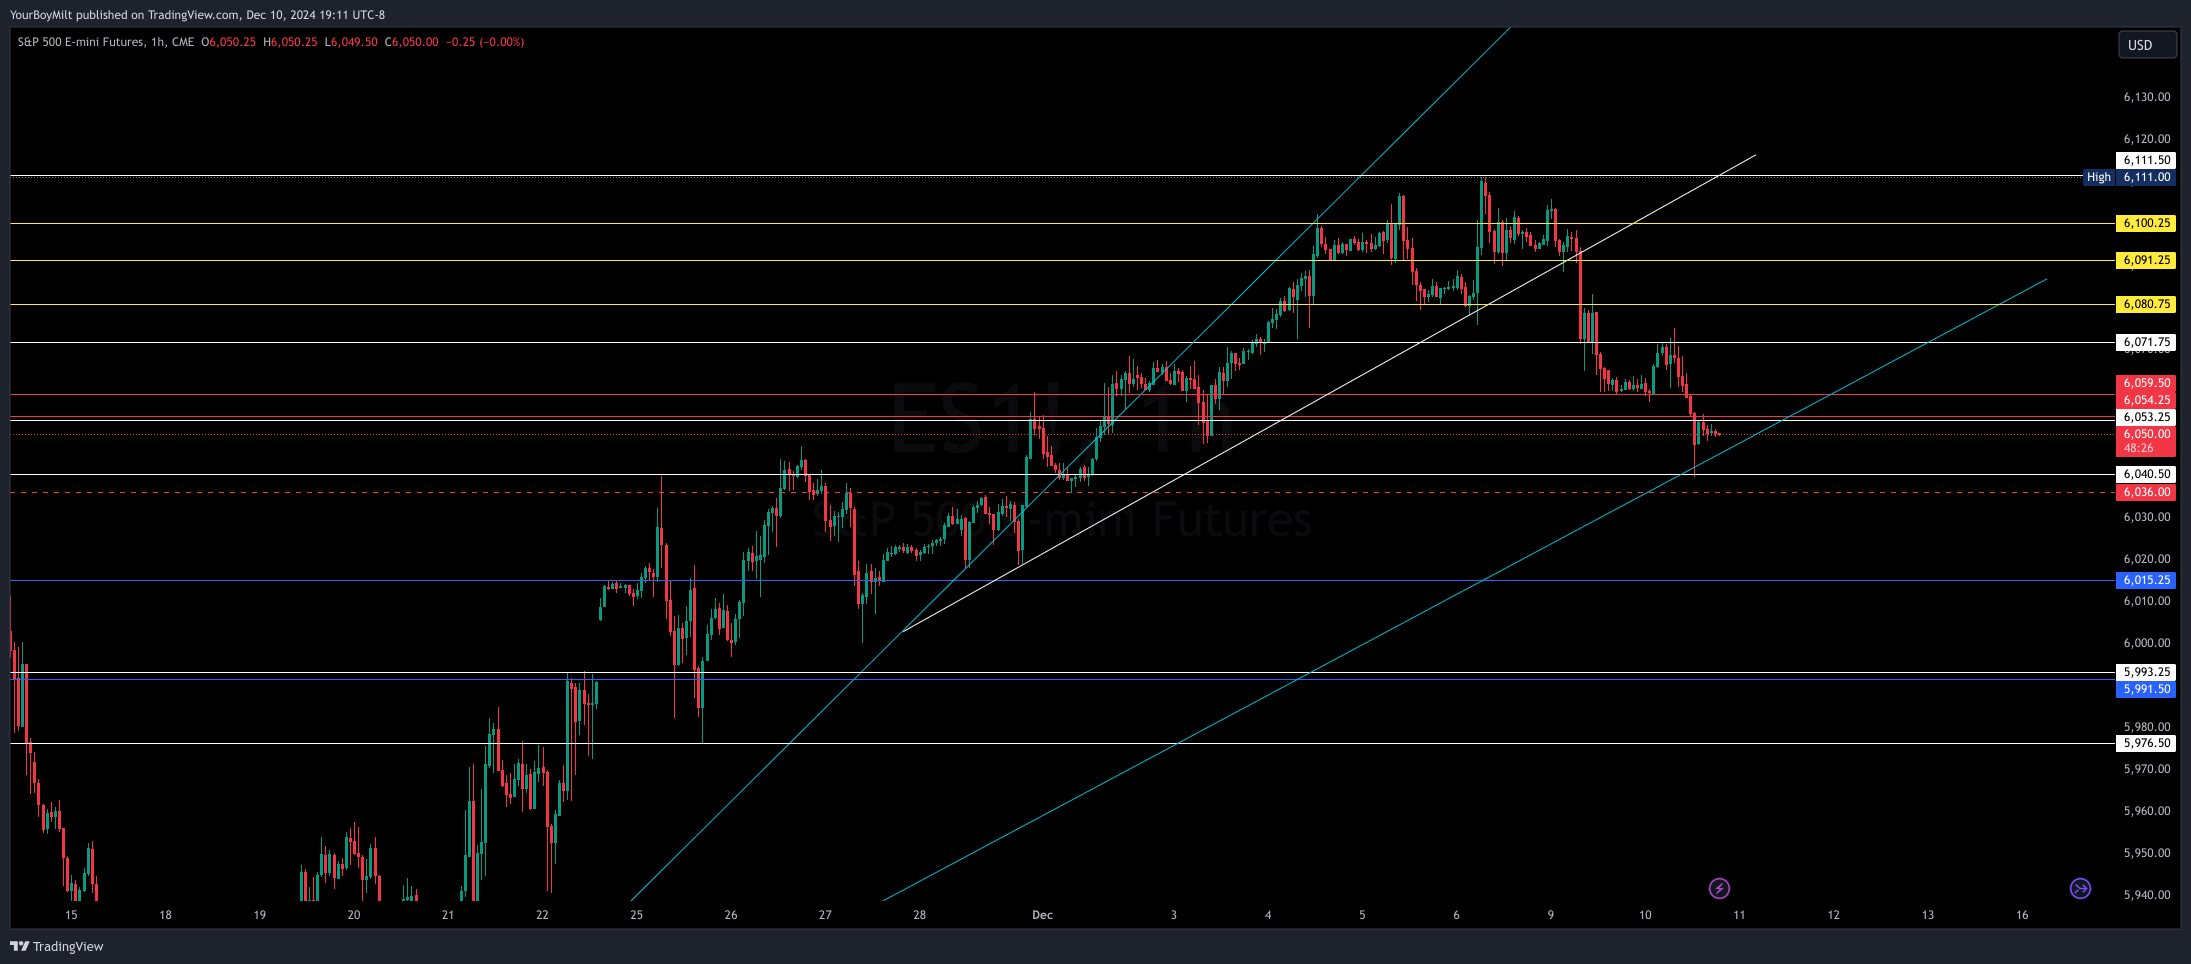
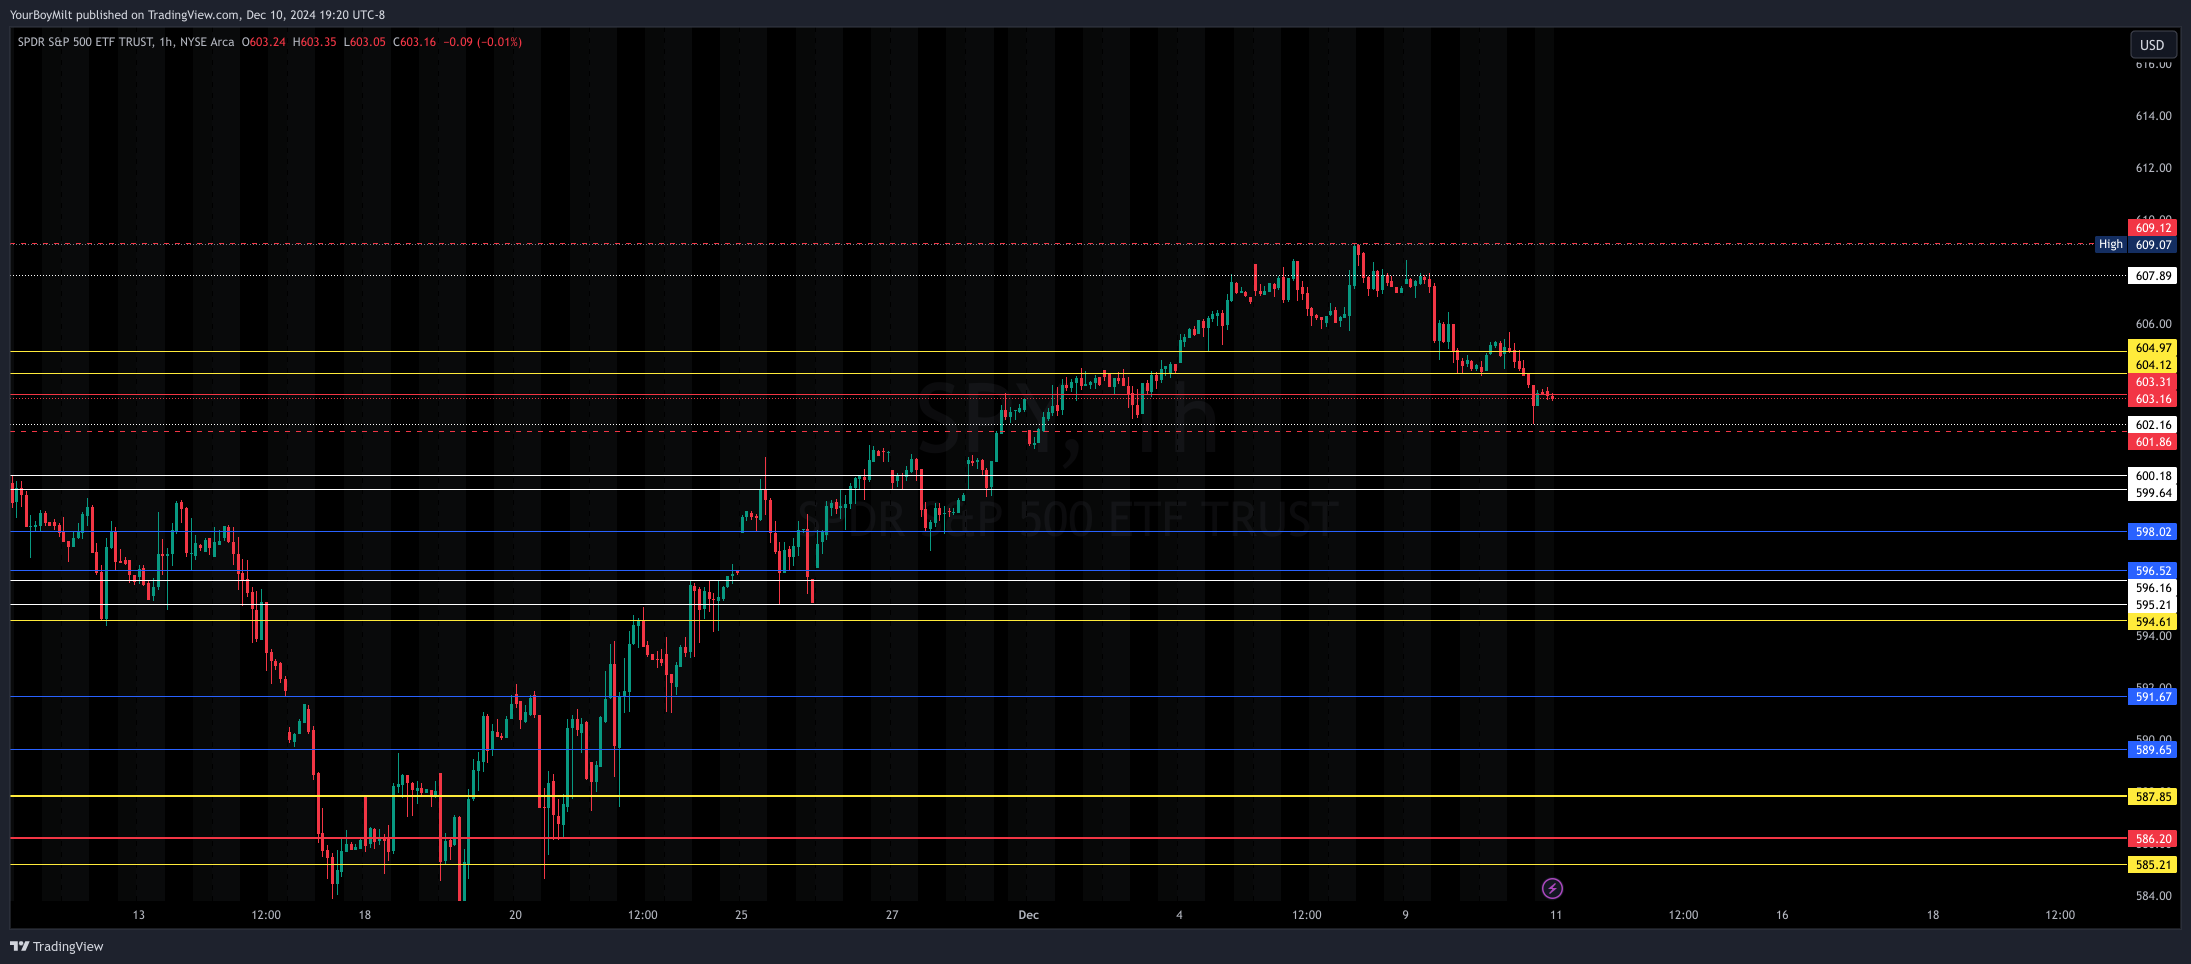
🛥️ES Levels Full Boat: All Levels—Monthly, Weekly, and Homemade
Gaps: Daily and Weekly // Trend Lines: Hourly // Monthly Levels: Red, defined
Weekly Levels: White, defined // Gap Levels: Blue, defined // Reclaims: Gold, subjective // Optional: Key hourly levels (Gold as well)
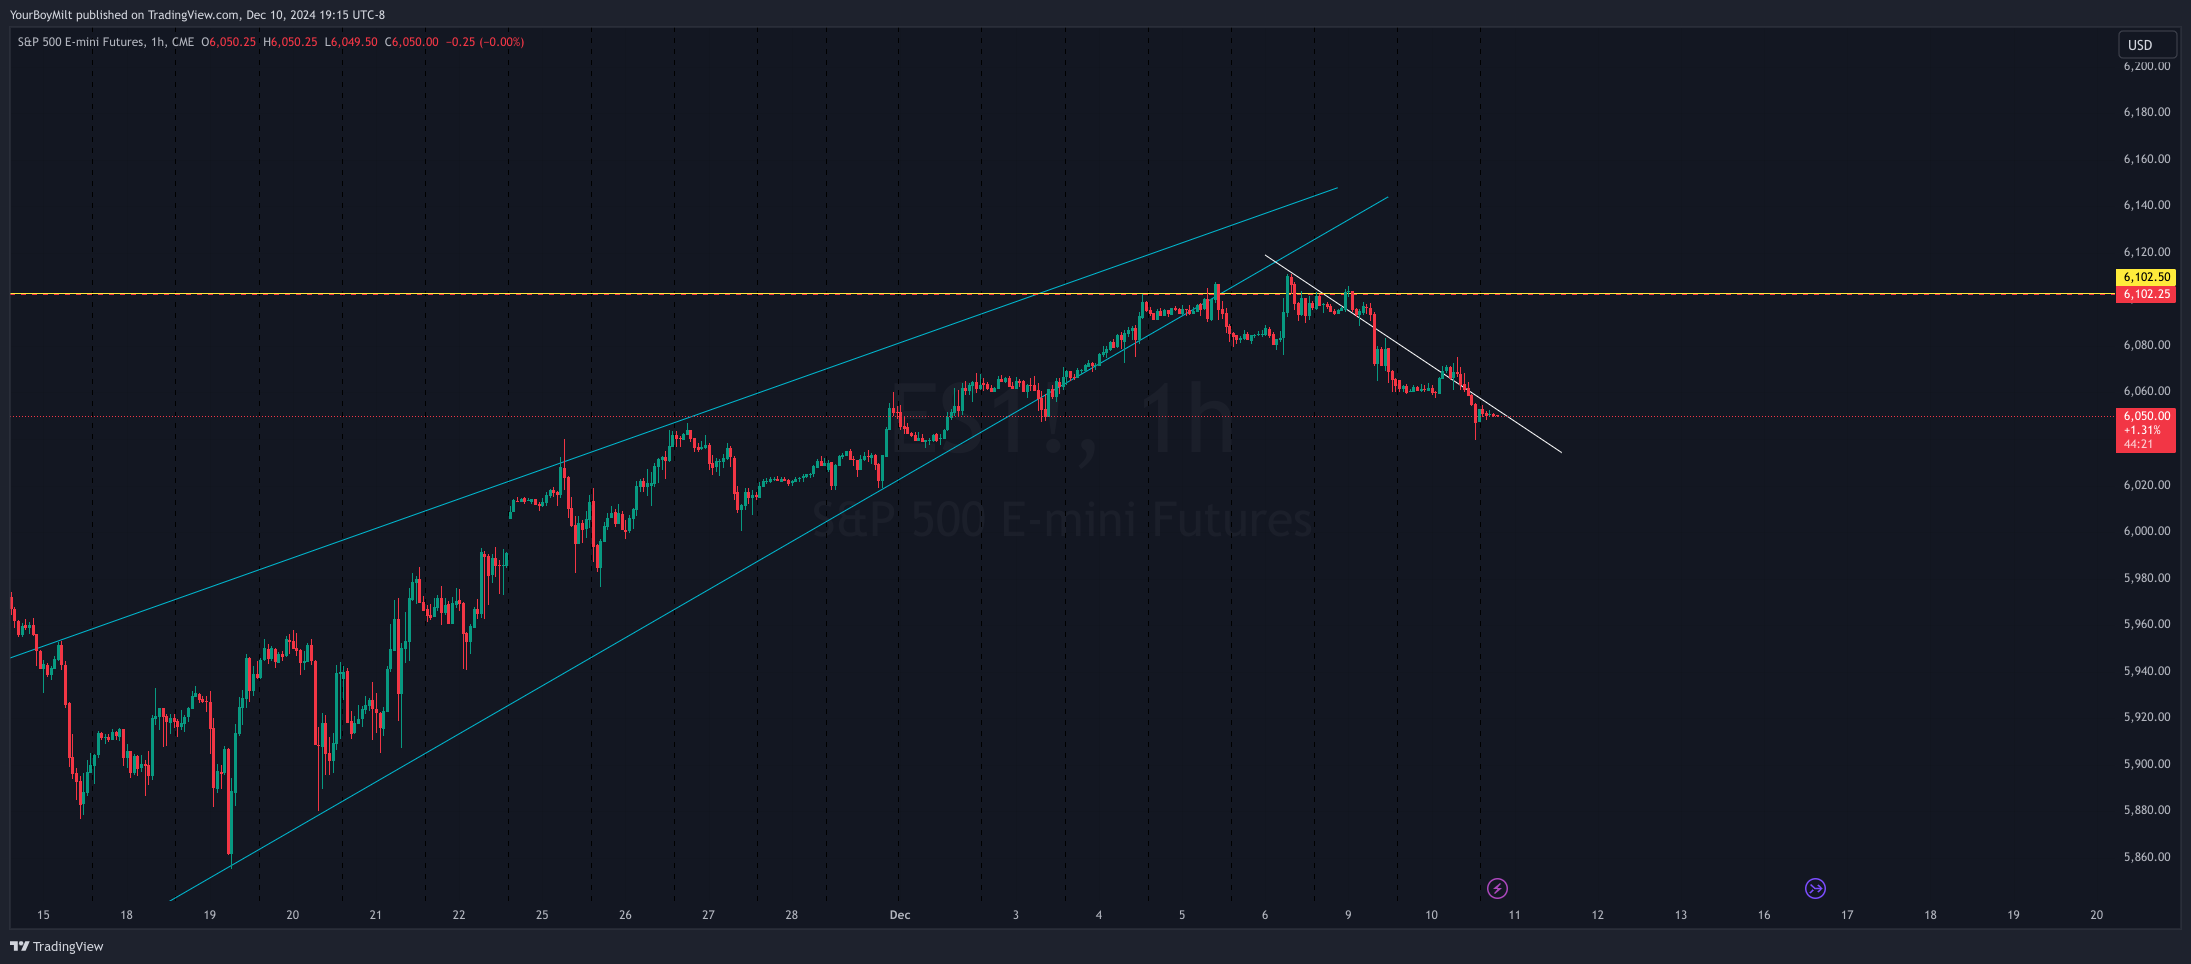
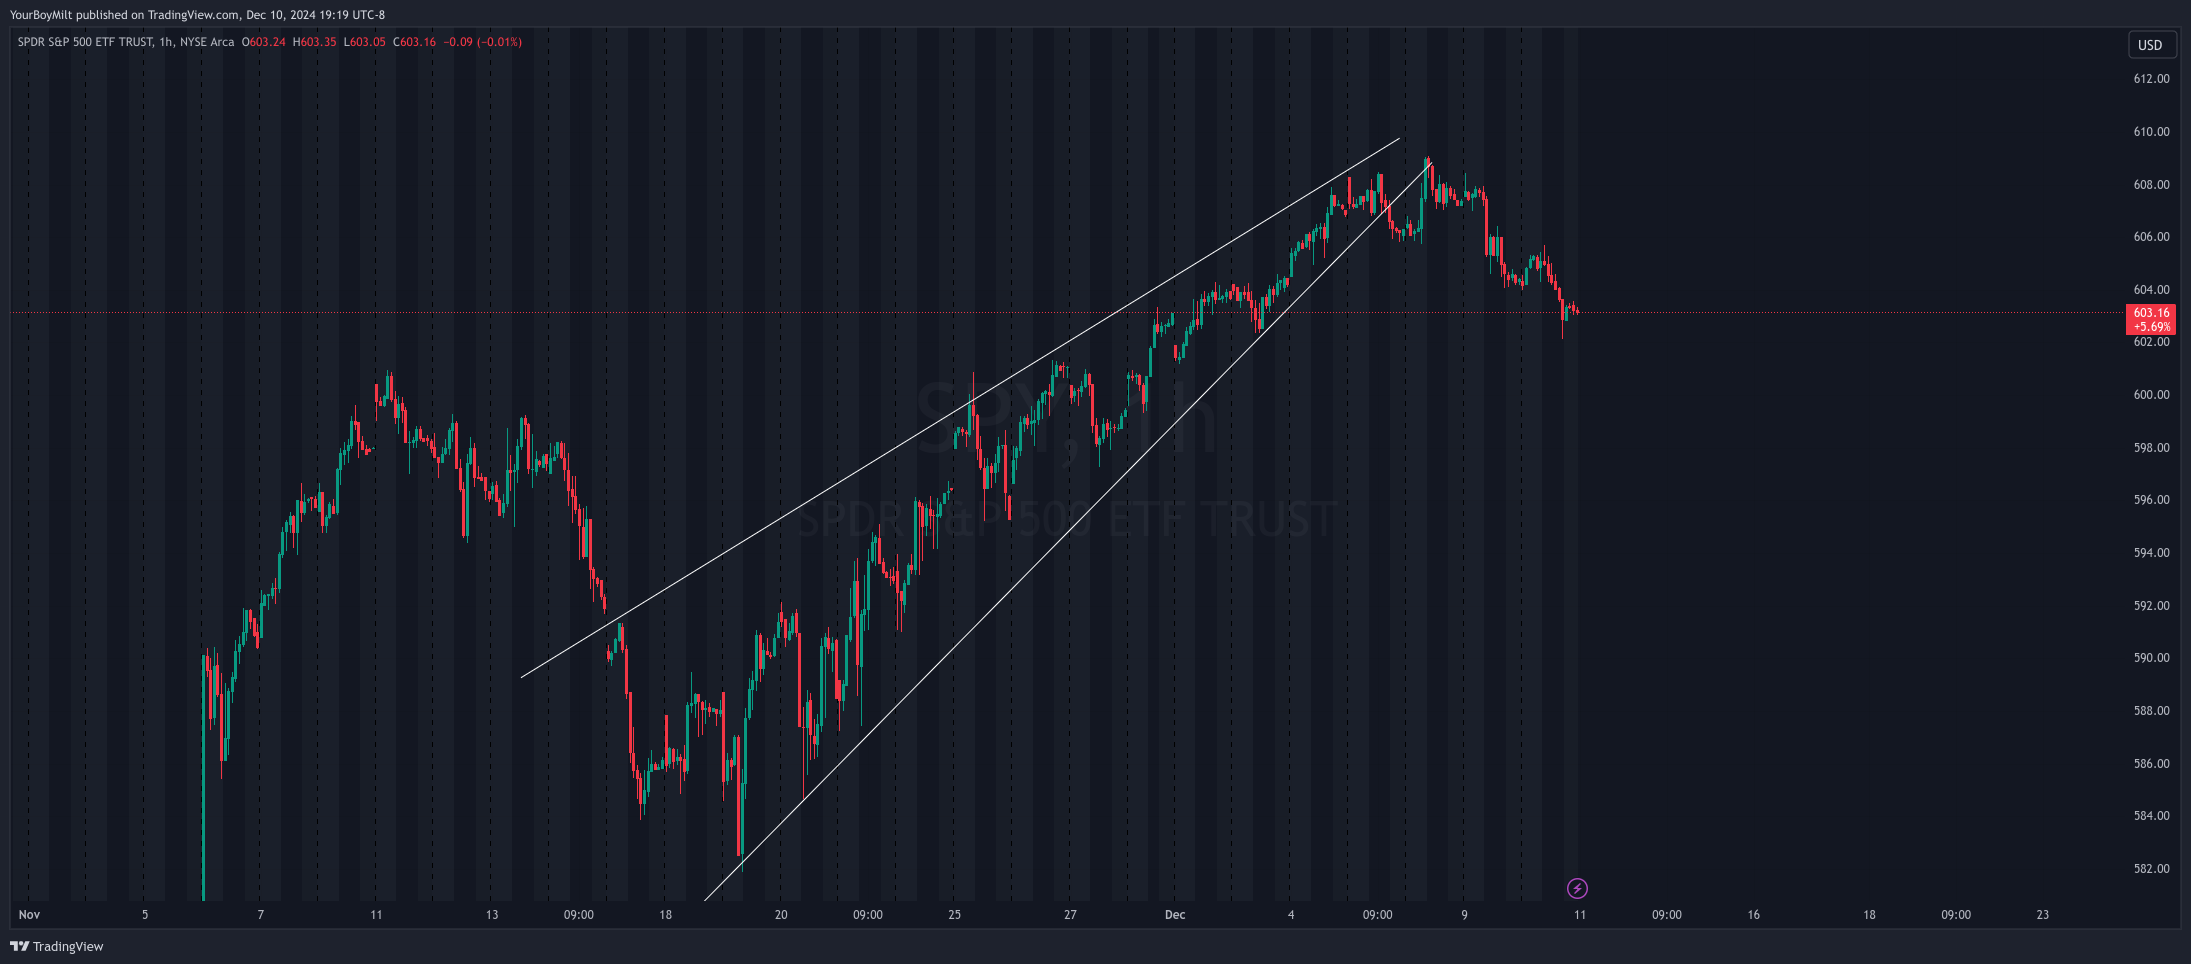
🏡 ES Structure
A clean look at long-term trendiness and channels for context outside the lines. Structure response is just as important as levels, and this reminds us daily. Drawing key reclaim/loss levels is a good idea on this too.
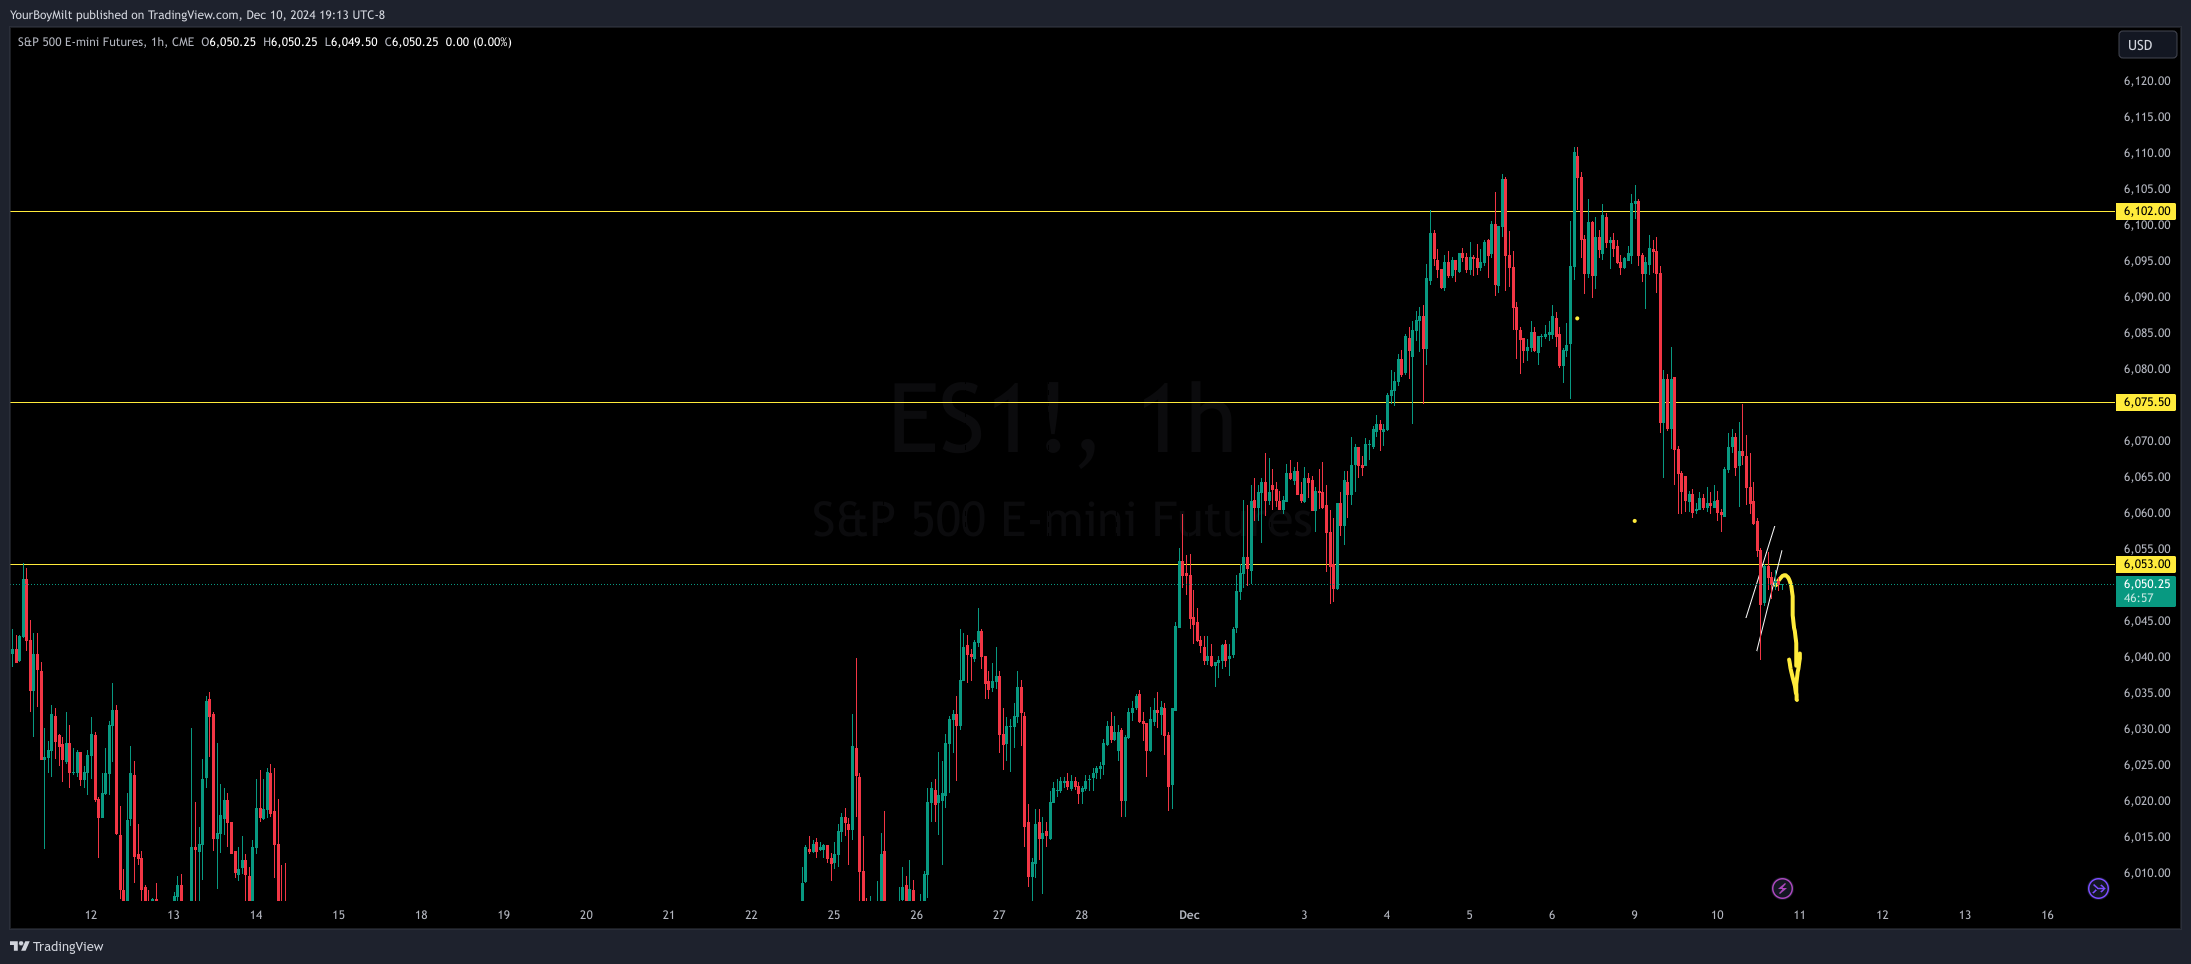
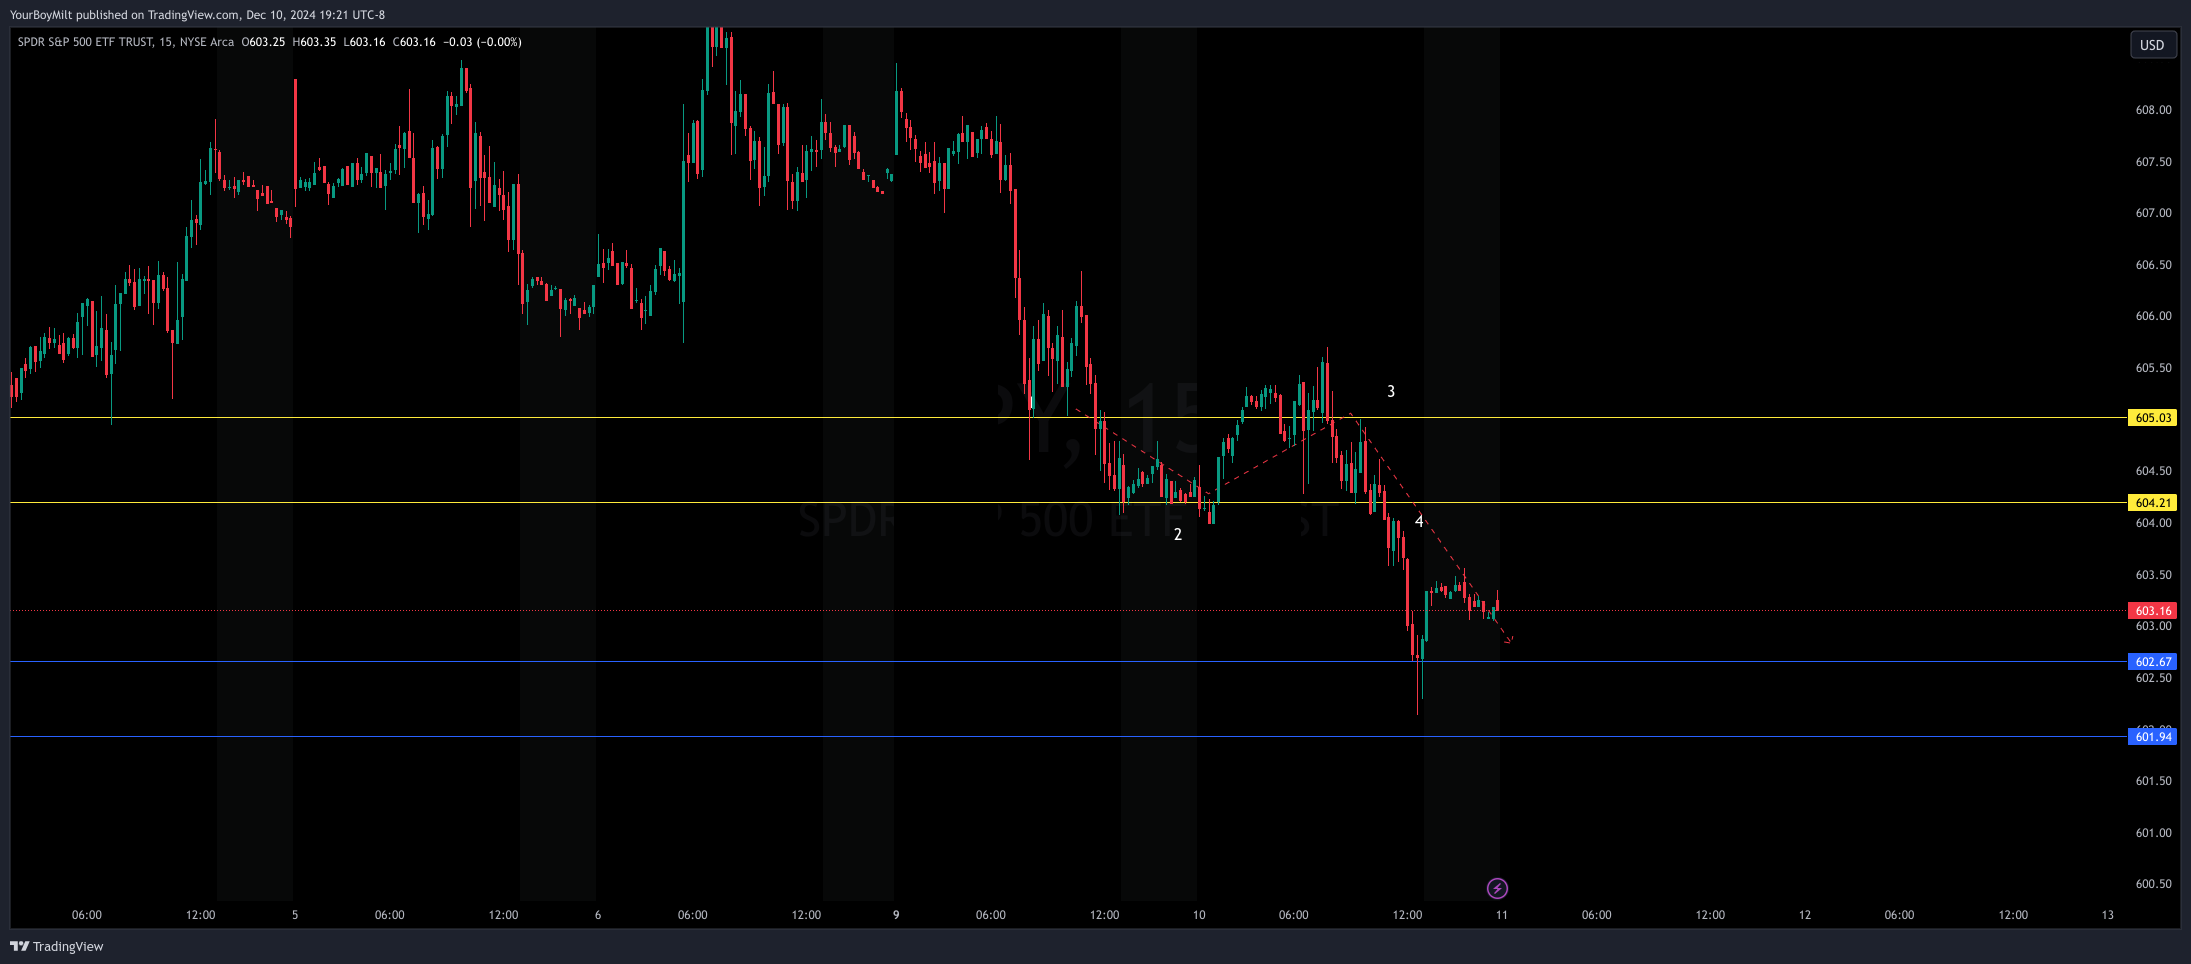
🛝 ES Price Action Sandbox
This is where you will put any patterns you may see developing. Wipe the board each day and just play around with your lateral thinking.
In this example, I don’t see much this morning, but I am interested in this flag/reclaim failure. It decides the day for me, so I have it as a quick reference on the day.
🪞SPY Mirroring: Same Charts Except Sandbox
We now do the same thing for SPY, which will have roughly the same price action.
The important thing to note with SPY, however, is that gap levels come into play based on ES overnight pops and drops—so instead of Sandbox for our third, we will make a “Gap Chart.”
🛶SPY Levels Full Boat : All Levels—Monthly, Weekly, and Homemade
Gaps: Daily and Weekly // Trend Lines: Hourly // Monthly Levels: Red, defined
Weekly Levels: White, defined // Gap Levels: Blue, defined // Reclaims: Gold, subjective // Optional: Key hourly levels (Gold as well)
🪓 SPY Structure:
SPY Gap Sandbox: Focus on gaps and mark daily and hourly gaps different colors
To make this process easy for you, here’s a checklist:
Weekly Index Chart Prep Checklist
ES: The King Index
✅ ES Chart: Full Boat (all levels and gaps, trend line optional)
Current monthly levels updated
Current weekly levels updated
Daily Interval: All gaps marked
Hourly Interval: All gaps marked
Hourly Interval: Any clear levels of repeated wicking marked
Most recent level of monthly support (bullish) or rejection (bearish):
Has the level been retested to confirm the progress to the next level?
✅ ES Chart: Structure (trendlines, channels)
Identify a long hourly trend (more than 5 days) that has held.
Identify a shorter trend that has been lost recently.
Are we in a channel?
Recently out of one?
Are we in a wedge?
Recently out of one?
✅ ES Chart: Sandbox (daily pattern spotting, key/reclaim levels)
What level has ES failed to hold above or go below on the hourly (signified with multiple wicks).
Scan this area for:
Bull or bear flags?
Cup and handle?
Head and shoulders/inverse head and shoulders?
✅ ES Chart: Full Boat (all levels and gaps, trend line optional)
Current monthly levels updated
Current weekly levels updated
Daily Interval: All gaps marked
Hourly Interval: All gaps marked
Hourly Interval: Any clear levels of repeated wicking marked
Most recent level of monthly support (bullish) or rejection (bearish):
Has the level been retested to confirm the progress to the next level?
✅SPY Chart: Structure (trendlines, channels)
Identify a long hourly trend (more than 5 days) that has held
Identify a shorter trend that has been lost recently
Are we in a channel?
Recently out of one?
Are we in a wedge?
Recently out of one?
✅SPY Chart: Gap Sandbox
Identify all daily gaps
Identify all hourly gaps
Identify any notable patterns
Bull Flag?
Bear Flag?
Head and shoulders?
Inverse head and shoulders?
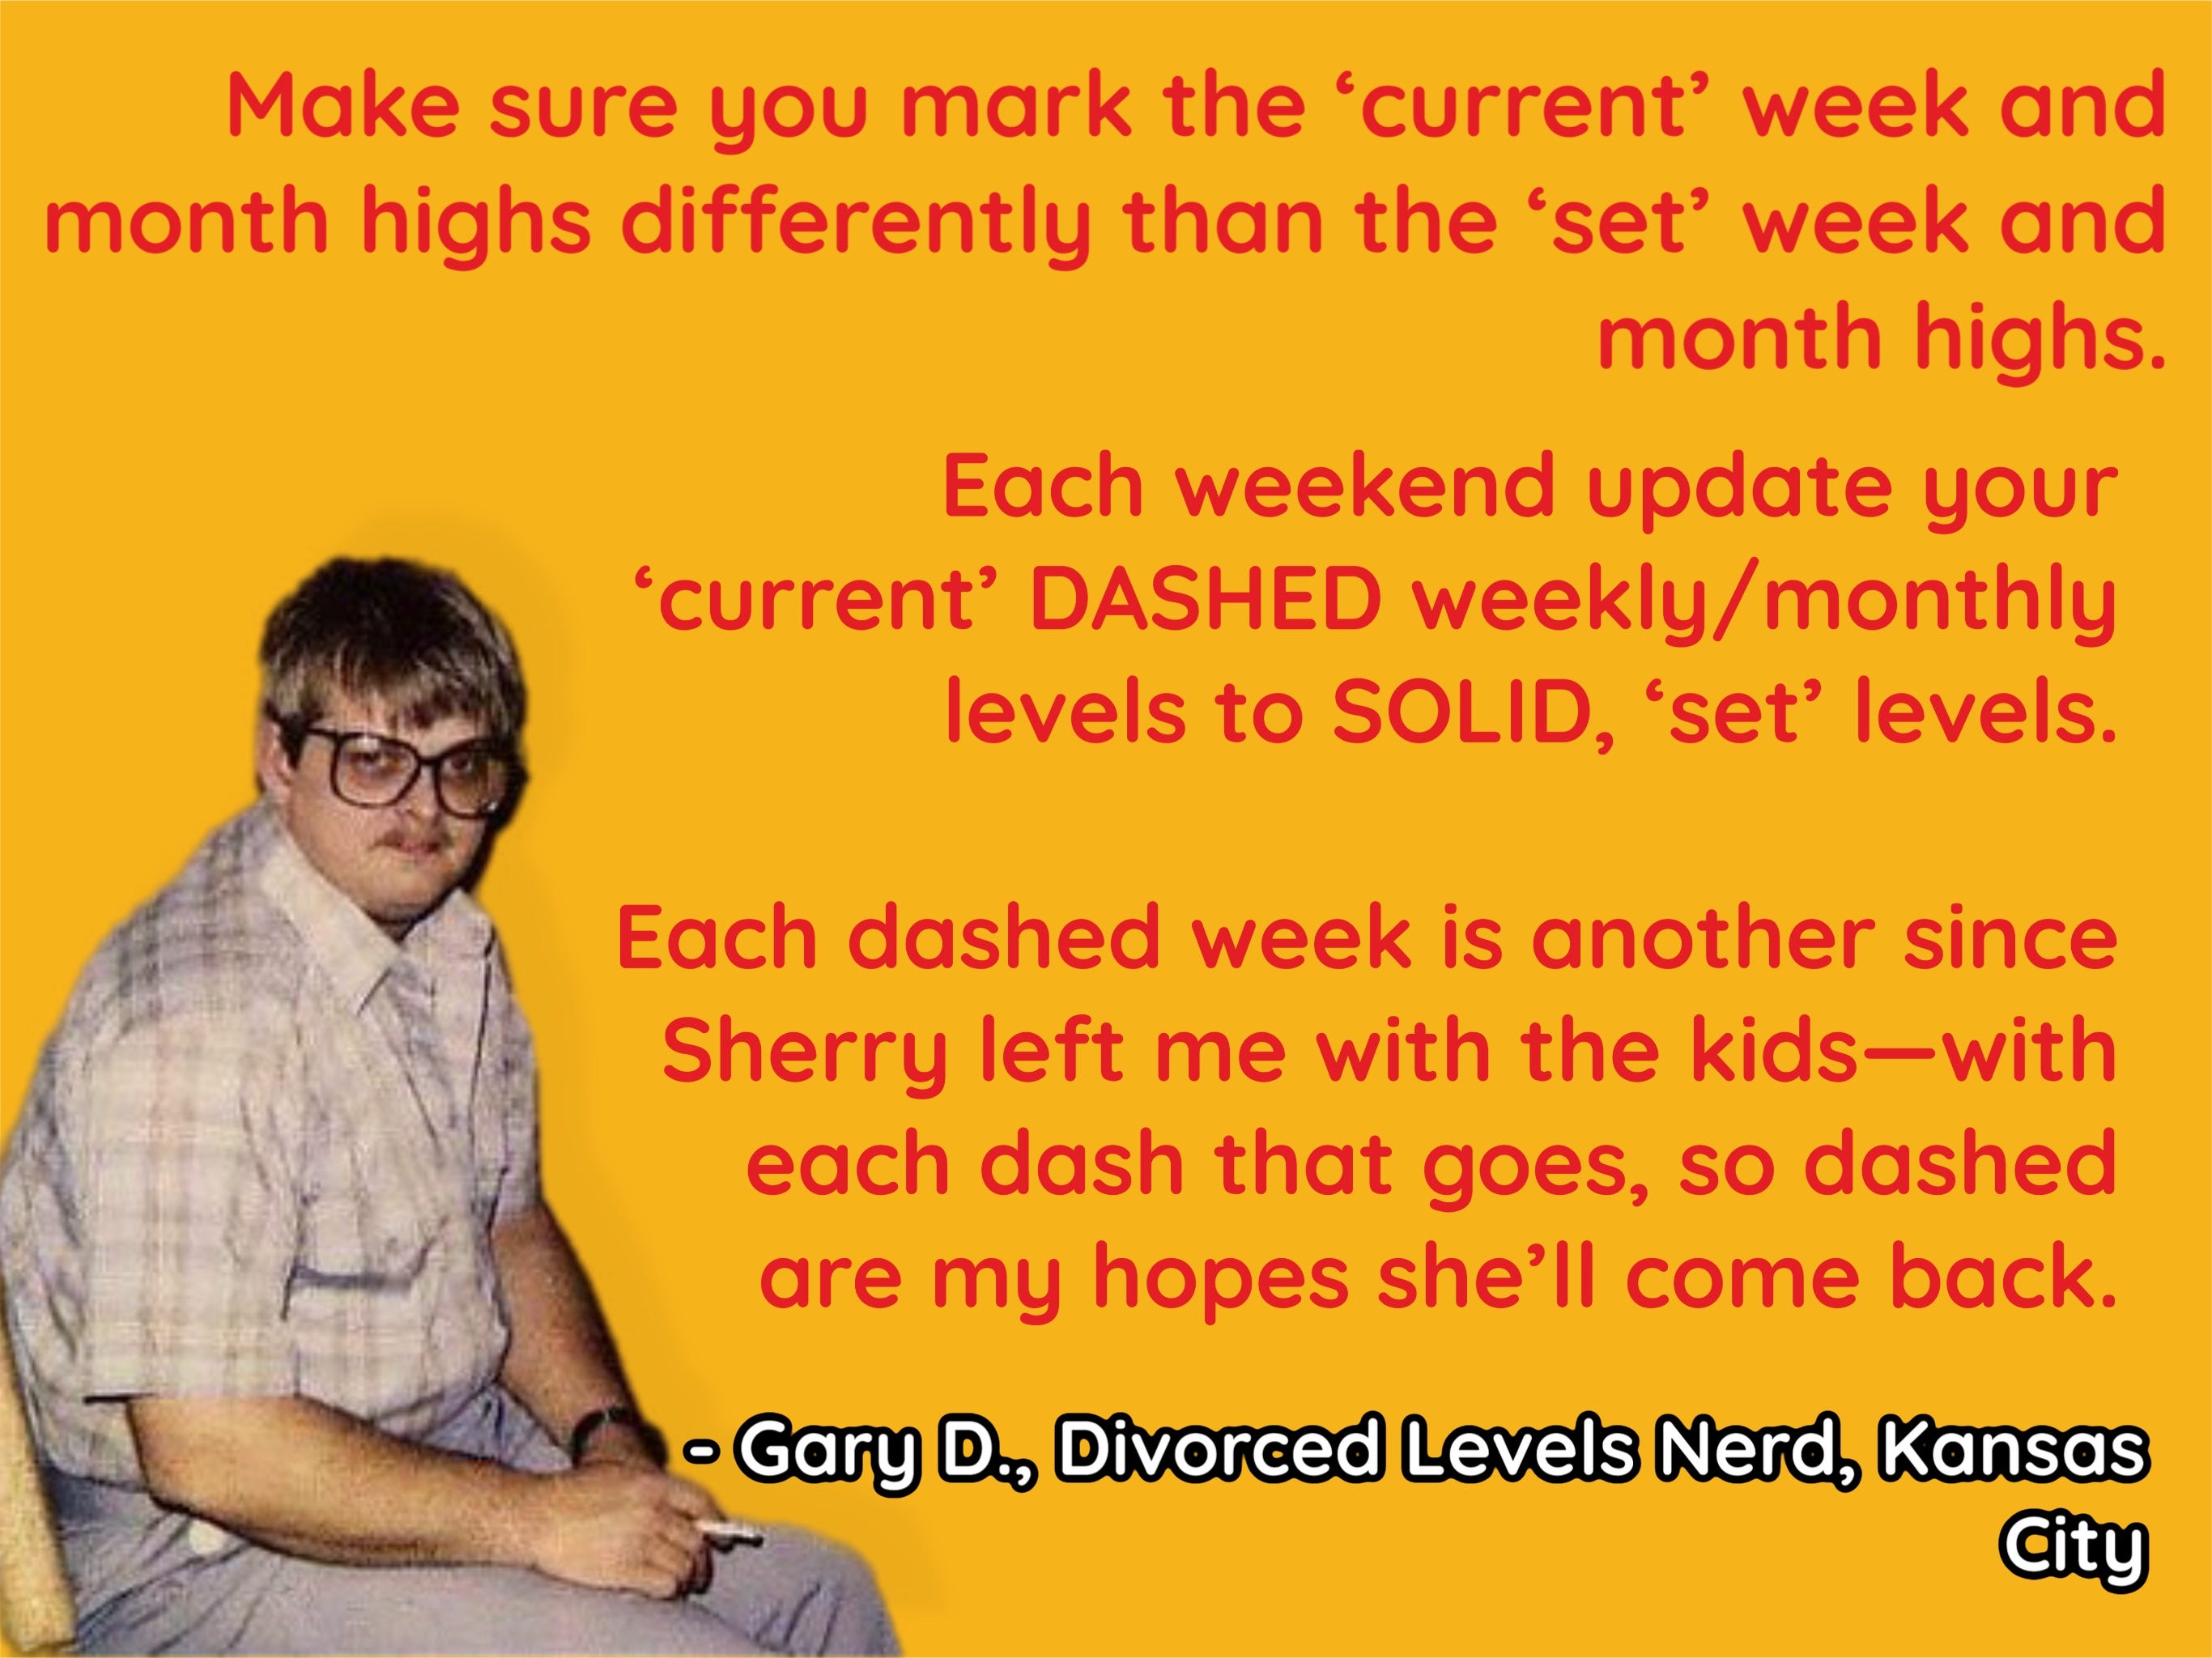
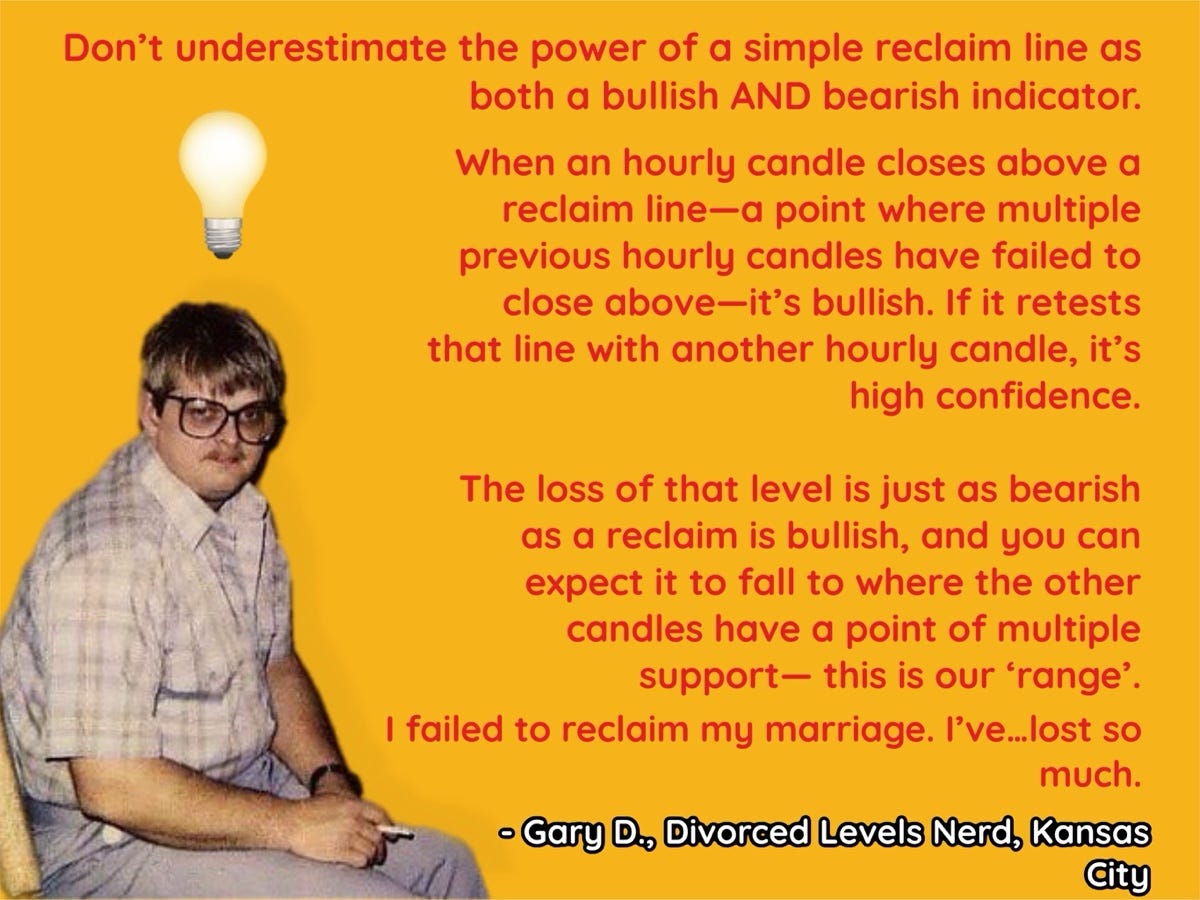
💡 Pro Tip: Gary D. and the dual Bullish/Bearish nature of reclaims
🔎 Flow Prep for the Week
Please note: YEET has many free tools lying around for the creation of filters. YEET Plus members receive access to our two flagship filters, The People’s Screener (Flow Feed) and Becky Sauce Ultra (alerts).
🤓Any base filter will do from the Unusual Whales Flow Feed menu as you find your footing. For this tutorial, let’s use Hottest Contacts with some incredibly simple adjustments (this is about prep not finding great flow).
❌ We’ve hidden: ETFs / ETNs, Indices
🧐 We’ve Filtered for: Volume > OI, Exclude ITM
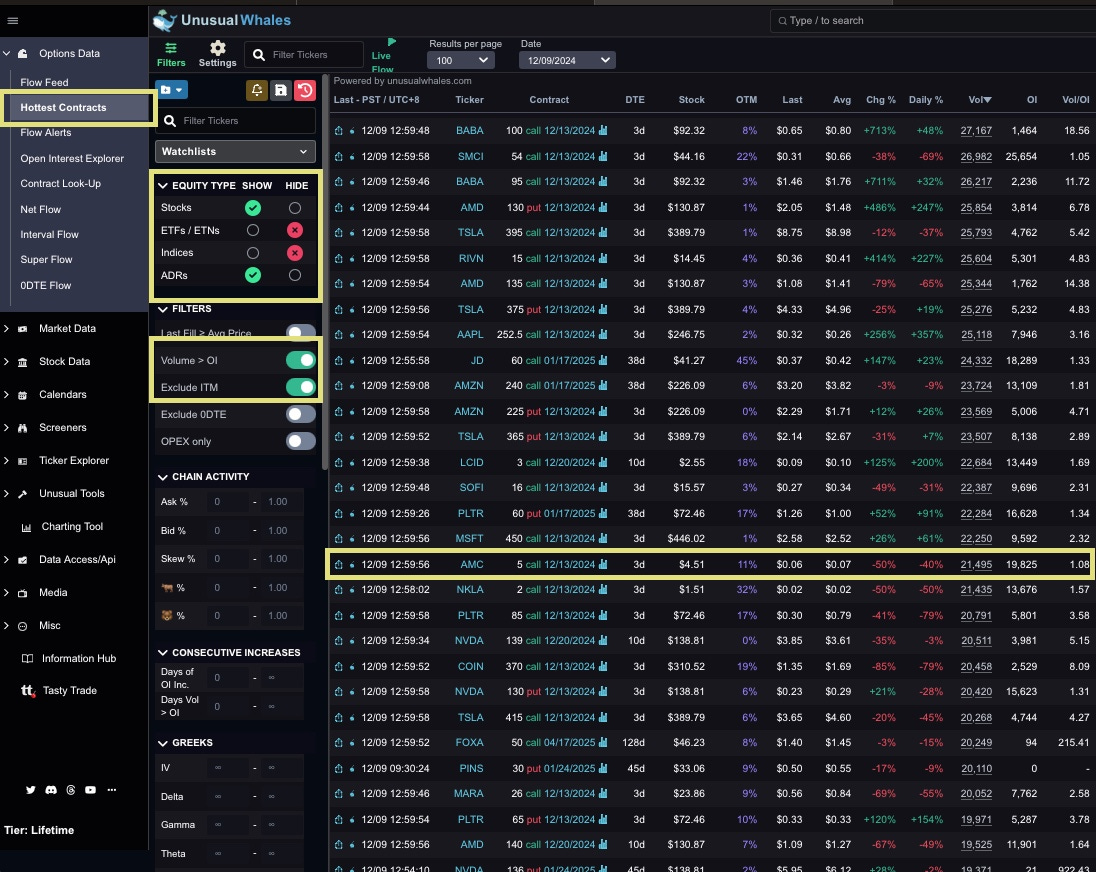
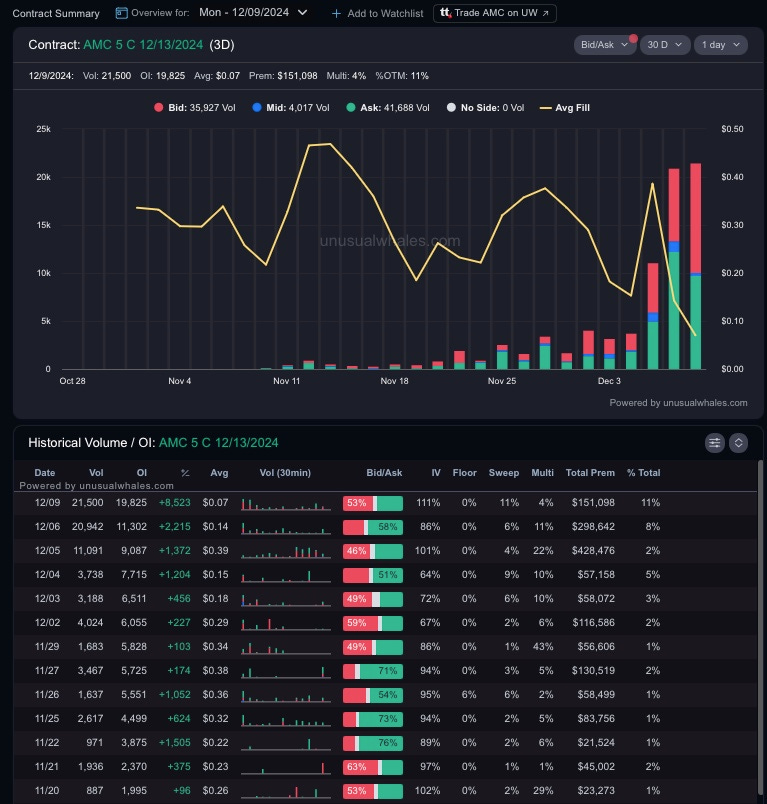
🐳 CONTRACT OF INTEREST: We’ve found: a degenerate whale on AMC 12/13 5c (highlighted)
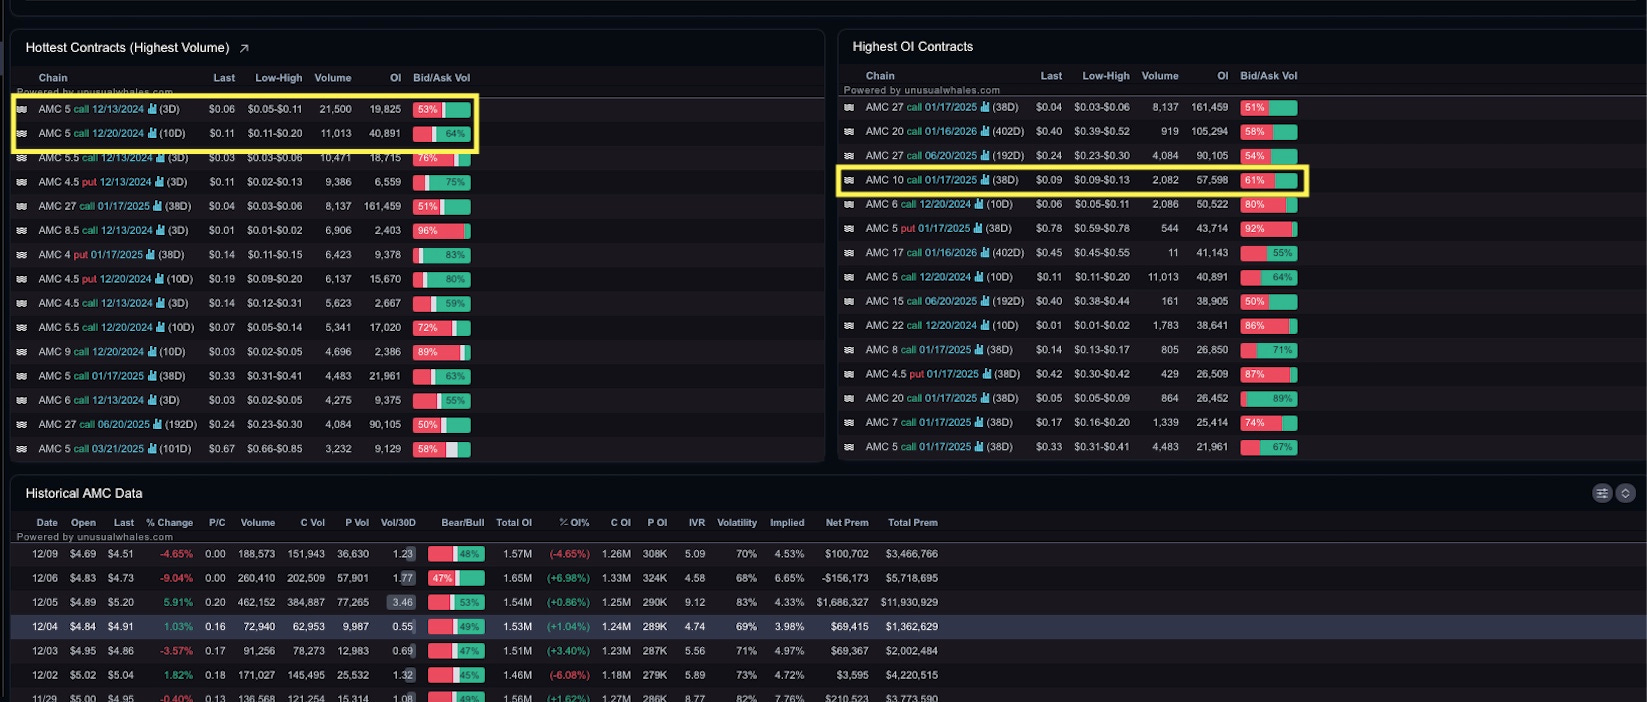
🕵 Intraday Analyst Page: Where you find your supporting contracts: Ive noted some here that were worth looking into.
💡If you’re in a swing, copy the links the a notes doc or save them in your whale watchlist so you can easily monitor your trade
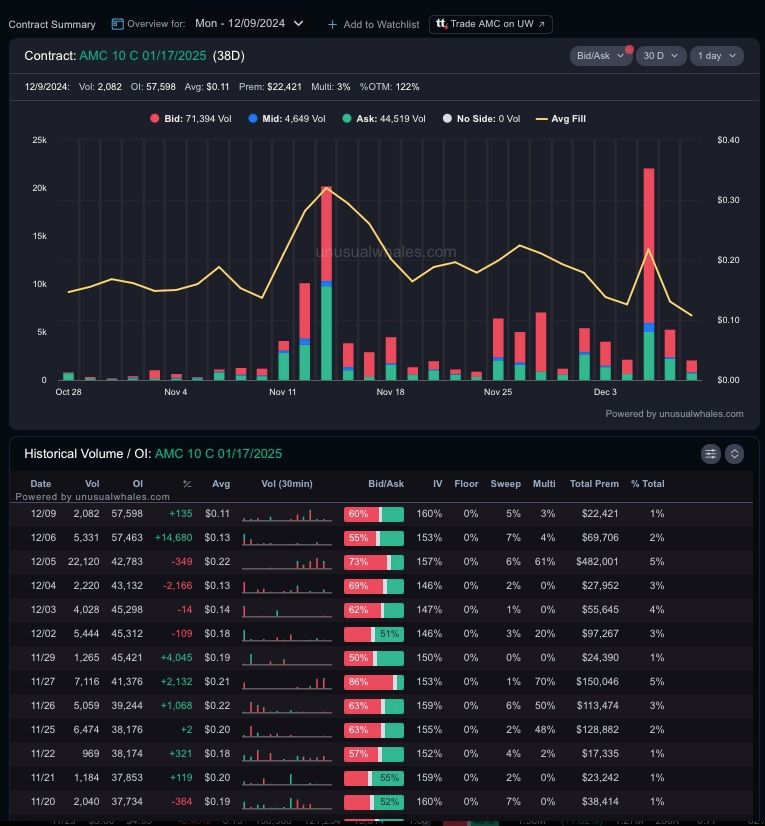
🐳 Supporting Flow: AMC 10c 1/17/2025
📈Your Chart: Full Boat all levels applied to the ticker OR
💡If too much clutter is going to make doing monthlies and weeklies a pain, save time by doing just monthlies, or save MORE time by focusing only on the reclaims
For a Simple Reclaim checker with easy access, I just use the Unusual Whales Chart Tool:
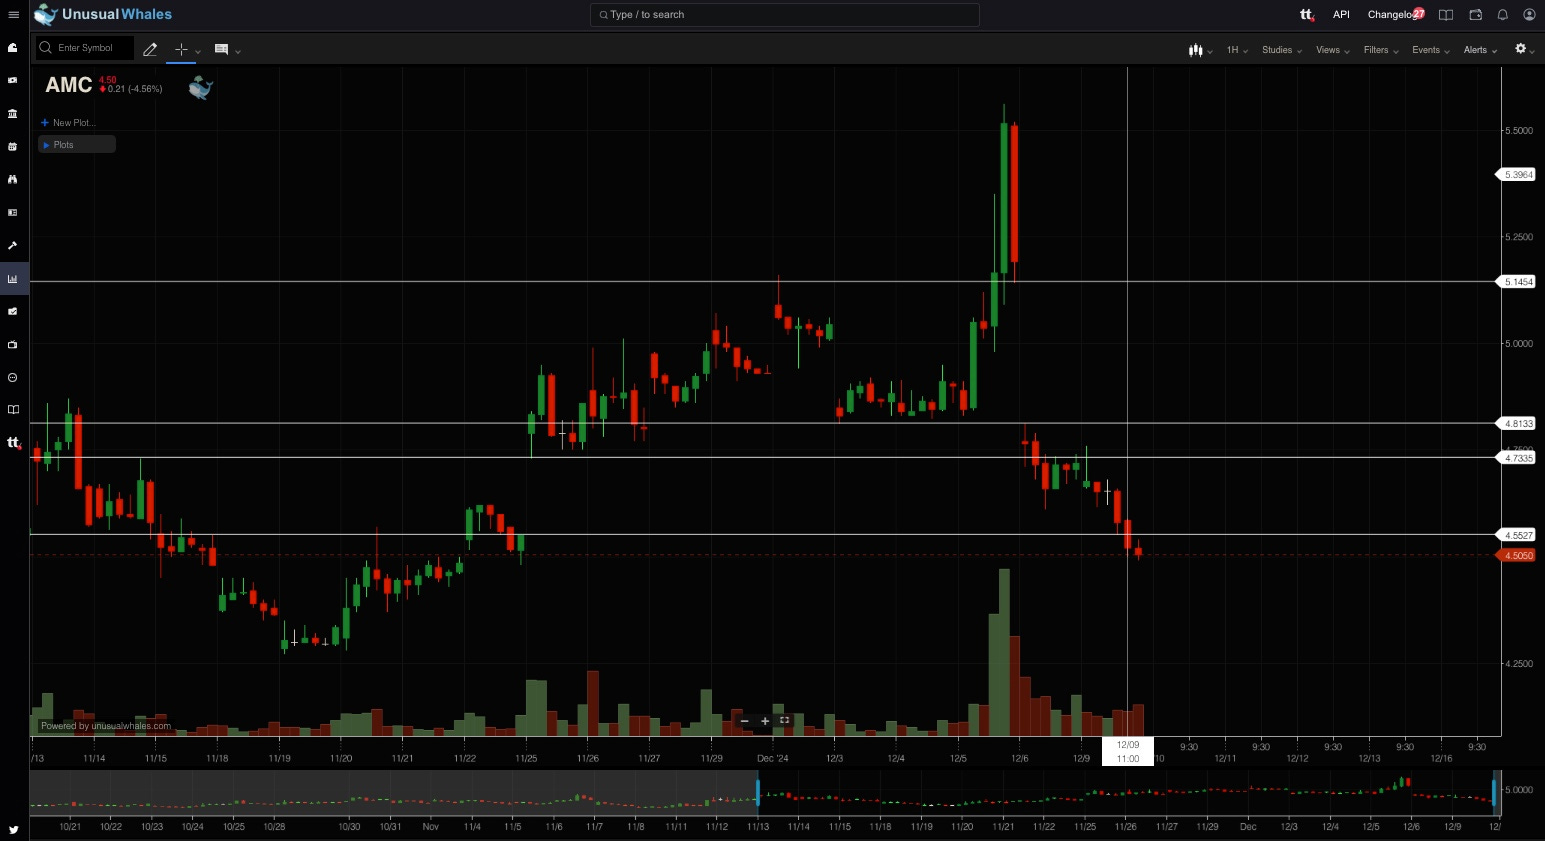
🐂The hourly chart reveals a very simple setup we can follow based on gaps:
Above 4.55 gives us a target of 4.73
Above 4.81 brings us a target of 5.14
Once you have your these factors your flow trades are prepped. Let’s go ahead and make a checklist:
🌊Flow Trade Prep Checklist
Do you have:
A Contract of Interest.
One or more supporting flows.
A Chart and Trade Plan Including:
A Chart with at least monthly levels marked.
A chart with an entry/reclaim/loss level.
Do you have your targets set?
Have you created alerts so you know when to enter?
Any final thoughts from the guests? Ezekiel? Gary?