
✅✅✅The Macro Mid-Day Show: Guest Miami Don, PARI Explained (how we caught today's 12 point drop to within 45 cents!), BAT Filter Finds, Gadzooks!
The Game is Afoot with new creations from YEET Labs and a visit from our friends at

🚨EVERYONE: Today we caught the 12 points SPY drop on 590p with PARI in The YEET Discord and Twitter—I’m giving you today’s read! Starting tomorrow that’s exclusively for Plus Daily
🚨PLUS: you have a quick what to watch at the end, and I’ll provide more in the Discord.
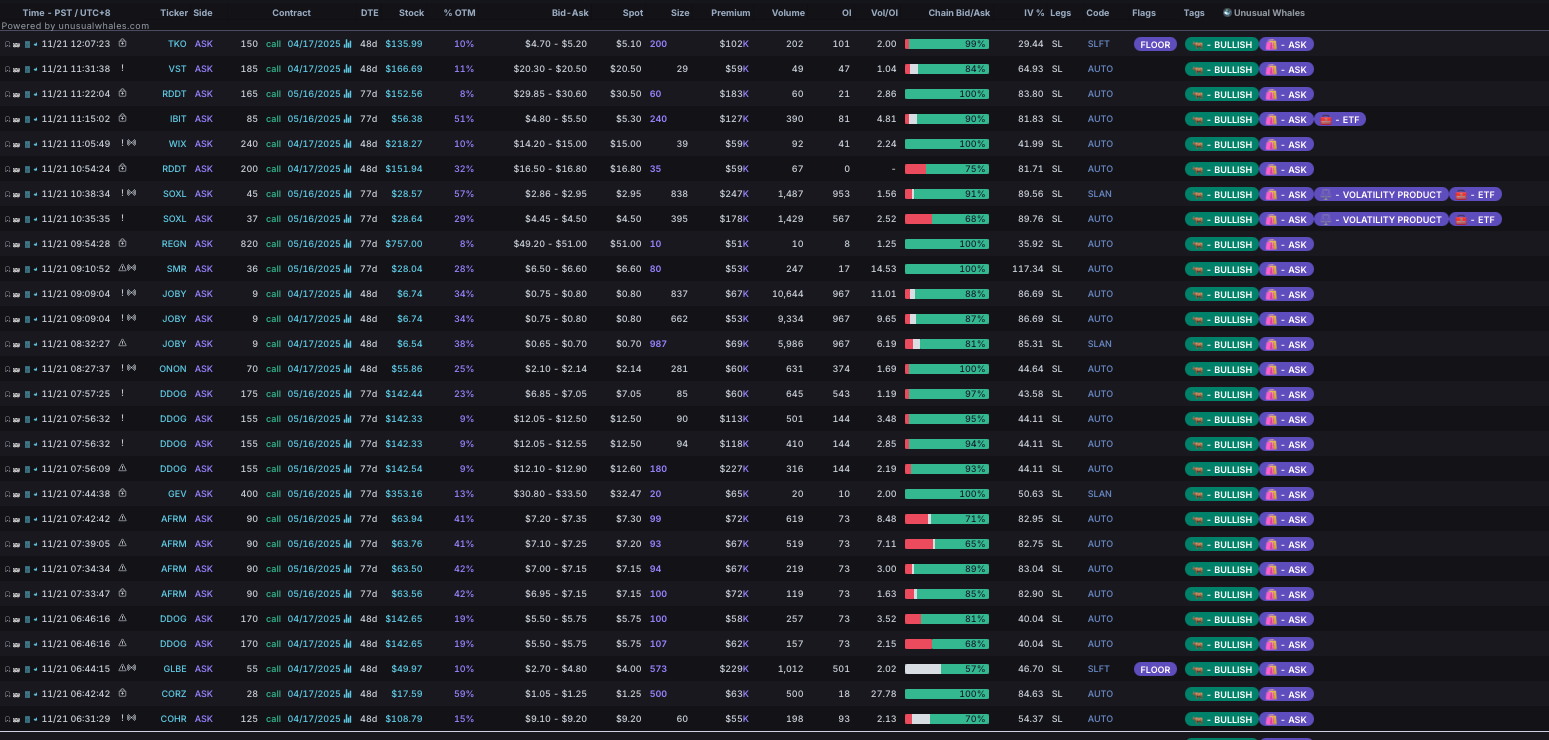
If you’re here because you heard about YEET catching the META news with the BAT Filter, here’s what we saw on the filter:


🎙️ The Mid-Day Show: Investigative Report – Where’s the Magic, Jensen?
Correspondent Report from Miami Don
Good Day, viewers. Tonight, we bring you an investigative look at one of the key narratives shaping the market in Where’s the Magic, Jensen? : A deep dive into Nvidia’s post-earnings stagnation and the broader implications for the AI-fueled rally that has driven market sentiment in the first half of 2024.
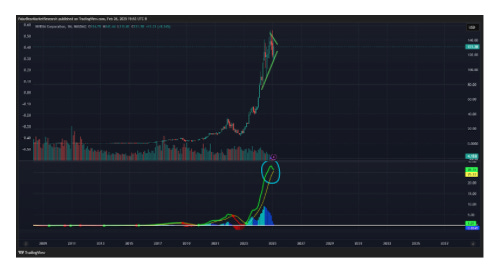
The semiconductor darling, Nvidia, once the face of an unrelenting tech boom, now finds itself under scrutiny. Earnings came and went, and despite record revenue, the stock barely moved. Investors are asking: Is this a sign of exhaustion? The AI and semiconductor trade has fueled a historic run-up, but cracks are beginning to show. Key technicals and sentiment indicators suggest that the enthusiasm surrounding AI may be fading. If Nvidia can’t reignite the magic, where does that leave the broader market?
🎙️ Don Miami – What’s the Macro Saying?
📰 "Good evening, MacroEdge Readers & Community! If you’re tuning in from YEET, happy to be here with Milt and the team. I’ve been tracking a few key themes lately—valuation pressures, technical divergences, and a market that’s on the edge of something bigger."
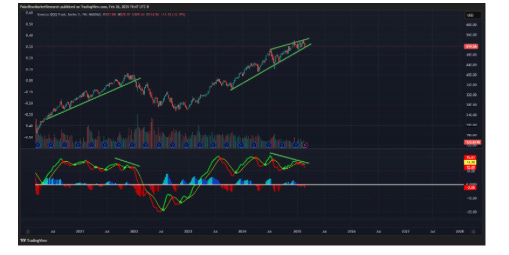
📉 "First off, let’s talk about this broader structure. We’re seeing major indices chop, but underneath? Momentum is rolling over. The AI trade? Struggling. Earnings pops? Not holding. The Nasdaq? Still stuck at key resistance."
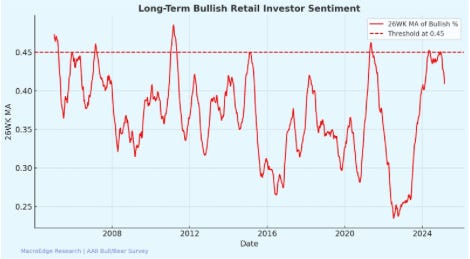
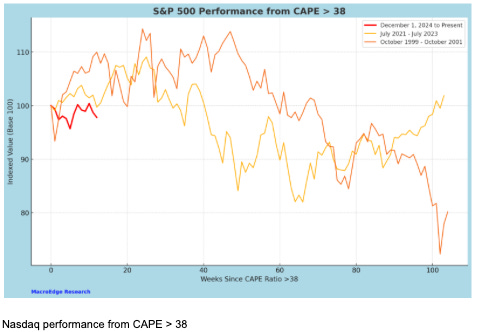
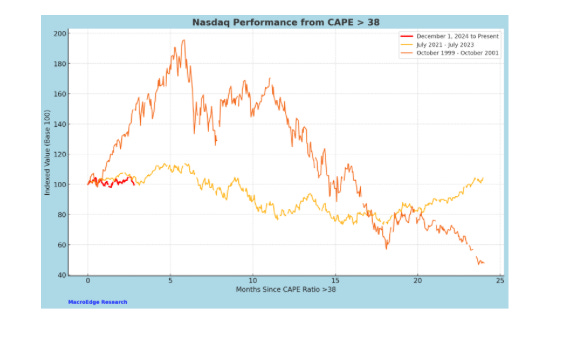
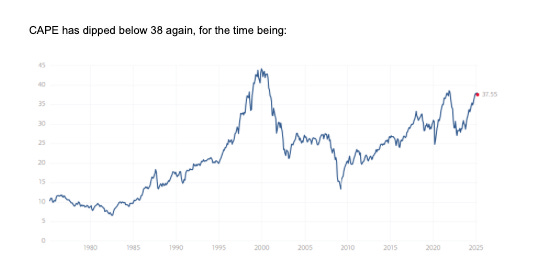
📊 "Internals and sentiment? Not great. Valuation pressures are still a real thing—CAPE > 38 is historically a death zone for forward returns. And the longer we stay in this grinding range, the more likely we are to get a decisive move… but right now? It's not clear that move is up."
🔍 "One thing I’ve been tracking closely is liquidity conditions. The Fed may not be actively tightening at the moment, but risk appetite has clearly started shifting. Hedge funds and big institutions are more defensive, and that’s playing out in key sectors."
📉 "Just look at the rotations—we had major inflows into defensives while previous market leaders are looking exhausted. This isn't a complete risk-off, but it's certainly a different tone from what we saw just a few months ago. The flows tell the real story."
📈 "And it’s not just about price levels. Breadth is weak. Look at equal-weighted indices versus market-cap weighted. Small caps have been underperforming, and that’s usually an early warning sign. The broader market isn’t in freefall yet, but the underlying foundation is weaker than it appears."
🔮 "So, Milton, where does that leave us? The next real bounce has to prove itself, or it’s just another lower high. And if liquidity keeps drying up, the downside risks keep growing. We’ll need to see a big shift in sentiment or an actual fundamental catalyst to turn this around."
📡 Doomsday Warning? INTRODUCING PARI
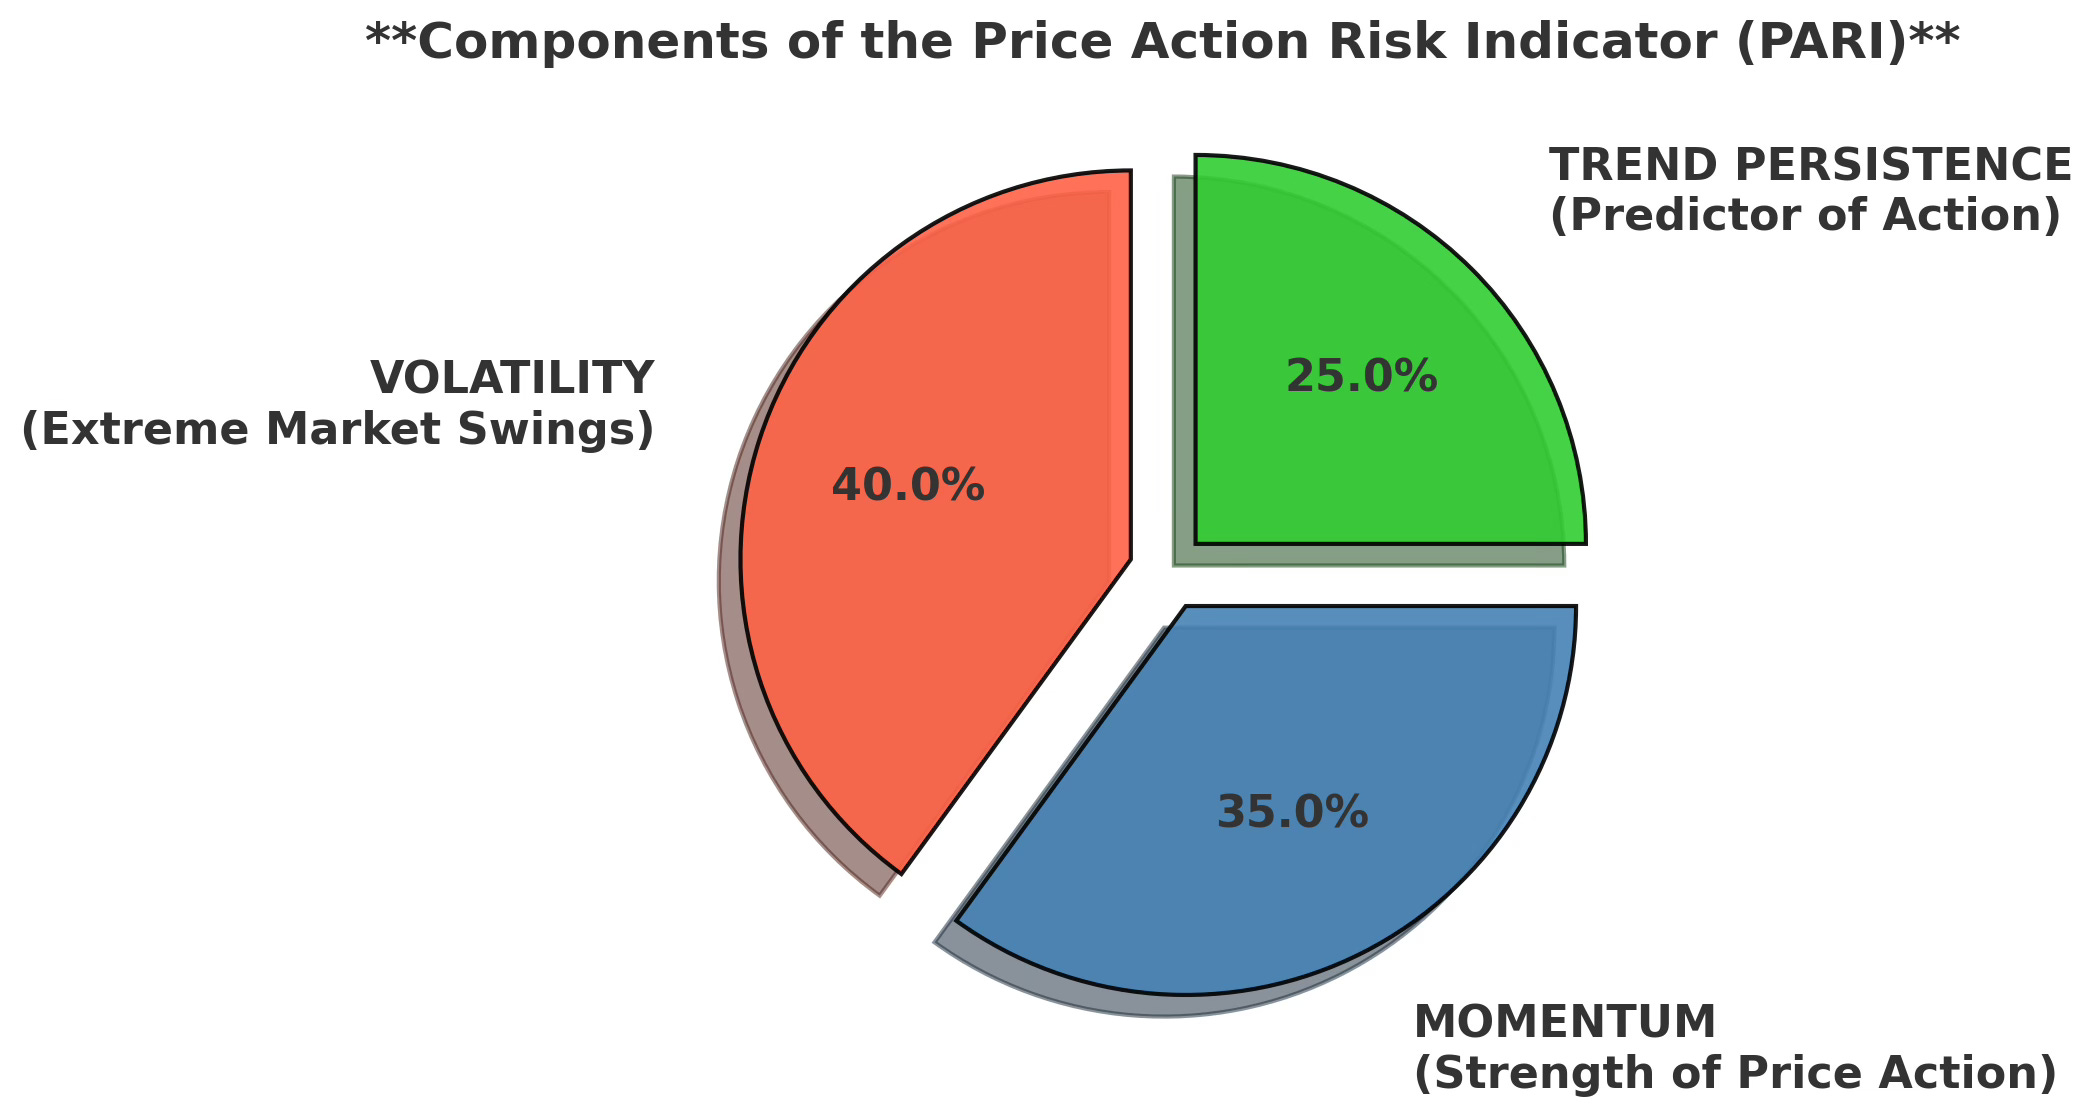
🎯 What is PARI (Predictive Action Risk Indicator)?
PARI is a proprietary risk assessment metric designed to detect market sentiment shifts before they happen. It evaluates conditions based on:
📉 Volatility: How extreme the market swings are.
📈 Momentum: Whether price action is strengthening or fading.
🔄 Trend Persistence: If trends are holding firm or breaking down.
Why Does PARI Matter?
✅ Above 50: Momentum and conviction are strong—bullish sentiment.
🚨 Below 50: Uncertainty and weakness—risk of reversal or breakdown.
⚠️ Near 20 or 80: A major move is coming—whether it's a collapse or explosion depends on the trend.

🚀 In short, PARI is the market’s "mood detector." It tells us whether bulls or bears are in control—and right now, it's screaming danger.
🔥 Today's Predictive Action Risk Indicator (PARI):
📅 Date: February 27, 2025
📊 PARI Value: 37.08 🔻 (Bearish Bias)
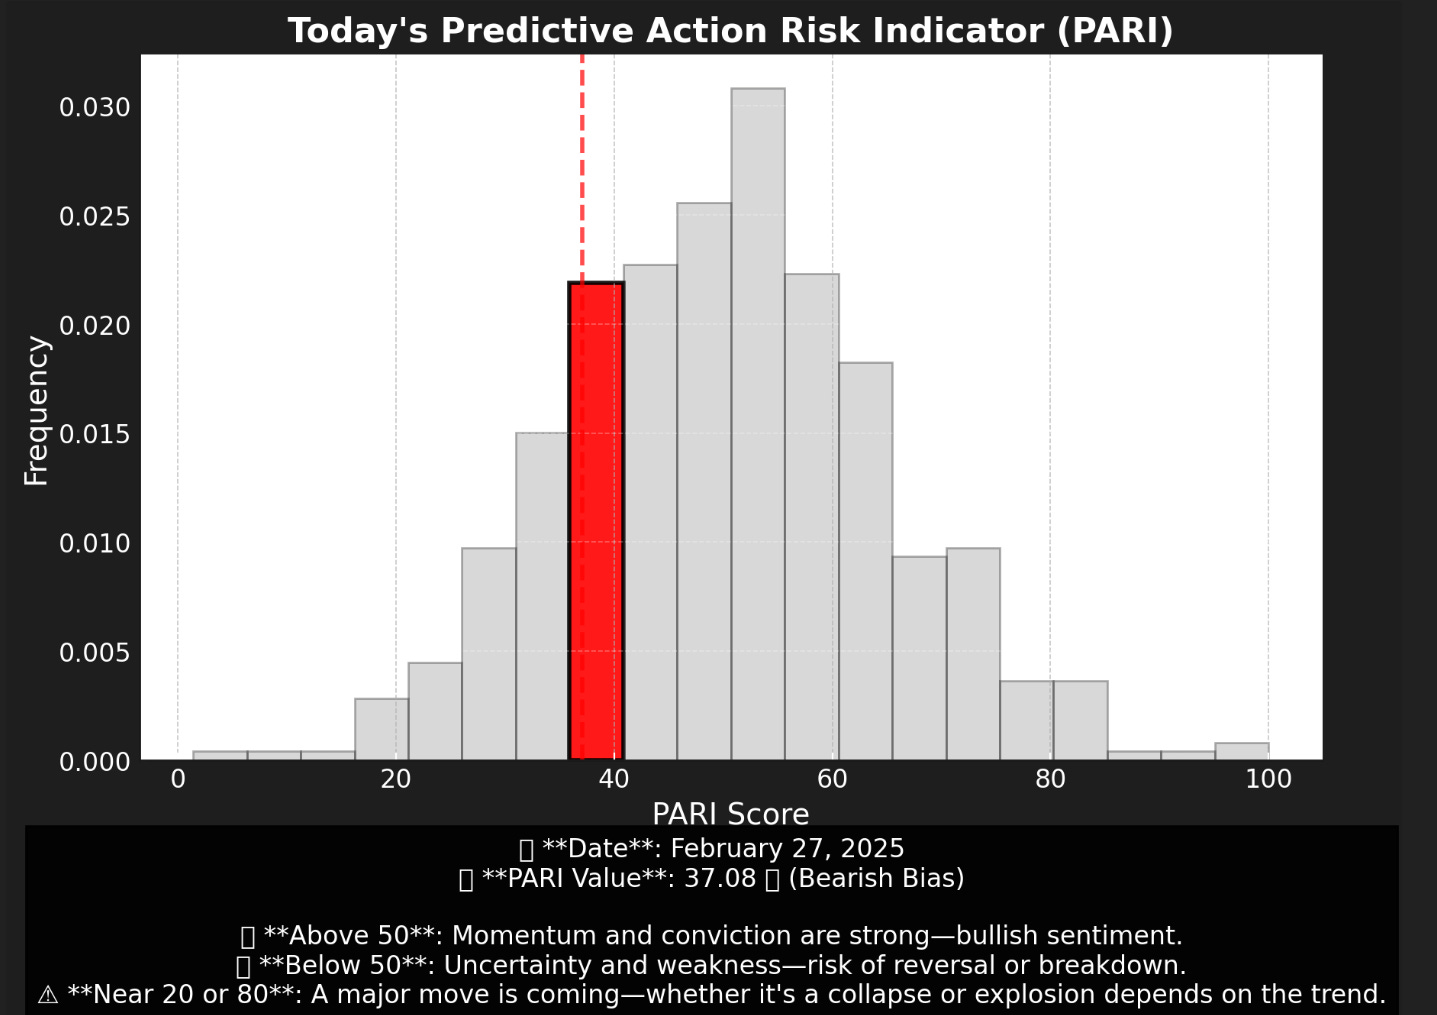
🔎 Key Takeaways:
📉 Momentum is weakening—SPY shows signs of hesitation.
⚠️ Risk is rising. Below 50 = increased uncertainty, potential breakdown.
🚨 Reversal Zone: If PARI drops below 30, expect further downside. If it reclaims 50+, bullish confidence may return—but there are no signs of that yet.
📡 Market Breakdown: Visualizing the Risk Shift
🔍 The market is on edge. Here’s what the data reveals.
📊 1️⃣ Last 4 Weeks: The Market is Unraveling
📅 Tracking the collapse in a high-contrast, easy-to-read table.
📉 Every major PARI drop (🔴 red) marks a critical confidence loss. ⚠️ Below 35? We’re teetering on the edge of a full breakdown. 🔄 If PARI reclaims 50+, expect renewed confidence—but right now, the trend is accelerating downward.
🚨 Visual Breakdown of the Decline:
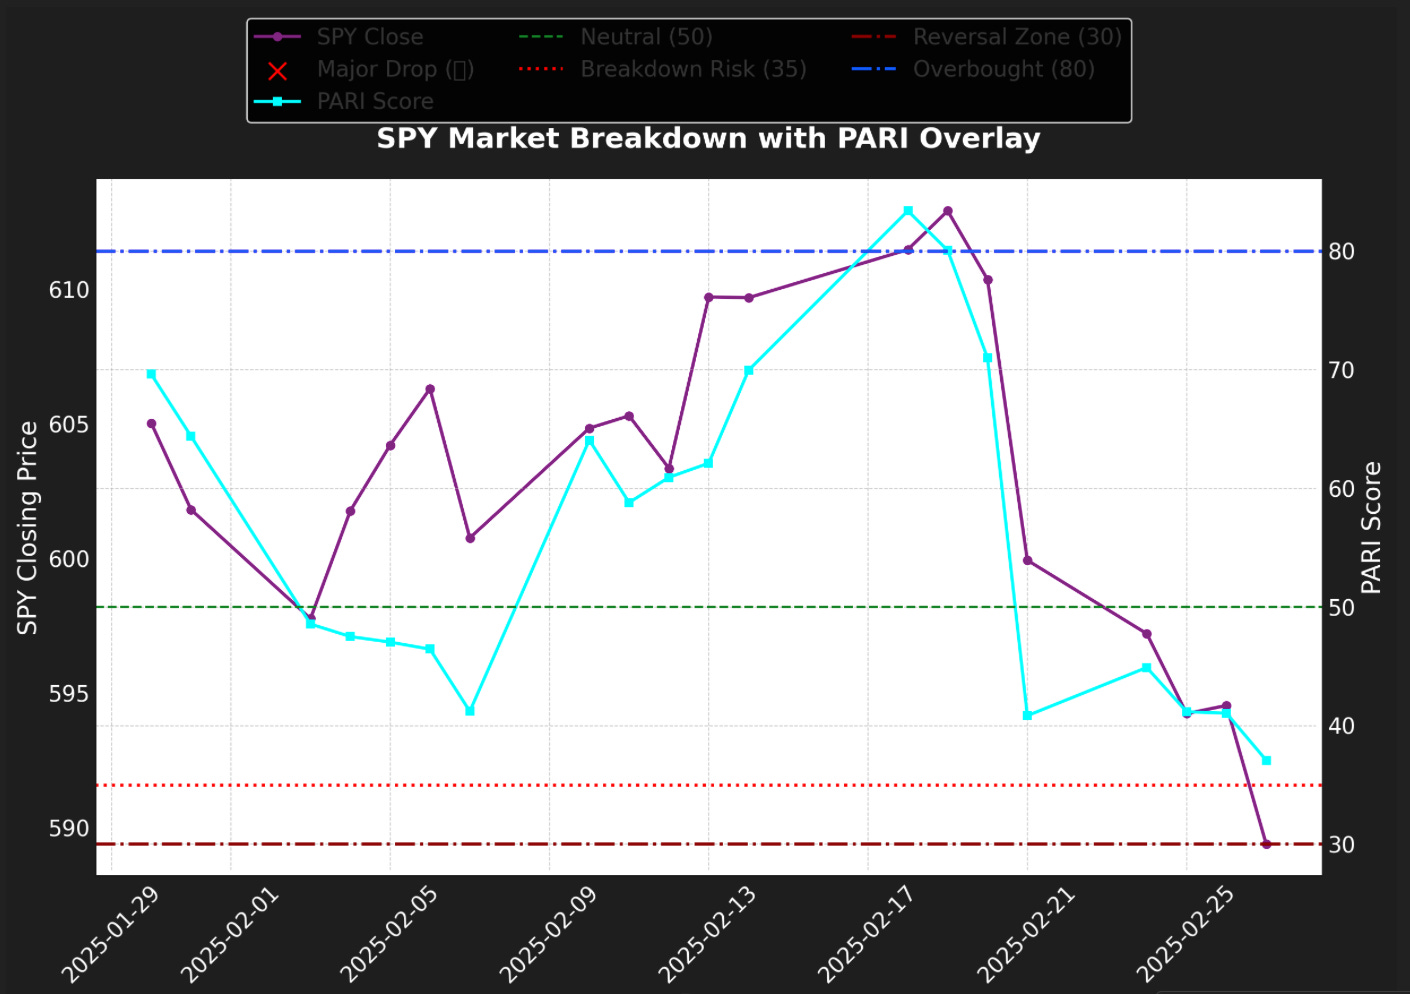
📉 Every major PARI drop (🔴 red) marks a critical confidence loss.
⚠️ Below 35? We’re teetering on the edge of a full breakdown.
🔄 If PARI reclaims 50+, expect renewed confidence—but right now, the trend is accelerating downward.
FOR LATER: notice the market response in the above image once we get above 80. Hm. May be useful for us to remember…
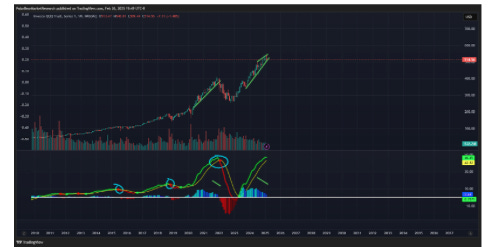
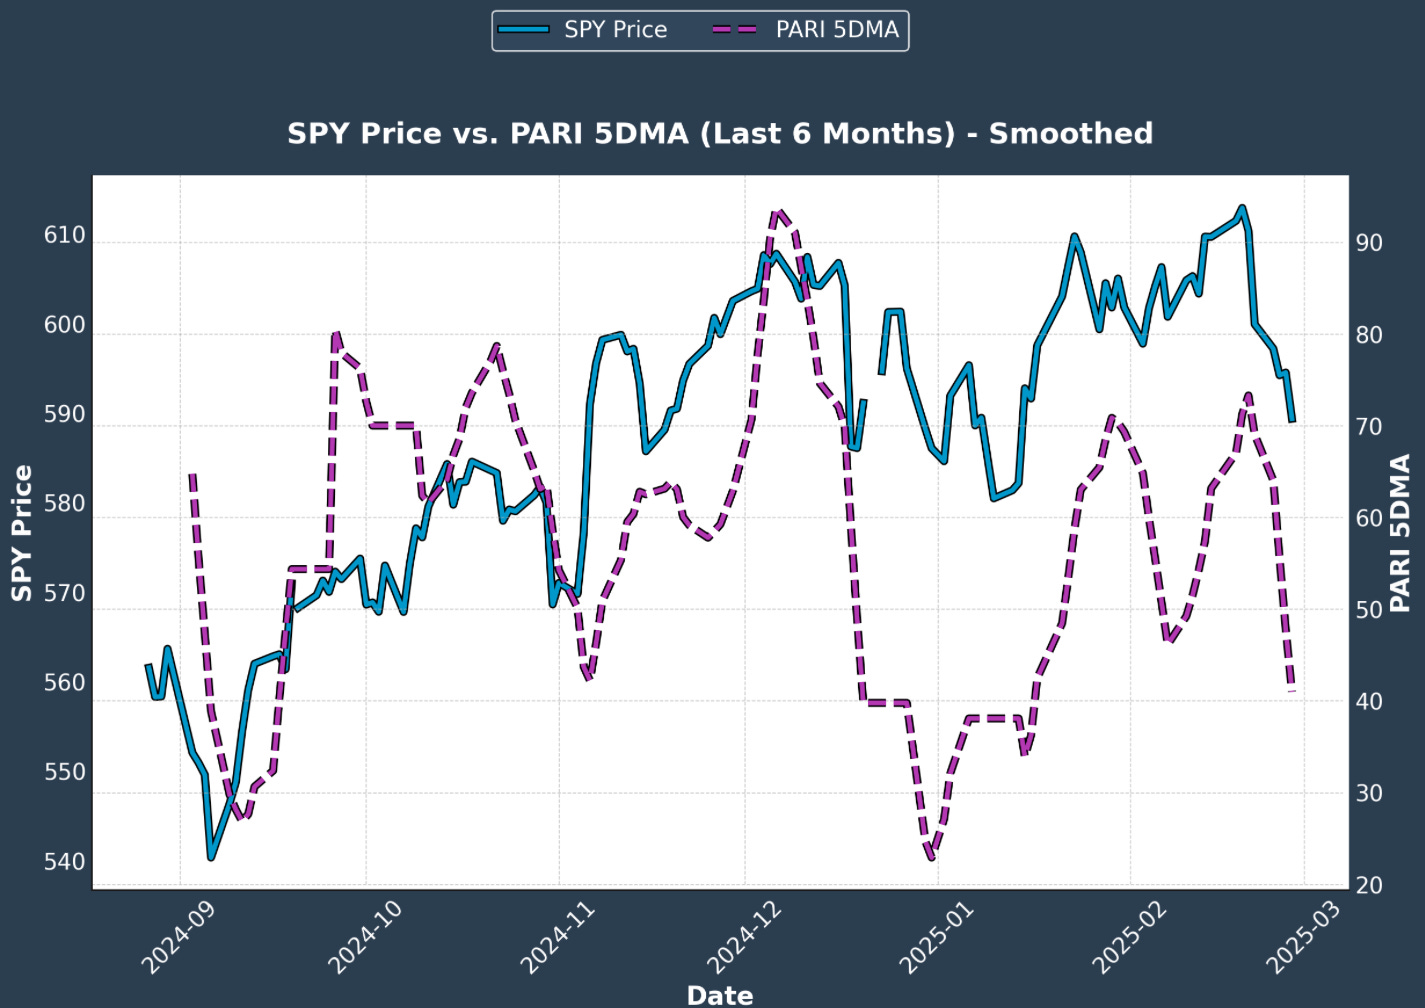
📊 2️⃣ SPY Price Action vs. PARI Trend
🎯 How Market Sentiment Aligns with Risk Levels
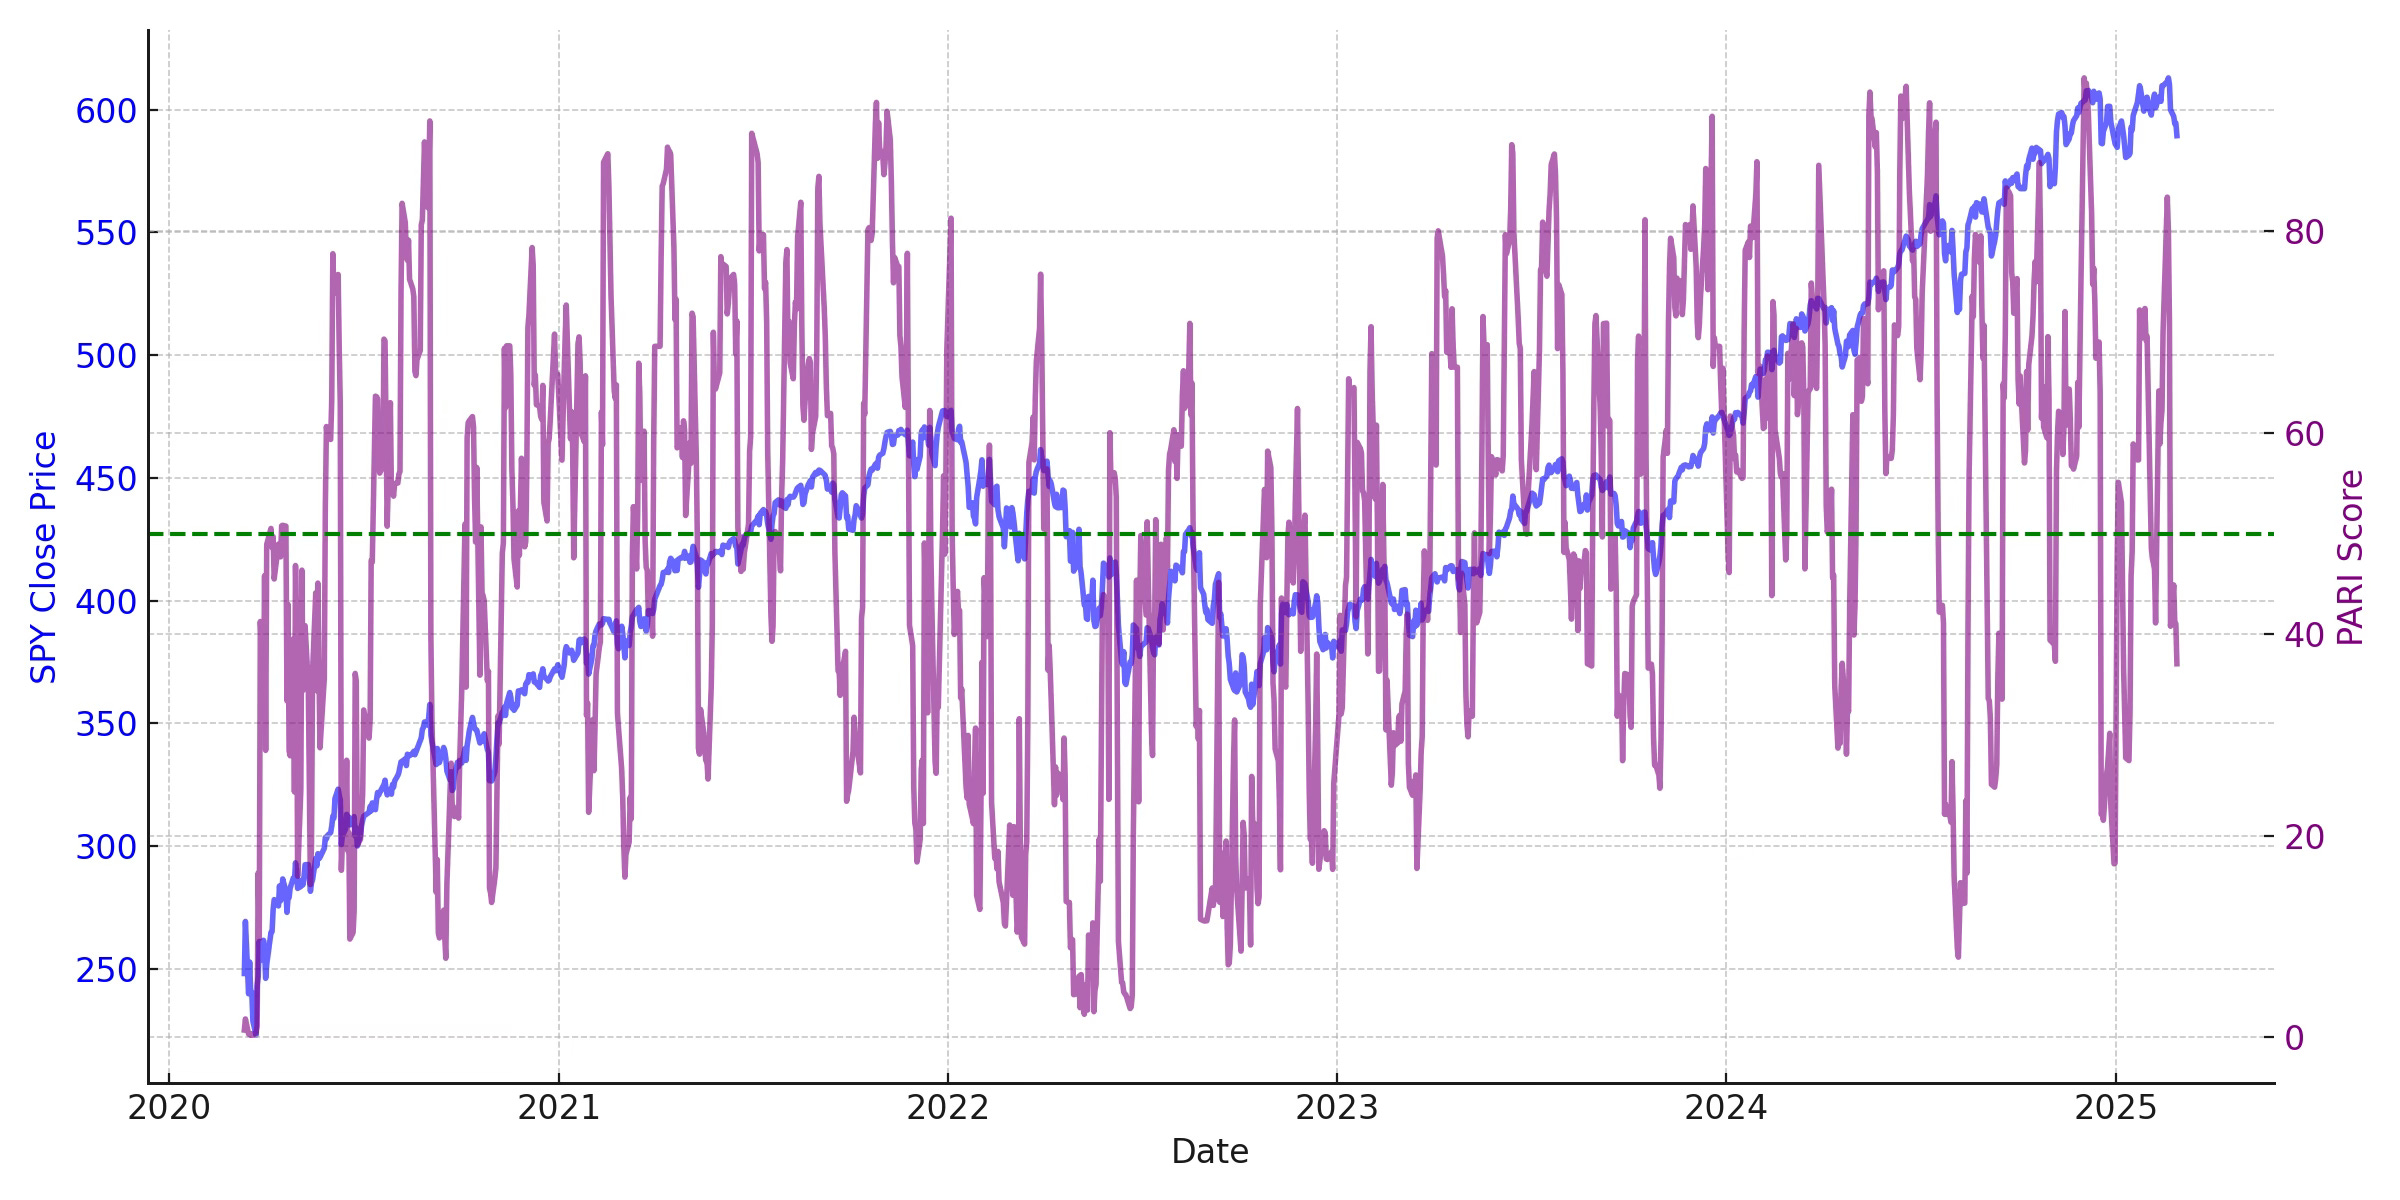
📌 Key Observations: Notice how PARI breaking trend above and below 50 leads sustained market runs down or up
🔹 SPY and PARI moving together? Momentum is still intact.
🔹 Diverging? Expect upcoming volatility and shakeouts.
🔹 SPY rising, but PARI stays low? This rally is a trap—watch out.
🚀 Cool Stuff We Can / Will Do: Unleashing PARI’s Predictive Power
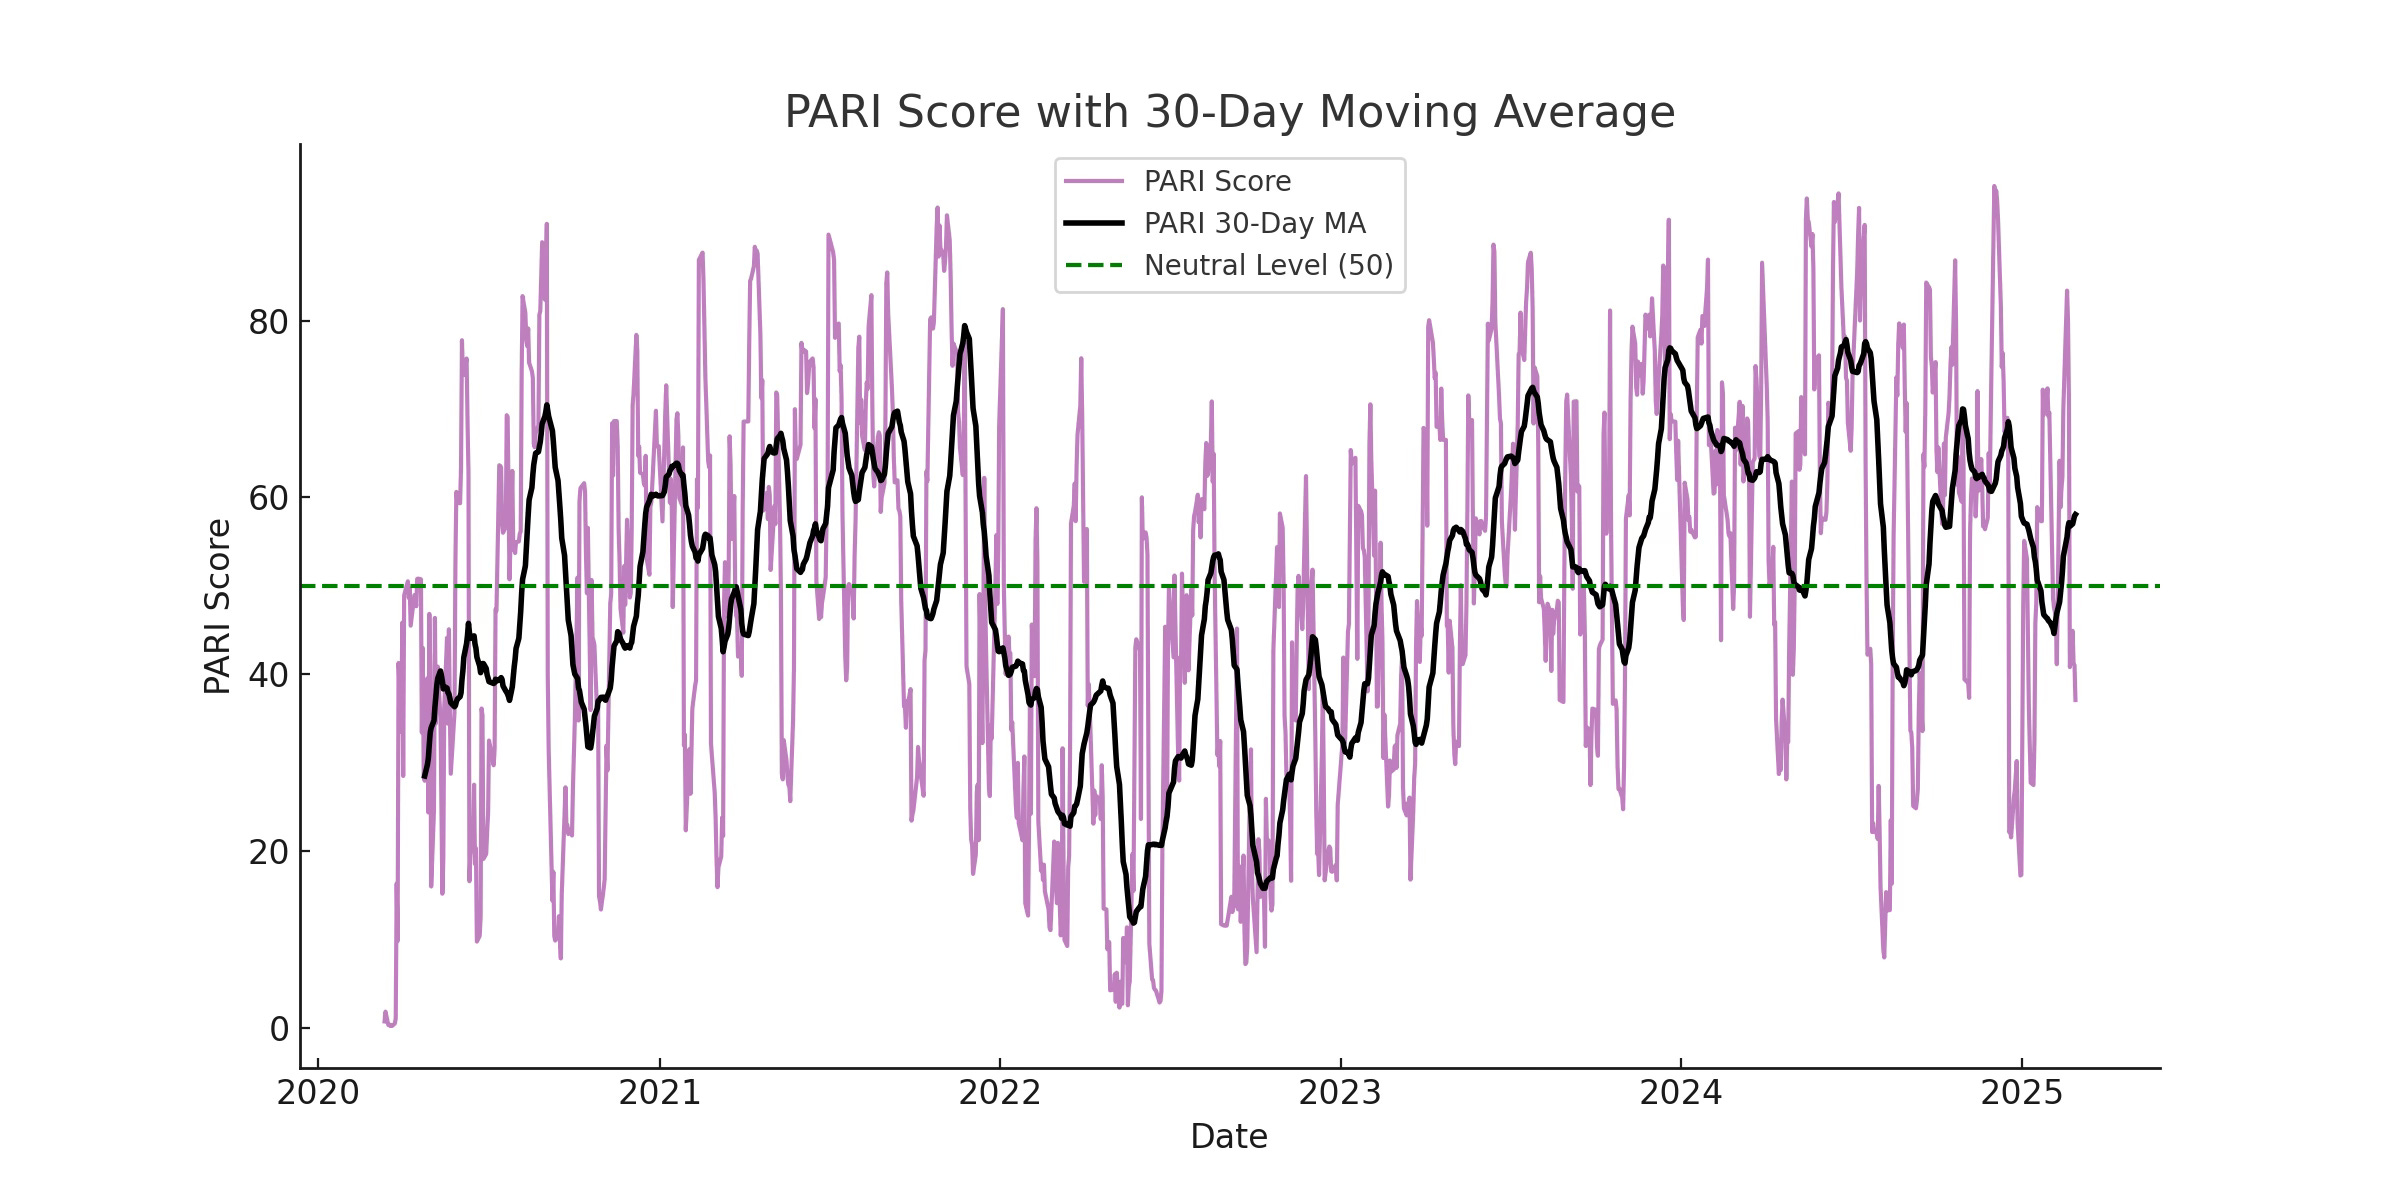
The 5-day moving average of PARI is proving to be a powerful predictor of market movements, smoothing out daily fluctuations and highlighting sentiment shifts more effectively than raw PARI values.
🔹 When the 5-DMA trends downward, SPY tends to experience increased volatility and downside pressure. 🔹 When the 5-DMA holds steady or rises, it often precedes market stabilization and recovery phases.
🚨WHEN THE PARI 5-DMA HITS AN EXTREME LOW OR HIGH (ABOVE 80 OR BELOW 20) IT’S A REALLY GOOD OPPORTUNITY TO PLAY COUNTERTREND FLOW, AS THE EXTREMES TEND TO BE A CONTRARIAN INDICATOR ON THE RETRACE FOR LOGICAL REASONS—YES, YOU FINALLY HAVE A LITERAL “INVERSE MILT” TOOL.
When this happens you will make OBSCENE amounts of money if you pair it with Unusual Whales counter-trend flow— YEET Plus gets my B.A.T. (Bought Against Trend) Filter Free. I’m posting the link in the PLUS session. Here are TODAY’S results as a preview:
🌎 Real-World Examples:
📉 March 2023 - Banking Crisis: The 5-DMA dropped sharply below 20, preceding a multi-day selloff. 📉 August 2023 - Liquidity Exit: A declining 5-DMA coincided with institutions pulling liquidity, leading to volatility spikes. 📈 Early 2024 - AI Momentum Rally: The 5-DMA surged above 50, signaling a prolonged bullish run as AI stocks drove the market higher.
By incorporating the 5-day moving average of PARI into our strategy, we can better anticipate major market shifts before they fully materialize.
📊 PARI Score Distribution Since 2020
📉 Historical Predictive Power:
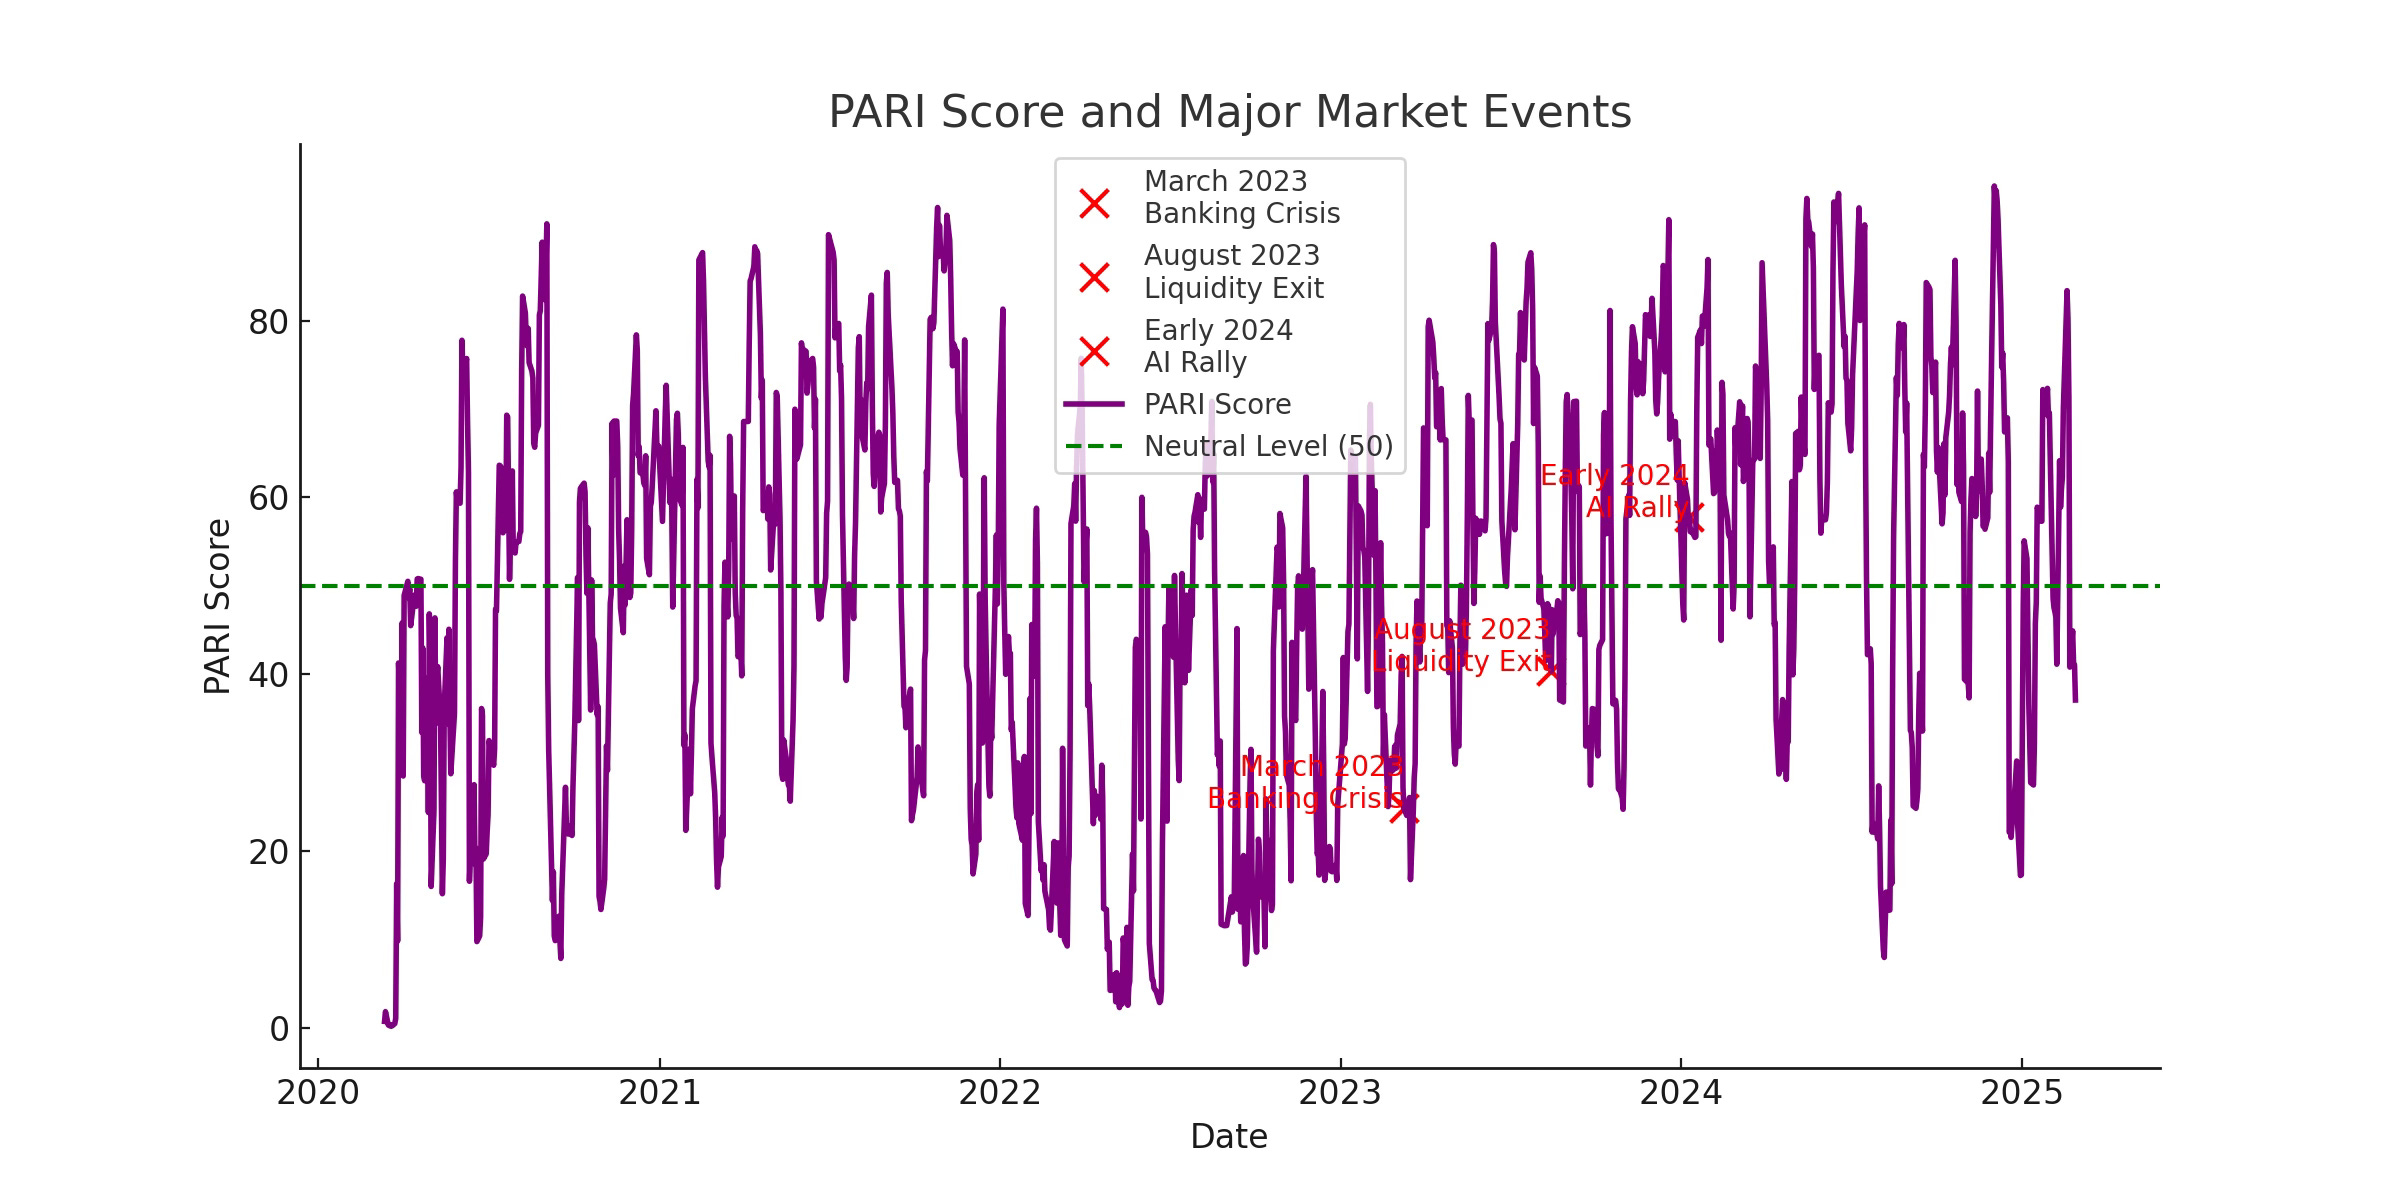
March 2023 – A PARI score below 20 preceded the banking crisis-driven selloff.
August 2023 – A sharp PARI drop signaled reduced liquidity and institutional exit.
Early 2024 – Elevated PARI readings correlated with strong AI-driven upside momentum.
📌 Today’s PARI Reading: 37.08 (High-Risk Setup)
🔻 Key Takeaways:
📉 Current conditions mirror past pre-selloff moments.
📉 Momentum failure indicates weakness rather than consolidation.
📉 Historical models suggest higher volatility ahead.
😷The Safety Section: PARI Best Practices
Strengths of PARI:
✅ Early Warning System: It effectively flags risk levels before price action fully confirms them. A drop below 50 or a spike above 80 has historically signaled shifts in market sentiment.
✅ Combines Multiple Factors: Instead of focusing solely on momentum, it integrates volatility and trend persistence, providing a more well-rounded sentiment indicator than standalone momentum oscillators.
✅ Historical Predictive Power: The backtests show PARI accurately warned of major shifts, such as the banking crisis in 2023 and the AI-driven rally in early 2024.
Limitations of PARI
⚠️ Not a Standalone Trading Signal: While it highlights sentiment trends, it doesn't provide precise entry/exit points like technical price levels or volume-based indicators.
⚠️ Lag in Some Market Conditions: Because it relies on rolling averages and rankings, it might react slightly late to extremely sharp moves, like flash crashes or sudden liquidity events.
⚠️ Best Used in Context: To maximize effectiveness, PARI should be paired with other technical and macroeconomic data to confirm signals rather than dictate trades outright.