💅There's Something About PARI: JAM PACKED issue. Issue THICC with info, plays, and EDU!
Buckle up because it's a long, educational ride through the market today.

Welcome! Let’s get to it—

This thing is so thicc it needs a table of contents:
📌 Table of Contents
🐳 Flow Analysis: When Calls and Puts Both Get Juiced, Something’s Up
🟡 Consolidation Levels: The Chop Shop Reversal Engine
📢 The Megaphone Expands!
💅 There’s Something About PARI: How YEET Went 7/8 Scalping with it, Tracked Live in Discord
🚀 Debuting NVDA DAILY & INTRADAY PARI: The First of Many Equity PARIs for Yeet Plus
🔎 How NVDA PARI Could Have Helped Recently
📉 NVDA PARI Overlay (Last 12 Sessions)
🐳 NVDA Flow: 122c Picking up heavy action on the INTRADAY SNIPER
🔥 YEET Plus Section: New Banger Alert FROM FARCRY
🐳 Flow Analysis: When Calls and Puts Both Get Juiced, Something’s Up
🔥 Key Observation: Today, net out-of-the-money (OTM) call and put premium BOTH surged while SPY climbed from 573.50 at open to a peak of 584.13, closing near 582.89.
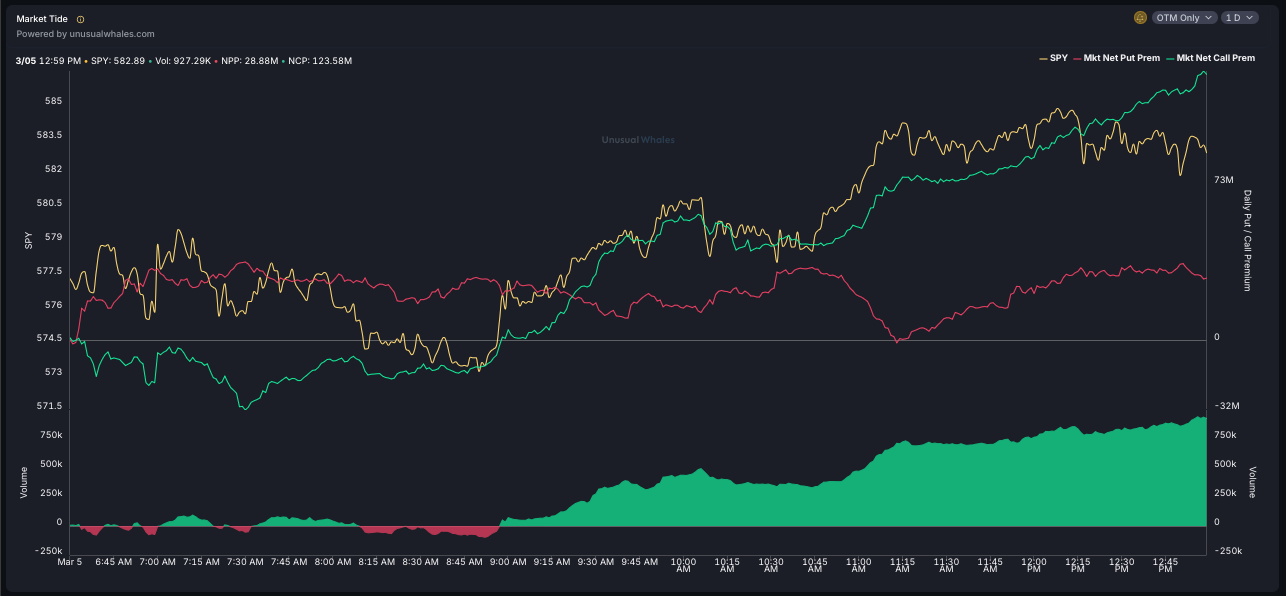
📊 Flow Analysis: When Calls and Puts Both Get Juiced, Something’s Up
🔥 Key Observation: Today, net out-of-the-money (OTM) call and put premium BOTH surged while SPY climbed from 573.50 at open to a peak of 584.13, closing near 582.89.
Breaking It Down:
Net Call Premium (NCP) 🚀: +123.58M (Up from ~102M earlier)
This means call buyers were aggressive, bidding up OTM strikes as SPY rallied.
Bullish traders or hedging by dealers? Depends on who is behind it.
Net Put Premium (NPP) 📉: +28.88M
Not as intense as calls, but put premium held up while price rose.
This is unusual! Normally, put premium falls when SPY rises.
Total Volume: Nearly 927K contracts traded OTM today—big players are active.
🤔 What does this mean? 🔸 If this was pure bullish flow, we’d see put premium declining sharply, but it's still elevated.
🔸 When puts and calls both increase, it often signals hedging for expected volatility rather than just directional bets.
🔸 This could mean market makers are adjusting hedges aggressively, expecting a big move ahead (not necessarily just up!)..
💡 Final Thought:
This isn’t just a “bullish” or “bearish” signal—it’s an alert for volatility ahead.
Big players are hedging both ways, which means be ready for MORE sharp moves, not just trend following. 🚀🔄
🟡 Consolidation Levels: The Chop Shop Reversal Engine
🚦 "You either respect these levels, or you get rejected into the abyss."
The yellow lines on this chart aren’t just decorations—these have been elite at catching reversals and rejections over time.
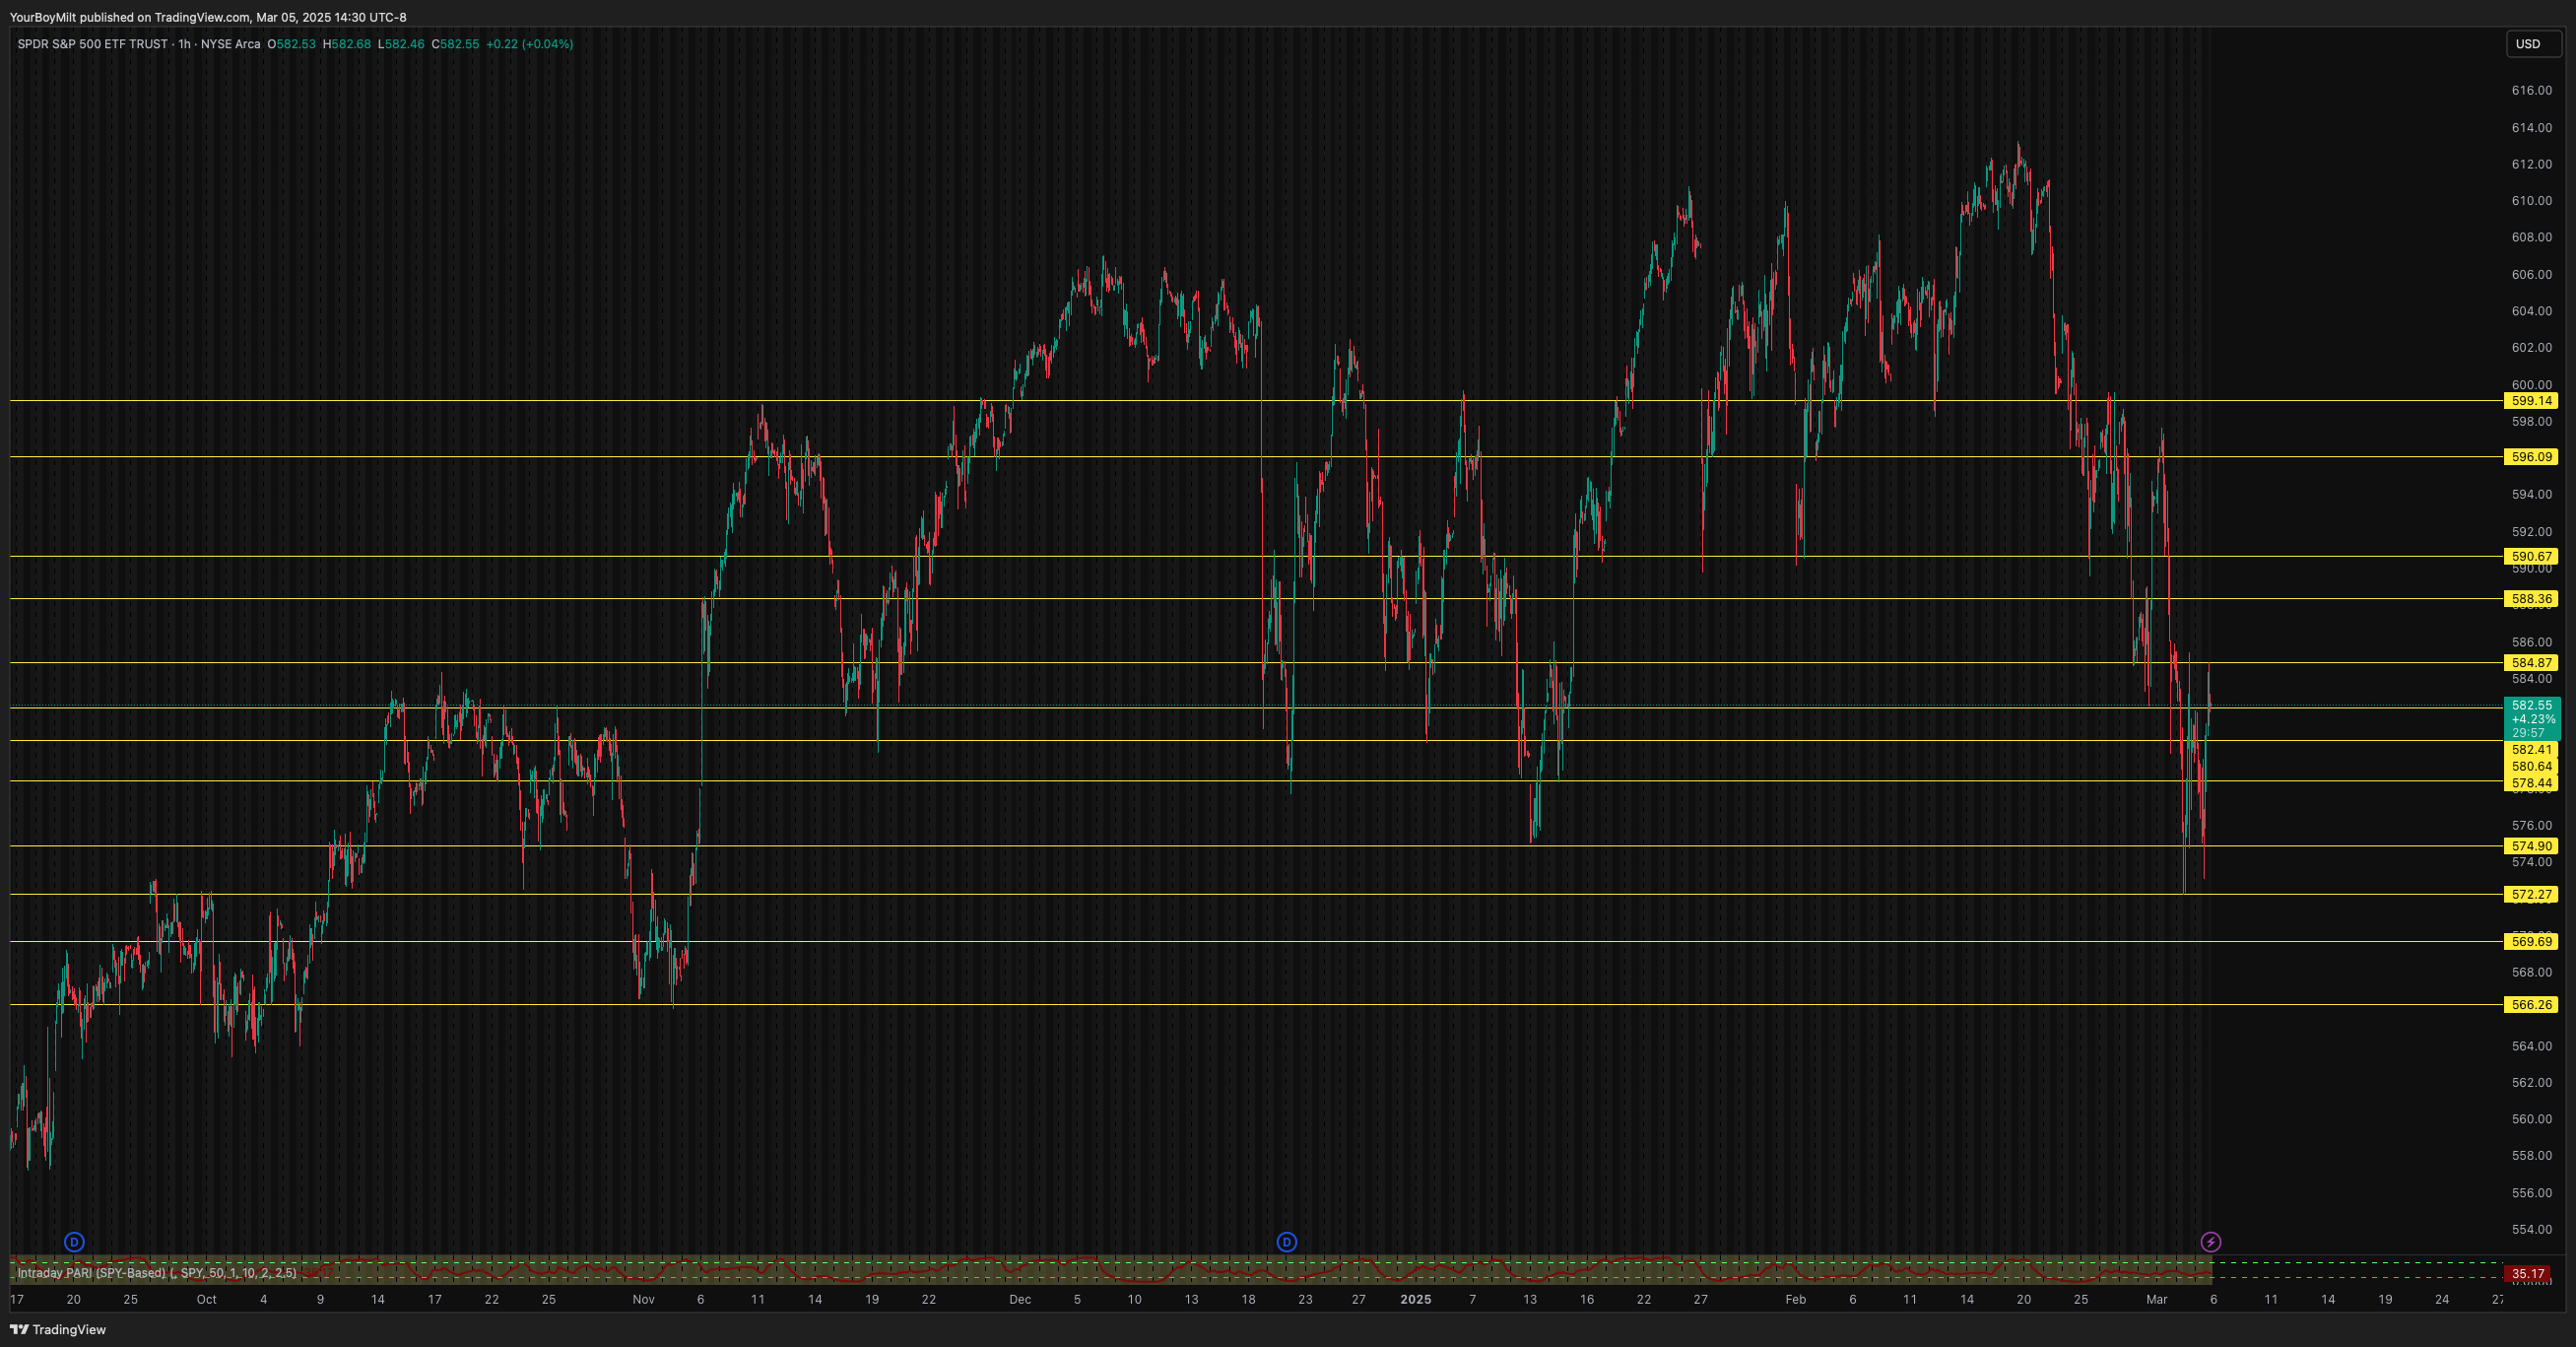
🔍 How did they work today?
✅ SPY fell from 588.36 on March 1, couldn’t hold above 582.41 today → backtested it multiple times.
✅ We dipped to 578.44 and snapped back up 🚀—that’s your classic liquidity grab and rebound.
✅ We NEVER touched 574.90, meaning bears failed to break structure, and bulls had room to run.
📢 Key Takeaway: If you’re not measuring reversals & rejections off these levels, you’re missing out on some of the cleanest trades this range has offered in months.
📢 The Megaphone Expands!
🎤 Hello darkness, my old friend… we’re widening this range again!
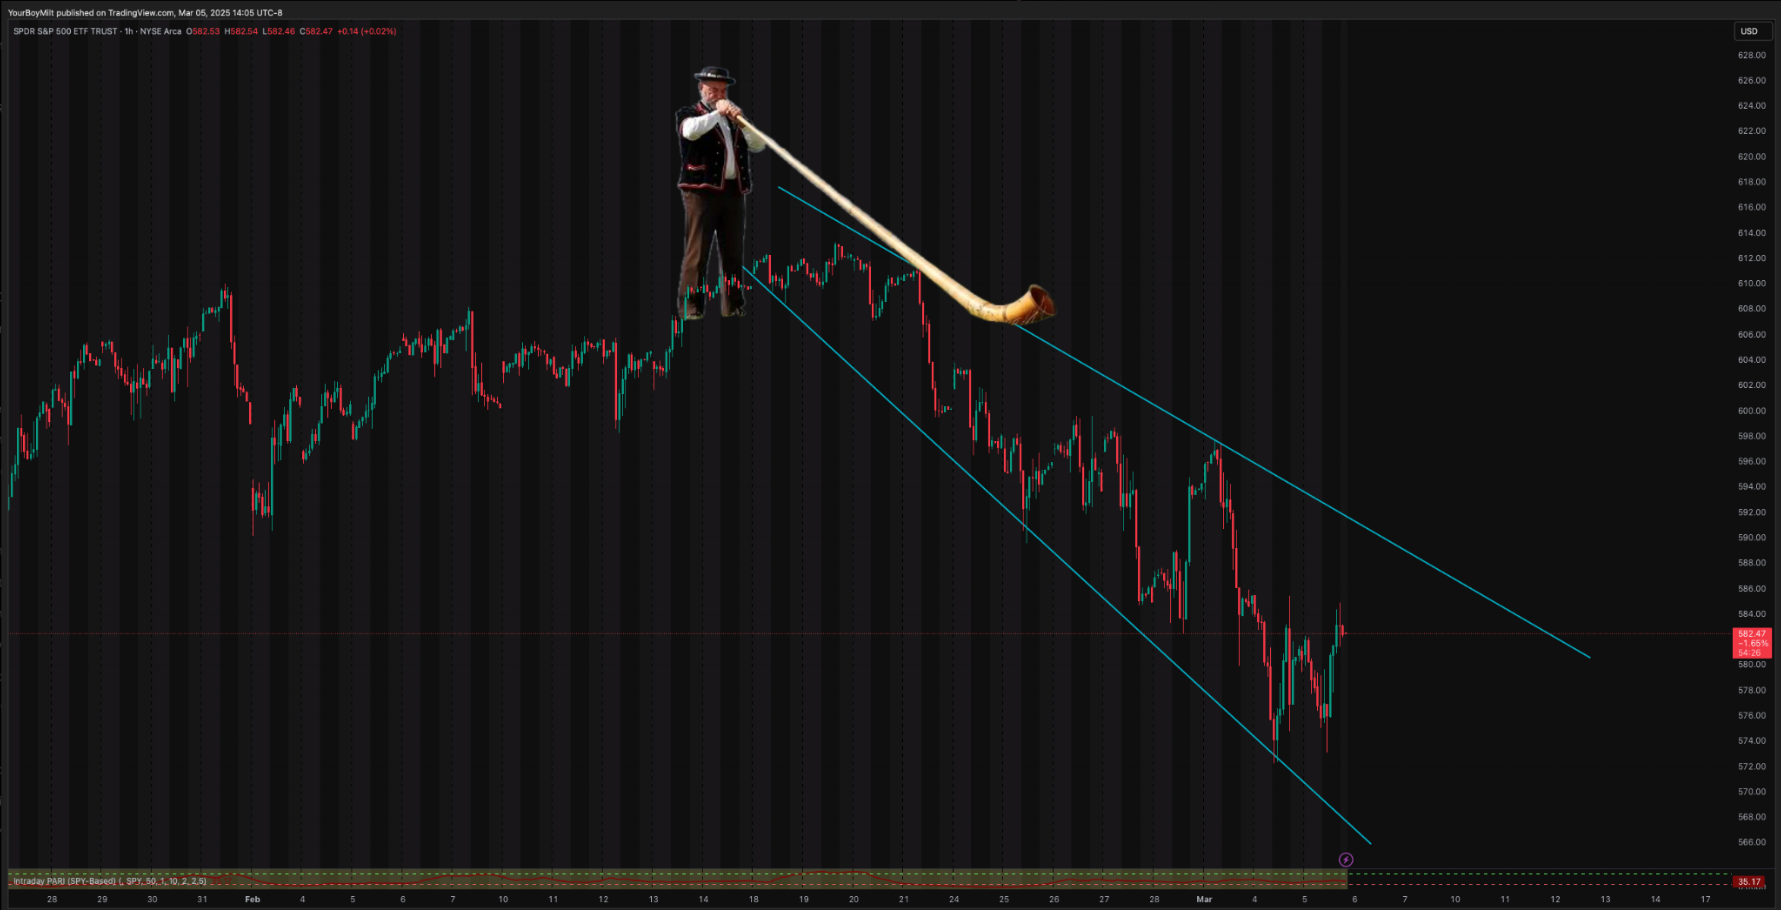
Lower bounds: Dropped from 594 to 572
Upper bounds: Expanding into the low 580s
Why does this matter?
Megaphones are signs of instability – wider price swings signal liquidity hunts, not sustained trends.
The breakout will come AFTER we squeeze both ends—so don’t get married to a direction yet.
SPY tested the lower bound today (~573) and rebounded HARD—if we get a similar test on the upper bound (~588), expect at least a short-term fade.
🚨 What’s Next?
582.41: Make or break—stay above = bullish, fail = 578 test again.
588.36: If we even get there, it’s a top-tier fade candidate.
574.90: If we break below, things start spiraling fast.
🔥 Final Word: Megaphones are mean—trade them like a villain.
🎯 Sell the highs, buy the lows, and for the love of Theta, don’t chase mid-range entries unless you enjoy unnecessary pain.
💅There’s Something About PARI: More PARI Uses Explained, How YEET Went 7/8 Scalping with it Tracked Live in Discord, and More!

The Price Action Risk Indicator (PARI) is a momentum and volatility-based tool designed to help traders identify shifts in trend strength and potential trade setups on a 0-100 scale. It works by analyzing momentum (price movement vs. historical averages) and volatility (rate of price change) to determine whether an asset is in a strong trend, consolidating, or at risk of reversal. Daily PARI provides a broader view of market structure, helping traders track multi-day trends, spot exhaustion points, and confirm major breakouts or breakdowns. Intraday PARI, on the other hand, recalculates throughout the day to capture real-time shifts in momentum and risk, making it especially valuable for scalping, momentum trading, and pinpointing reversals at key price levels. While SPY PARI remains relatively stable, reflecting the ETF’s diversified nature, equity PARI (e.g., NVDA) is far more volatile, responding more aggressively to sharp price swings. When PARI drops below 20, it signals oversold conditions, often preceding a bounce, while a reading above 80 suggests potential exhaustion, making it an excellent tool for both trend-followers and mean reversion traders.
Yesterday I let the YEET Discord know I was going SCALP MODE to test out Intraday PARI using my Price Action levels day trading strategies. So far it’s been 7 for 8, called live in the Discord including a few multi-baggers and a BIG TIME EOD squeeze callout.
I’ve recorded a guide to Intraday PARI so you can use this tool yourself.
🚀 Debuting NVDA DAILY AND INTRADAY PARI: The First of Many Equity PARIs for Yeet Plus
We’re expanding PARI analysis to individual equities, starting with NVDA, as part of Yeet Plus.
Until now, PARI has been a powerful tool for tracking SPY momentum, but equities behave differently, so we’re adapting PARI for stocks to capture more precise trend signals.
THIS IS A LOOK AT HOW PARI WILL BE INCORPORATED IN PA AND FLOW IN MOST YEET PLUS ISSUES FOR SPECIFIC EQUITIES I FIND THAT LOOK RIPE TO BE ON WATCH FOR A RUN. NVDA IS RIPE.
NVDA INTRADAY PARI: TradingView Indicator link below in YEET Plus
You can absolutely use SPY PARI on the NVDA chart, but the key when the equities PARI intraday indicators are released is that they recalculate the 80/20 percentile boundaries so if you’re using those for scalping, holding, adding, etc, it’s already done for you
📊 NVDA PARI vs. SPY PARI: How Do They Compare?
✅ SPY PARI is stable, rarely straying far from 50, since the index smooths out volatility.
⚡ NVDA PARI fluctuates wildly, making it more sensitive to momentum shifts.
🎯 Both track trends, but NVDA’s version reacts faster—this is key for high-beta stocks.
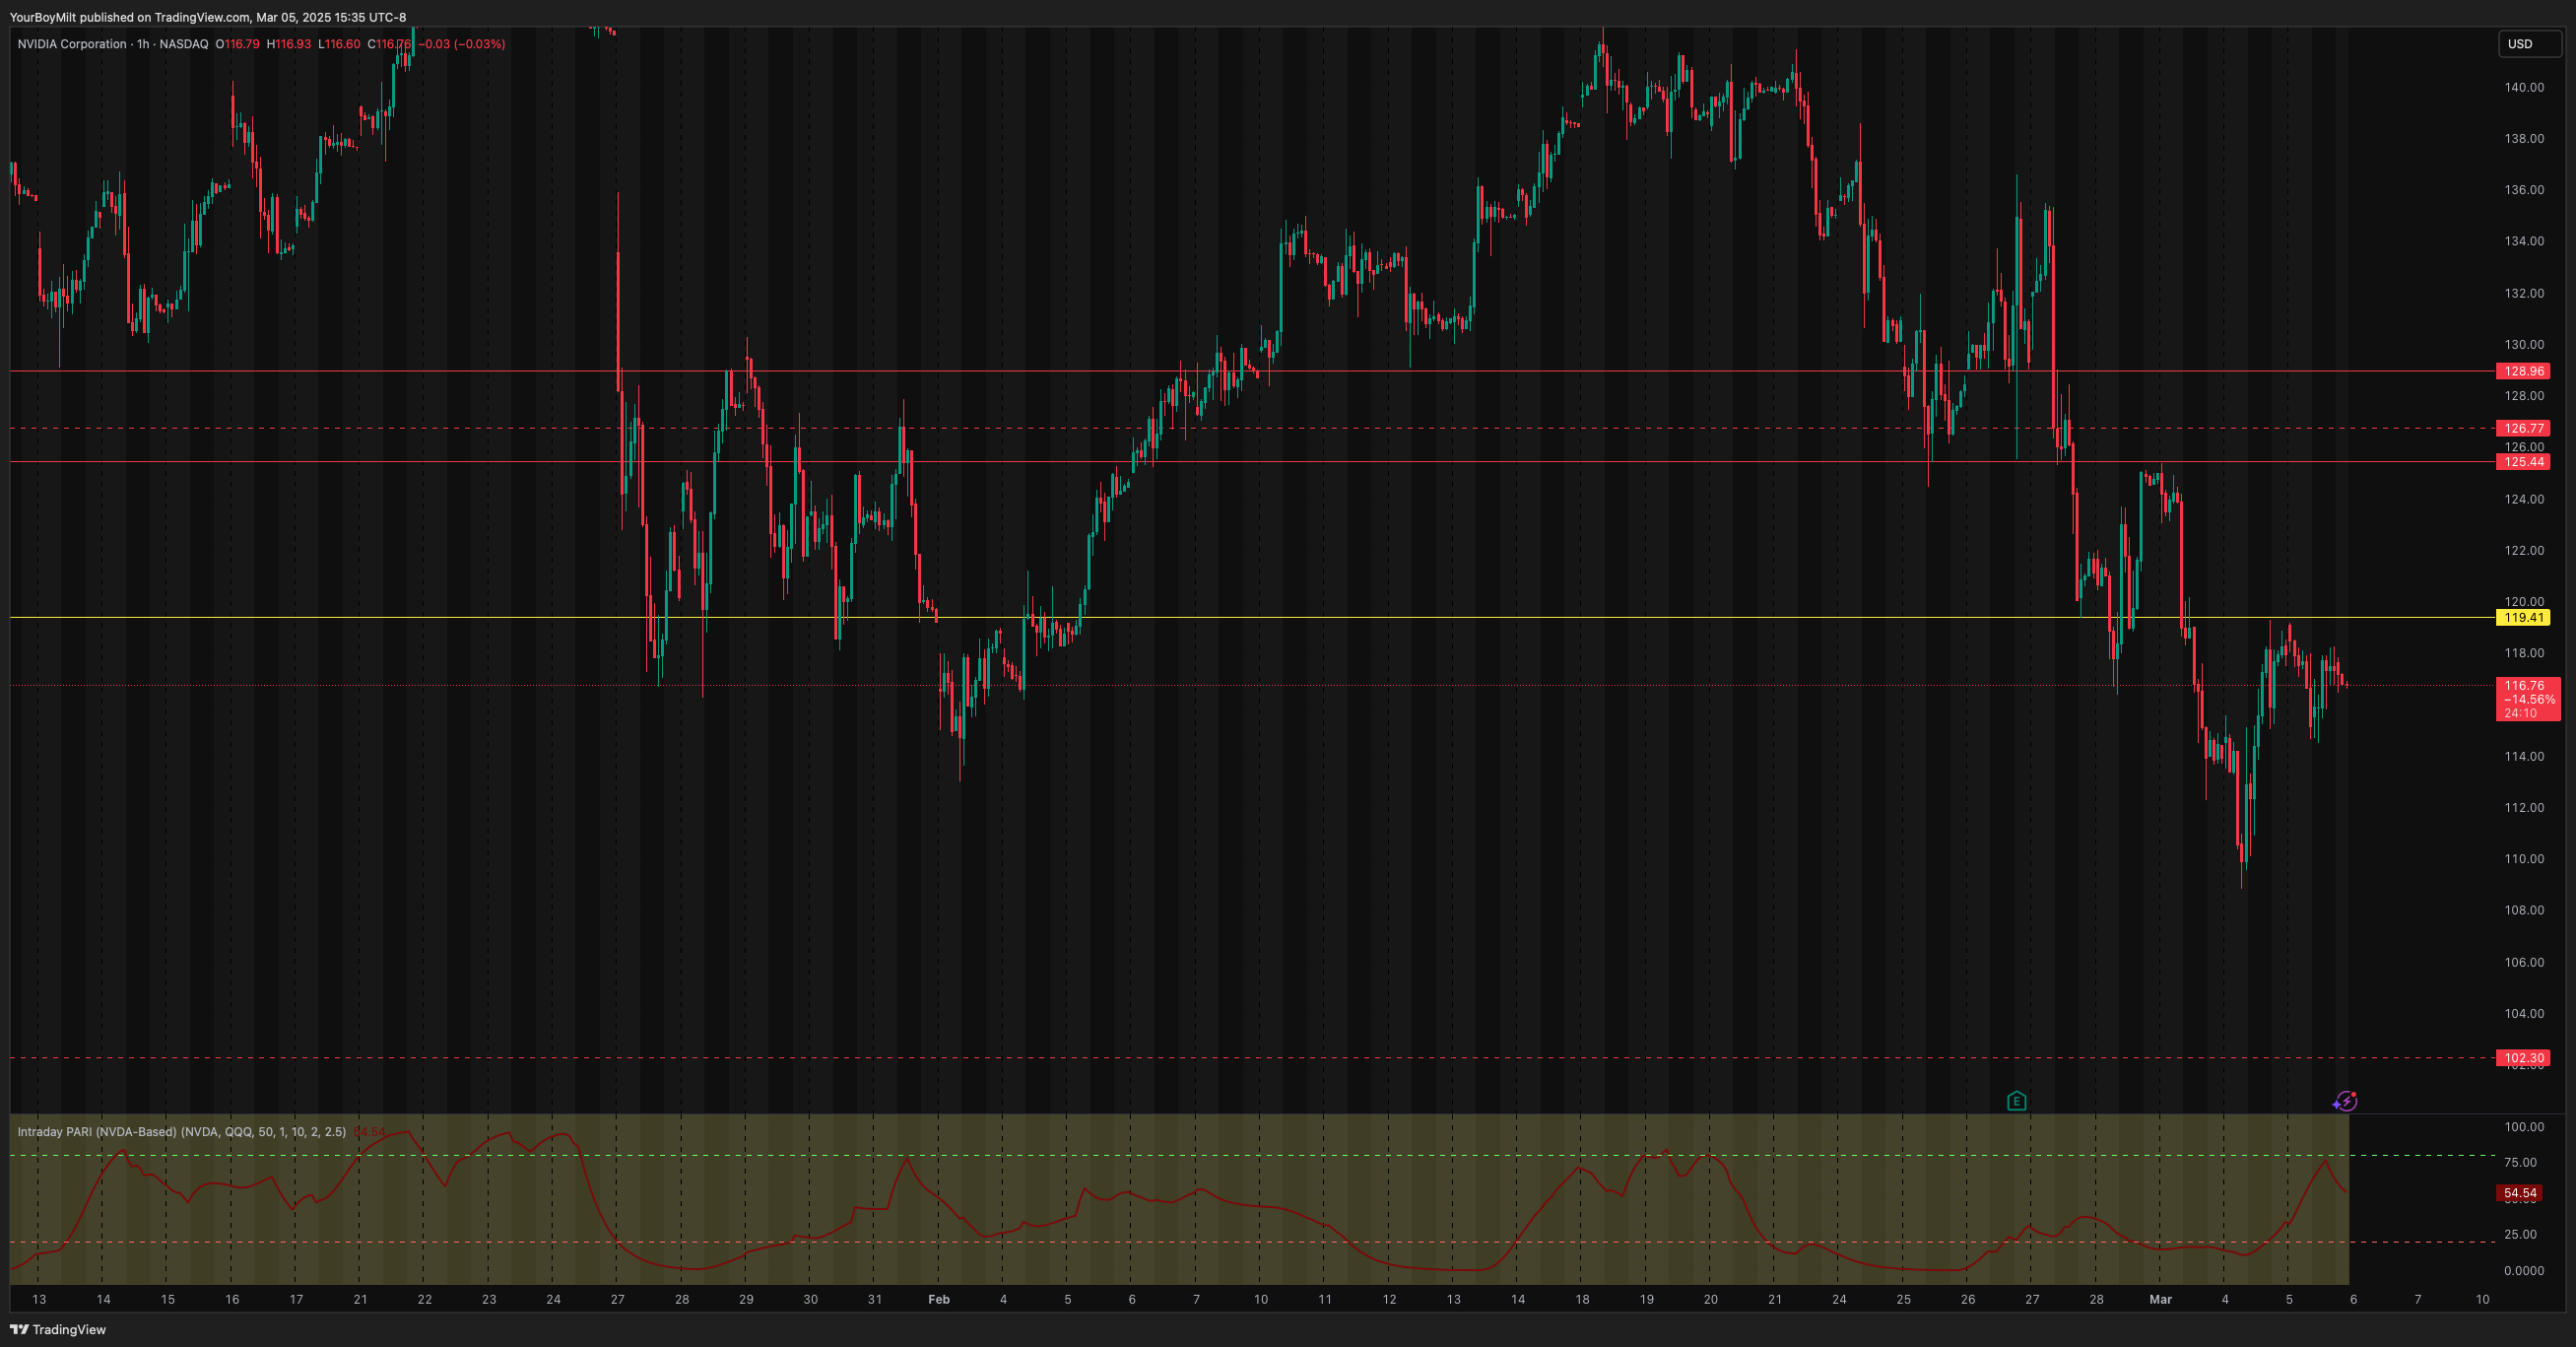
🔎 How NVDA PARI Could Have Helped Recently
Over the last 12 sessions, NVDA followed a textbook PARI momentum breakdown:
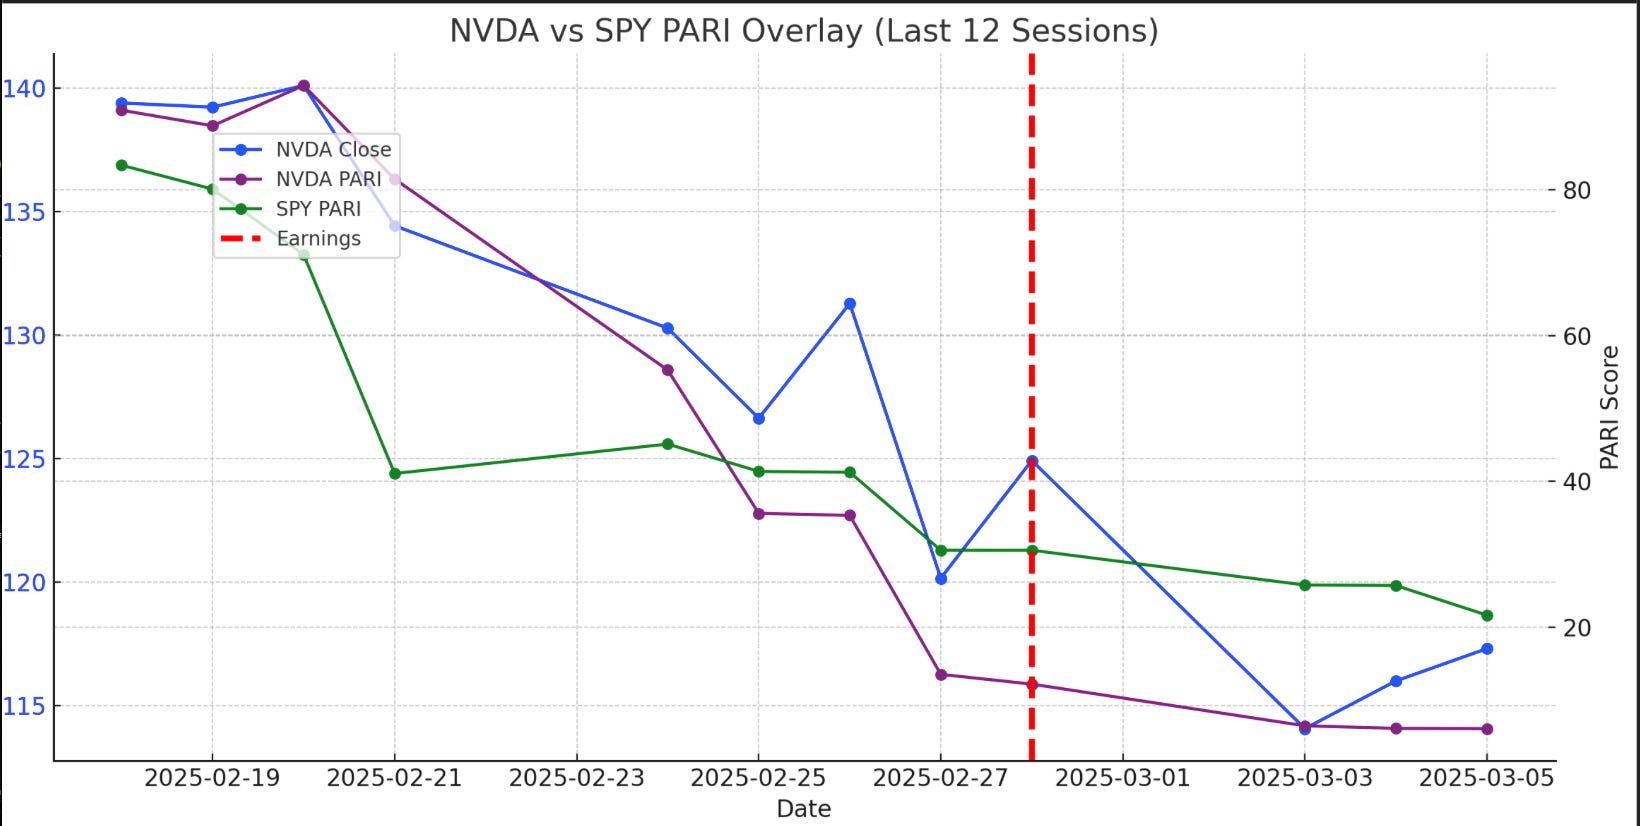
📅 Pre-Earnings (Feb 21 - Feb 28)
✔️ PARI peaked near 80+ → Confirmed strong bullish momentum
✔️ Price climbed toward $140 → Buyers controlled the trend
📅 Post-Earnings Drop (Feb 28 - Mar 5)
❌ PARI collapsed below 20 → Rapid loss of bullish strength
❌ Price fell to $117 → Weakness followed the low PARI signal
📉 NVDA PARI Overlay (Last 12 Sessions)
This PARI overlay shows how momentum broke down after earnings:
NVDA PARI vs. Close Price (Last 12 Sessions)

📉 Is NVDA’s Low PARI Bullish?
Right now, NVDA’s PARI is at extreme lows (<20), signaling one of two things:
🔻 Bearish Case:
Momentum is still weak → No strong buyers stepping in yet.
PARI has stayed low for multiple sessions, which sometimes precedes further downside.
If price continues falling while PARI stays low, sellers remain in control.
✅ Bullish Case:
Historically, PARI < 20 doesn’t last long → It often precedes a bounce.
If price stabilizes near $115-$117 and PARI starts rising, this could mark the beginning of a reversal.
Watch for increasing PARI while price holds steady → That’s the classic turnaround signal.

🐳NVDA Flow: 122c Picking up heavy action on the INTRADAY SNIPER
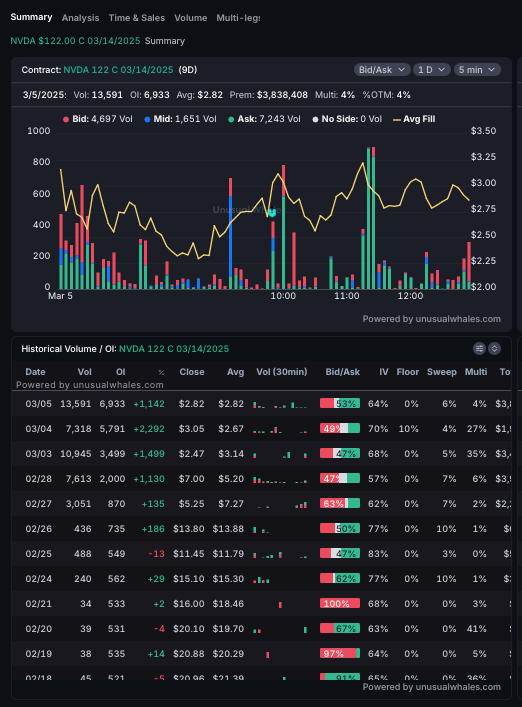
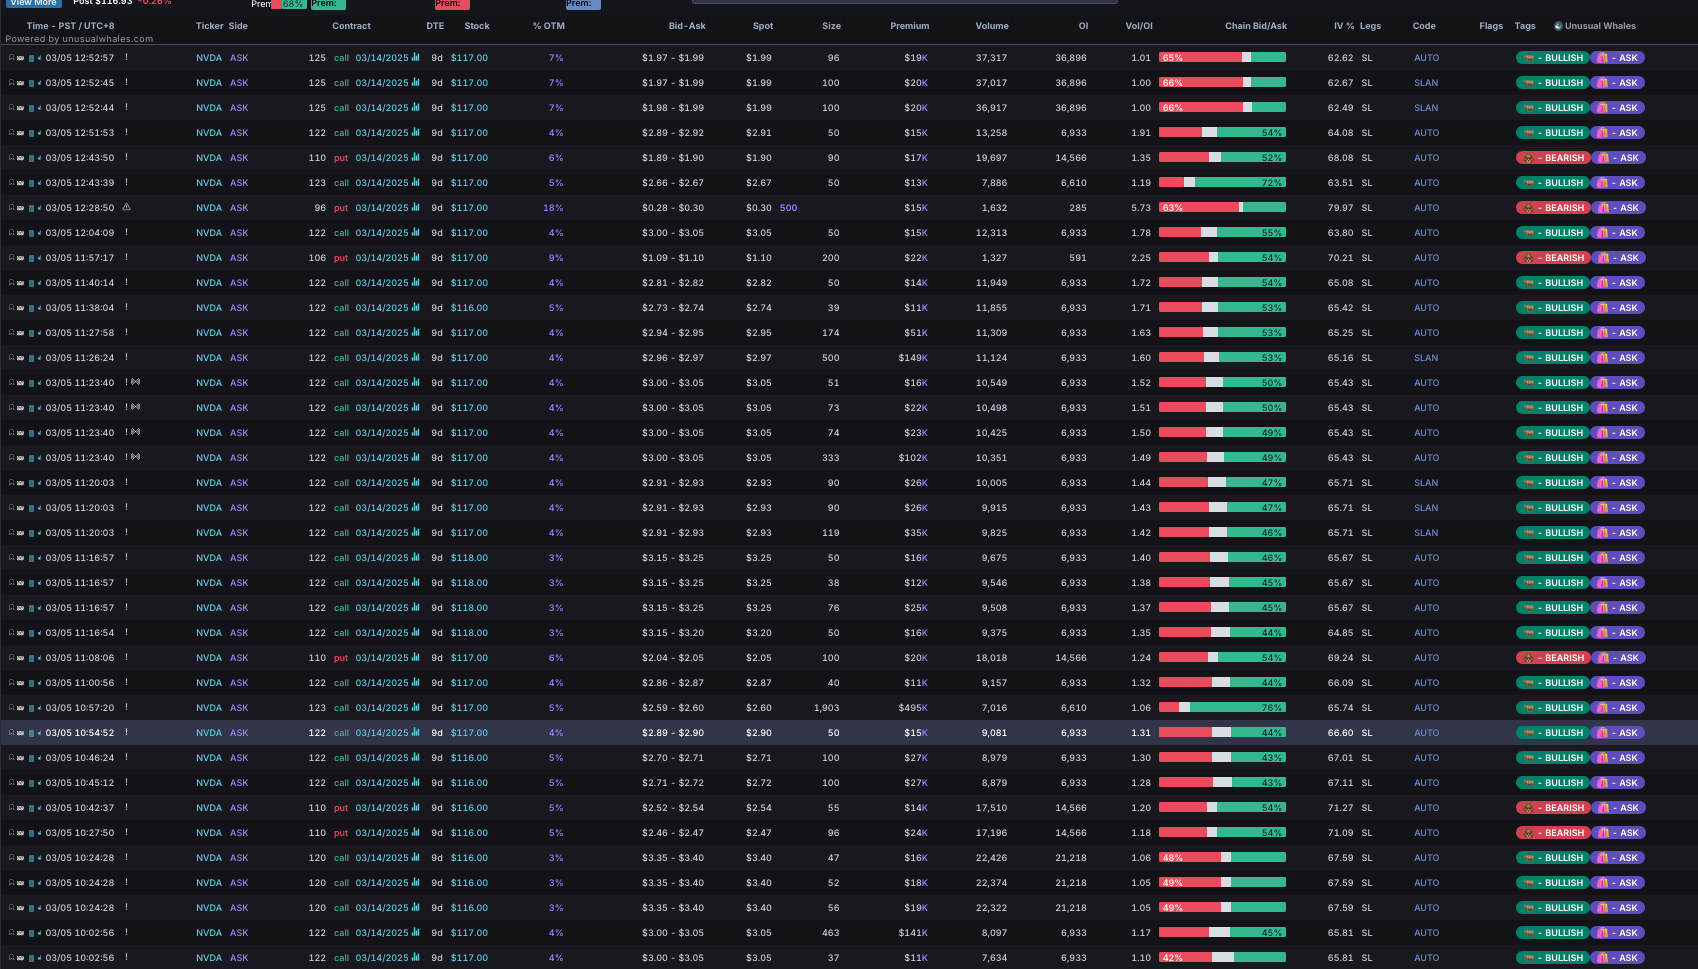
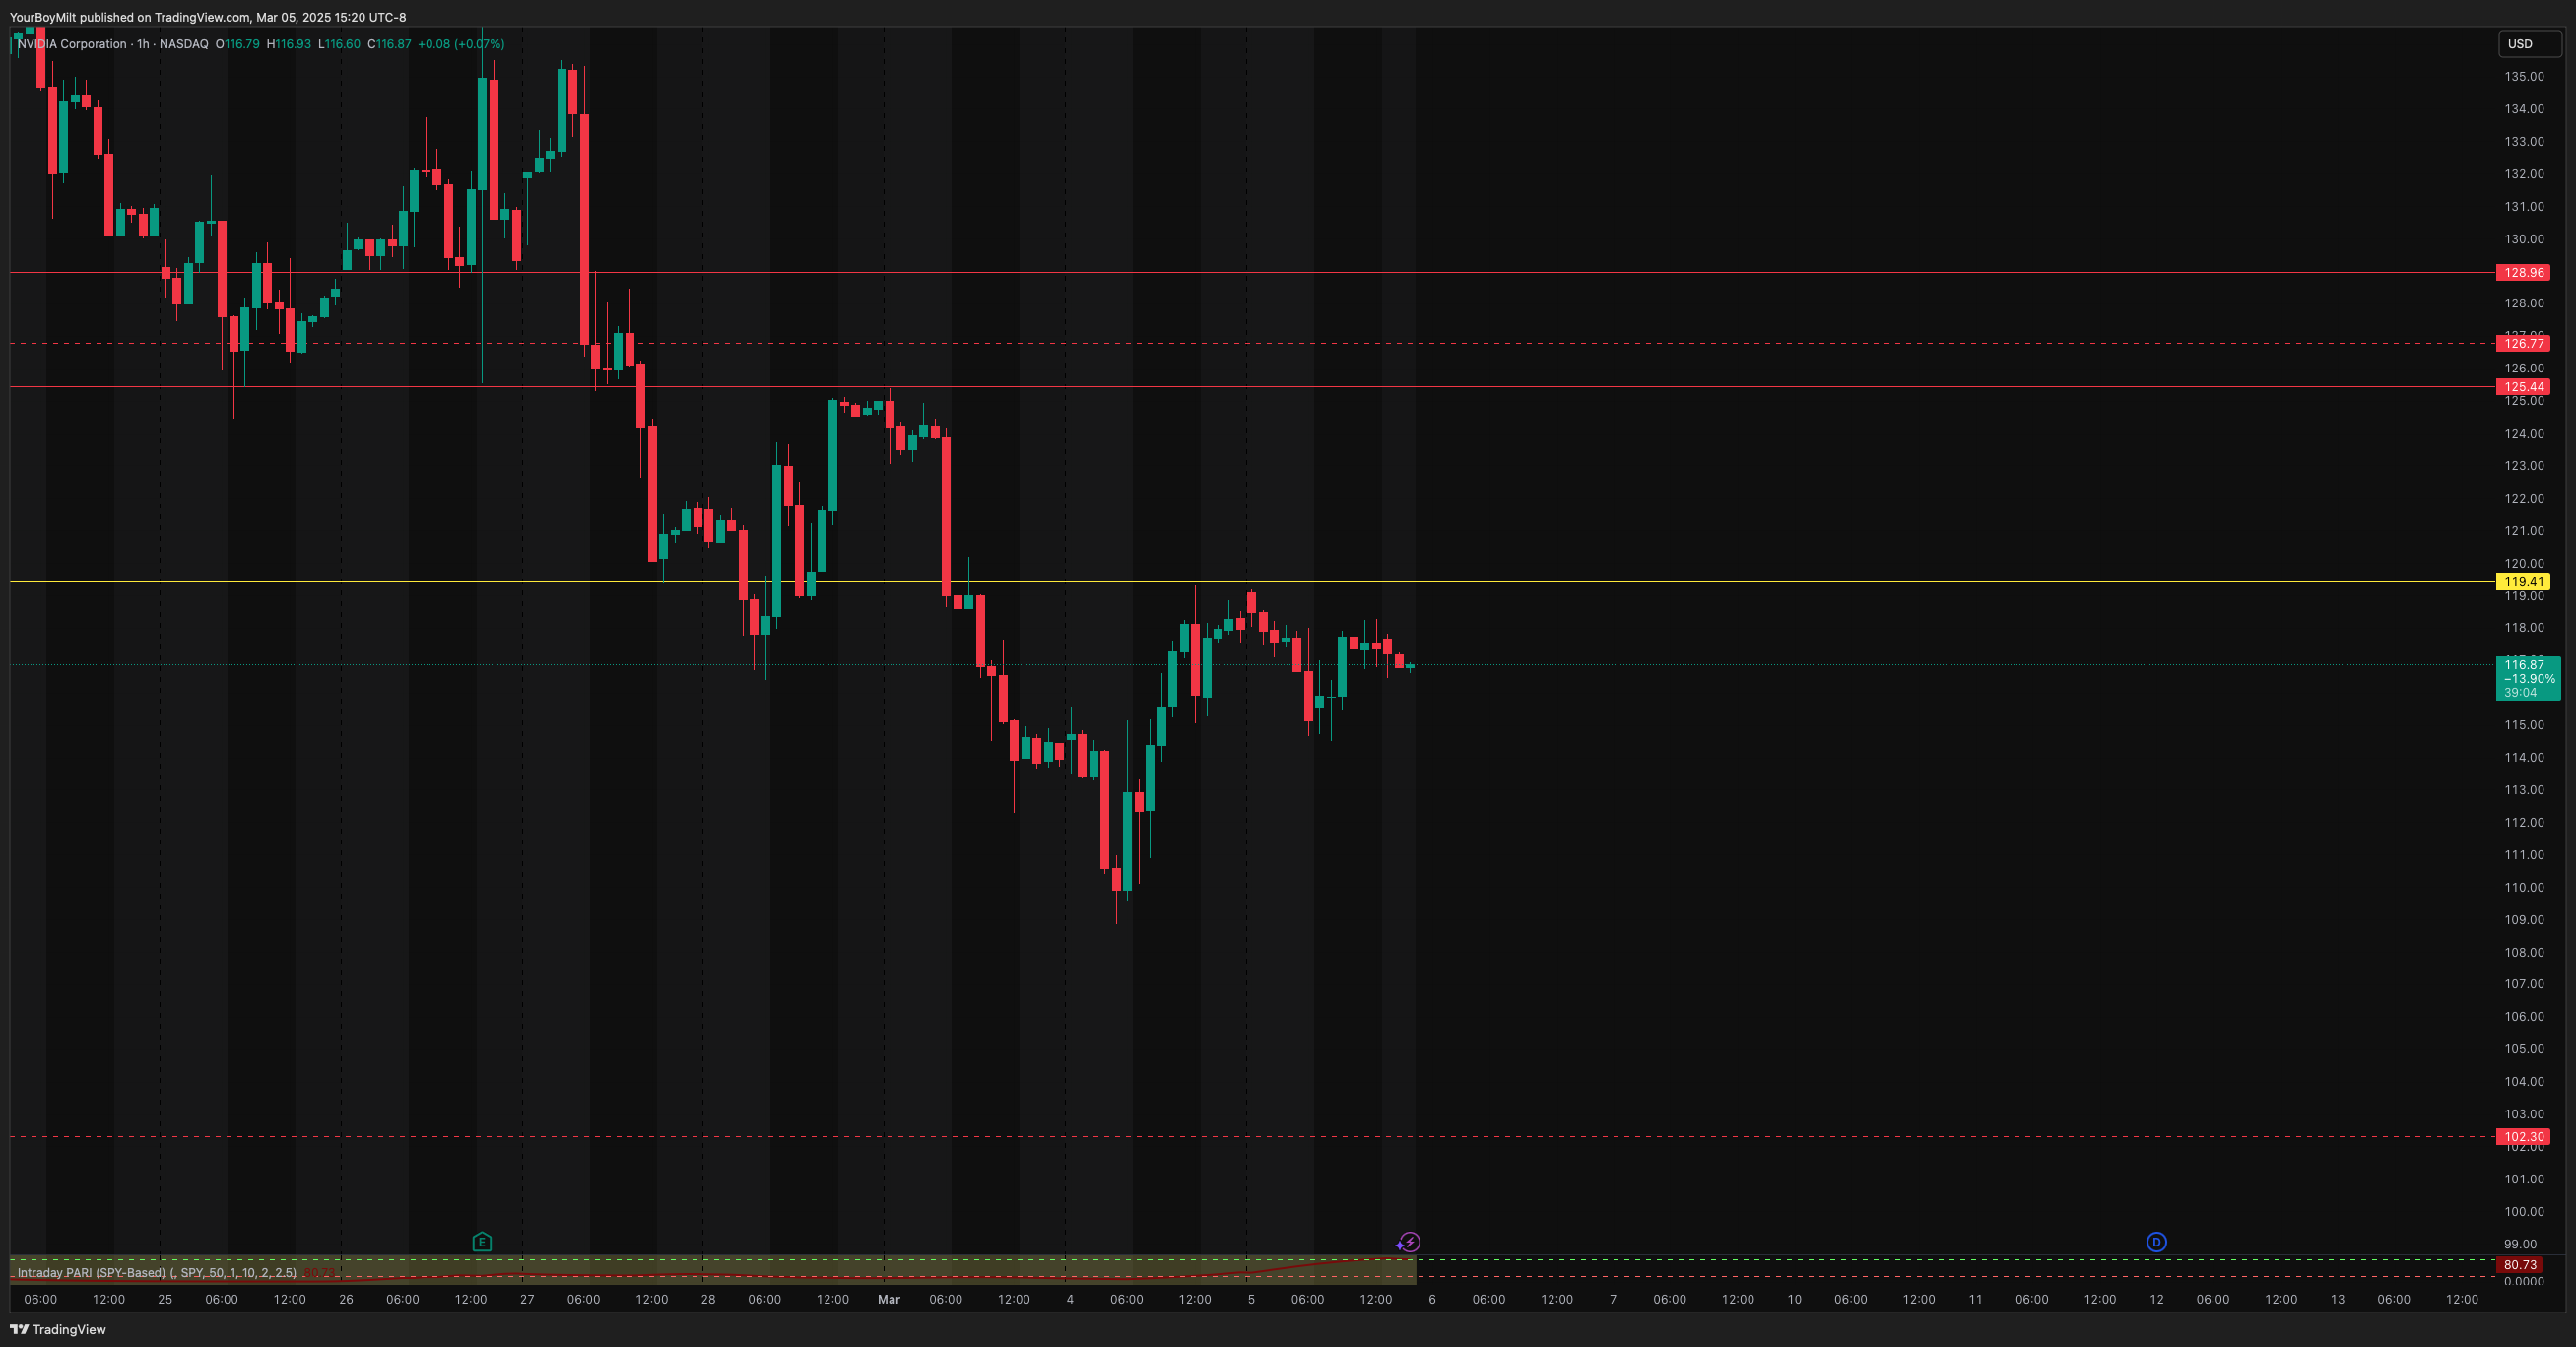
CHART: trigger in yellow, targets in red on the inverse head and should play
YEET Plus Section: New Banger Alert FROM FARCRY