
🥊 Watch for the Hook
SPY Levels, Chart Art, Orange Swan, and MORE!

🥊 YEET: Watch for the Hook
When a big hit lands, it’s important to look at what’s created—not what just exists. The market pumped on the rhetoric, but a massive gap was left behind. We are at a point where the good times might stop rolling.
SPY LEVELS ARE BACK
Respect the tape. Here are your levels above and below current price action (SPY):
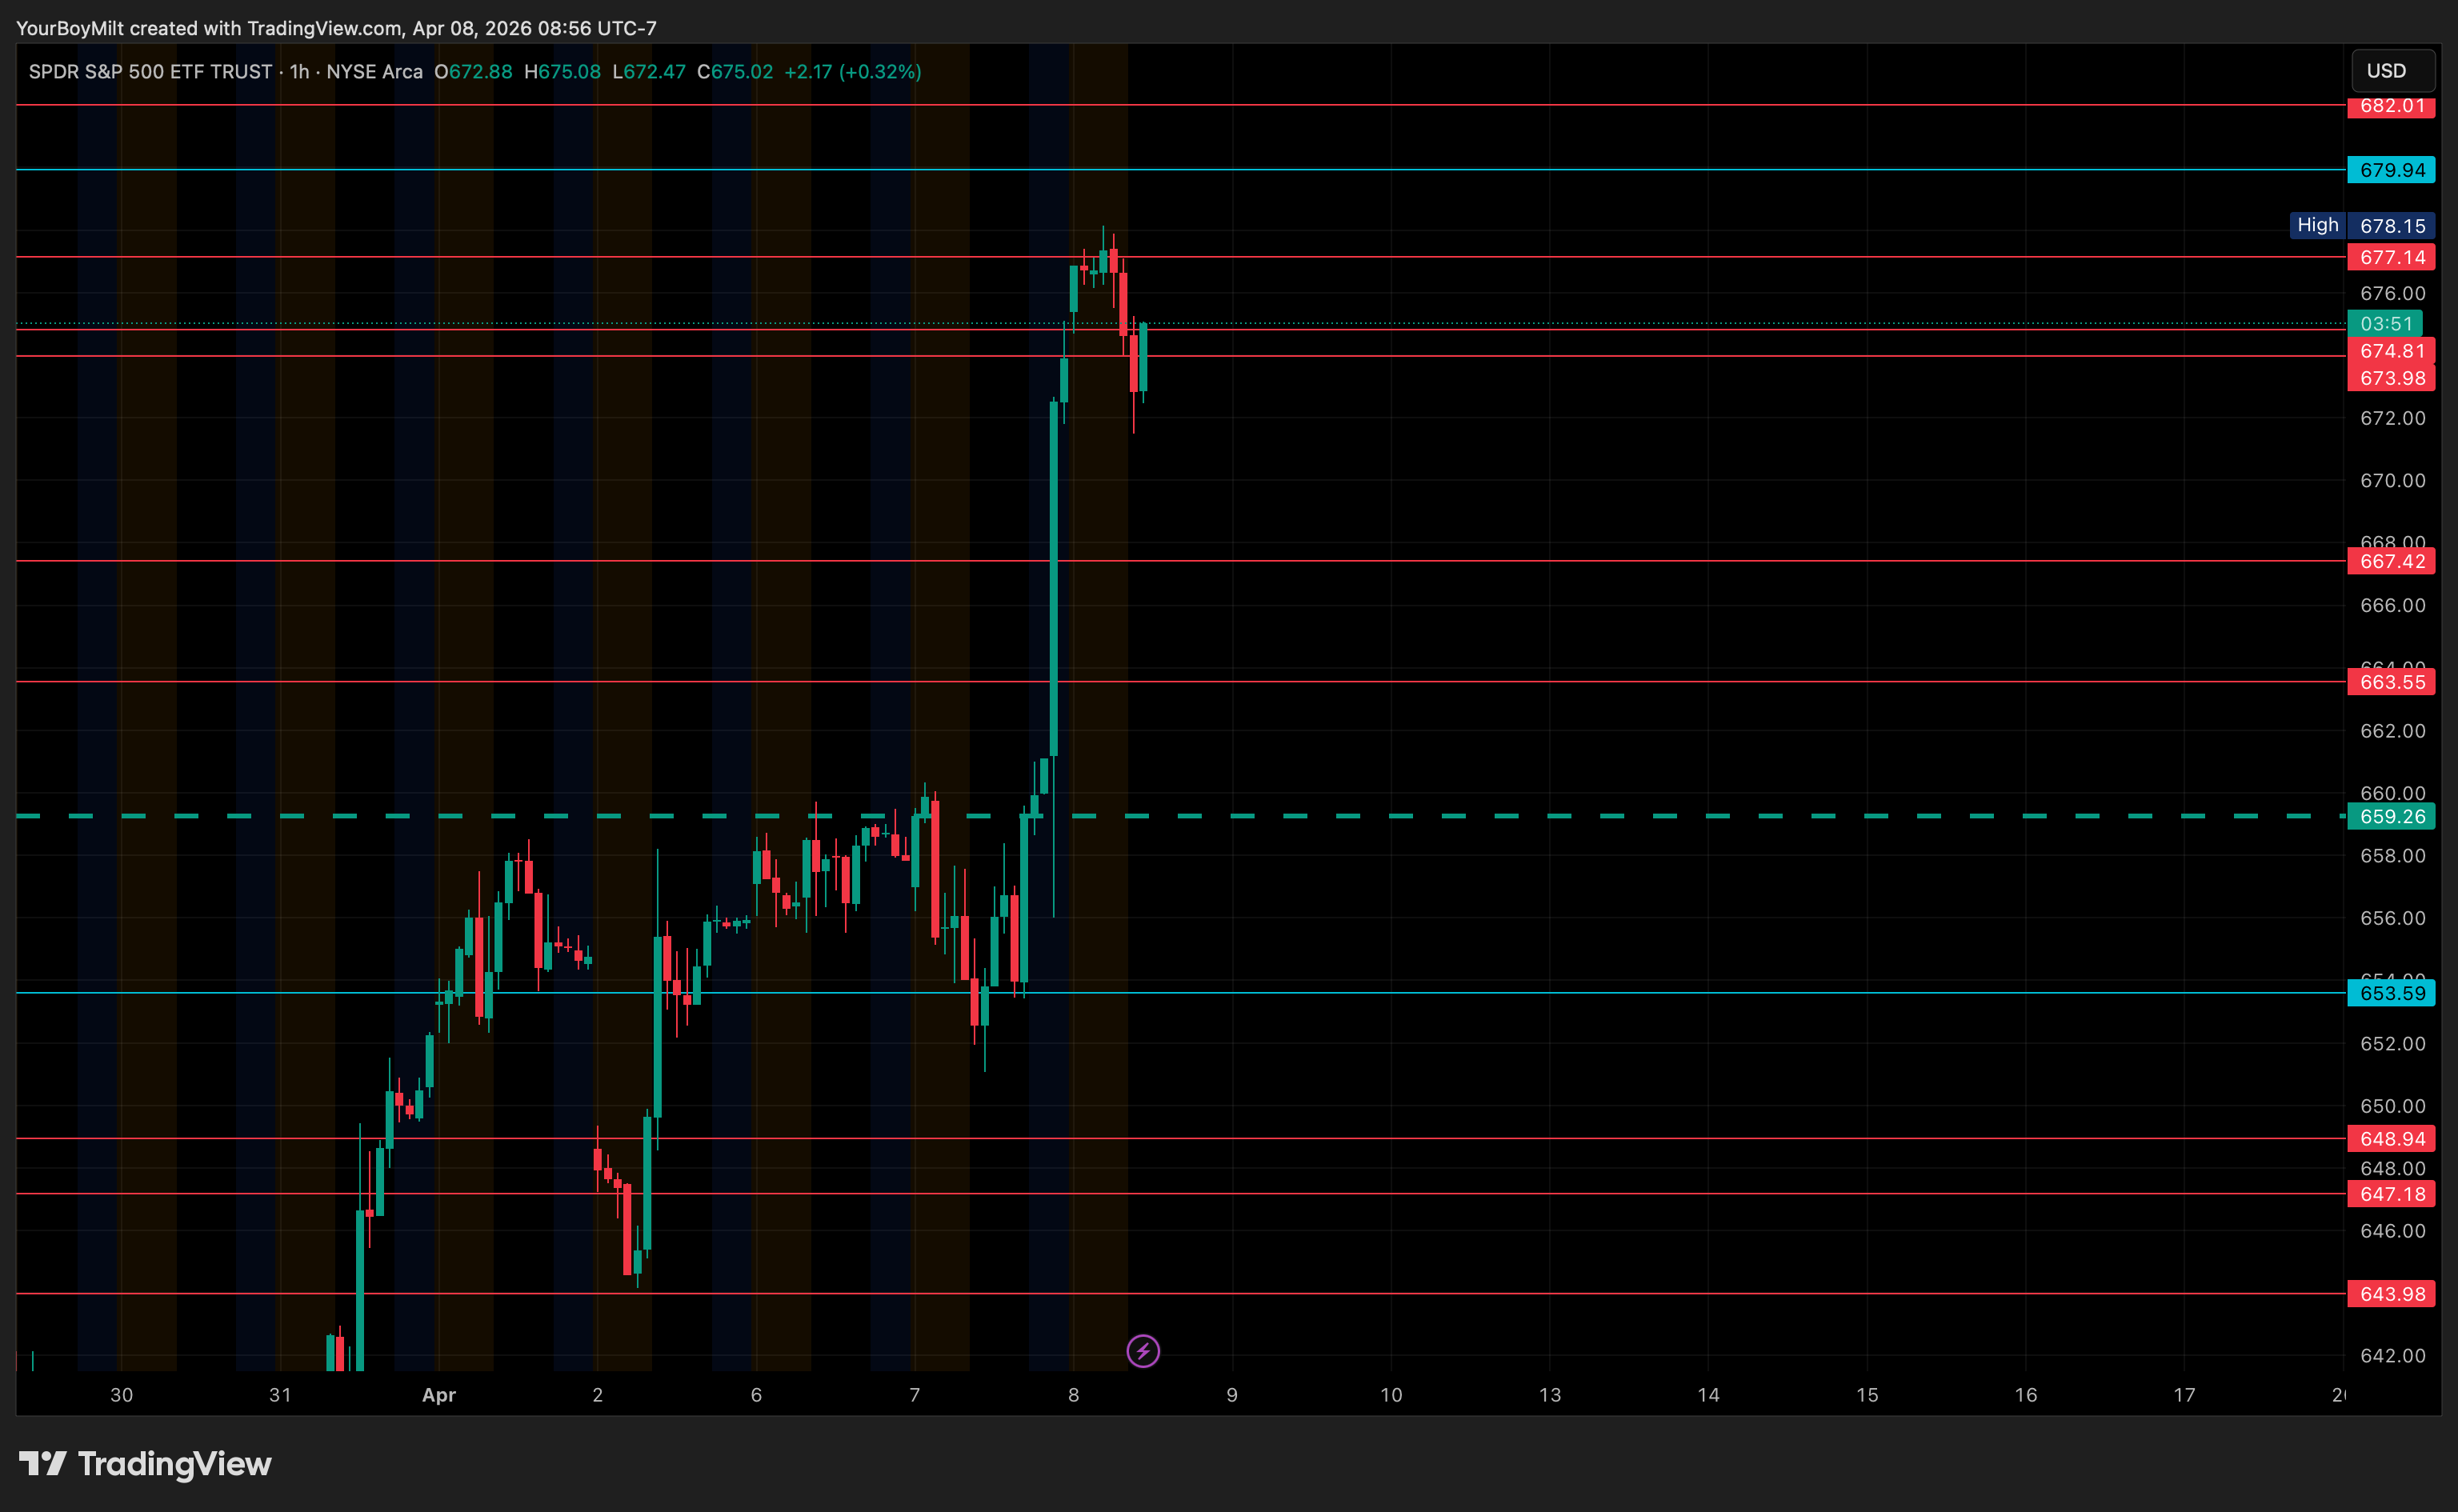
📈 Above Current Price
677.14, 678.15 (High), 679.94, 682.01, 685.72, 686.75, 689.79, 692.00, 695.33, 698.05
📉 Beneath Current Price
674.81, 673.98, 667.42, 663.55, 659.26, 656.00, 653.59, 652.00, 648.94, 647.18, 643.98, 640.00, 636.00, 634.42, 632.00, 629.31, 629.28 (Low), 624.00
The Breakdown: Don’t Get Caught in the Skip-Up
Daily Chart (Image 1): The Gap is a Vacuum

The daily skip-up has created a massive void. Look at the distance between current price and yesterday’s Price Action. That gap ends exactly at our $656 Pressure Point. History shows that gaps like this are created by news, but filled by technical reality. We are looking for price to return to this level to re-verify the move.
Hourly Chart: Velocity vs. Validation On the way up, price teleported. We’ve seen several backtests skipped on the move back to retest the pressure point from above. Because we didn’t build “stairs” on the way up, there’s nothing to catch the fall if the sentiment shifts.

The “Hook” : Identifying the Exhaustion Price action wise, we aren’t looking for a rejection at the blue levels—the Hook happens after the run-up. * The Hook is that rounded top forming at the high

It’s the point where the news run/pop loses its steam and the buyers are finally exhausted.
Once that top rounds out, gravity takes over. The “Hook” sets the trajectory for the slide back down to fill that daily gap and finally re-test the skipped levels.