
👔 YEET 2.4: A Macro YEET
Guest intro from MacroEdge, flows, charts, and Sunday PLUS Edition!

Welcome to The Yeet, a weekly DD where we try to tilt the casino...
Hey! I’m @yourboymilt, and welcome to retail’s Sunday Paper.
I should probably let you know...This is not financial advice! We are here to entertain while giving you ideas, perspective, and angles. Do your own research, I prithee. And if you aren’t subscribed, join us here:
Creator/Editor:@YourBoyMilt // The GodFather: Abu // COOs: Nate Dawg and Cjo // Head of Haters Received: DTJ1948 // Head of Research & Plagiarism: Kenzo08 // Director of Futures Trading & Trickery:
EE’s /ES//Non-SPY Callout Coordinator: Plaggy // Elliot Dark Level Wicks Research: JBtrades // Director of Flow: Ace Ventura // Research Associates:B-Rad, Zik, El Mano Negro, Bean Man, Santo, Avine, Egyptaflip and All Flow Patrol
Pt. 1: Macro Edge piece, Pt. 2: Flow Action Picks, Pt. 3: YEET Plus Sunday Edition Pt. 4: TLDR
🌎 Pt. 1: MACRO-YEET WORLD

Contributor: Don Miami of Macro Edge
📝Milt’s Note: What follows is a piece from our friends at MacroEdge—NOT done in exchange any sort of financial compensation, but because we have long been professional acquaintances, personal friends, and fans of each other’s work. He’ll briefly speak about the nature of his work and our relationship, then dive into THE BEAR PORN!!
I hope you’re all having a great end to the weekend. For introductions - I am Don (@DonMiami3). I am currently the Chief Economist at MacroEdge and we’re thrilled that Milt is providing us with another platform to share our data. You will start seeing me once every few weeks or so for short weekly data updates with data from our MacroEdge data dashboard.
As part of what we’ve put together to make our economic research, news, data, and portal available to YEET members, we created a special discount link for you all to register with us directly through Substack, and you will have MacroEdge sign-in within 24 hours of registering.
We’re closing out Sunday on an absolutely beautiful day here - enjoying the view from my office and got some important data to talk about for the week(s) and months ahead. I spoke on the ‘MF’ = multi-family situation in our Friday evening Redeye piece with John and Awsumb (that can be found here:

As we wait for the team on the backend to continue to develop out Ozone V2 for everyone - we will now begin posting all weekly reports to our Substack as well (in addition to to the client portal and your emails). This means you will be able to access the weekly report from your Substack application until our own native mobile interface is complete, where you will able to access weekly reports within the Ozone Engine. Monthly labor market reports will begin for March data (so they will be available in April).
Here’s a sneak peak at the updated Ozone Dashboard:

Now I want to turn our attention back to the unemployment data and where things are likely to finish off the quarter at (today marks 5 quarters from the inversion of the 10 year-3 month curve that inverted for its first full-month back in November). With unemployment rising in several states - I would be surprised to not see a tick-up in unemployment for February. Unemployment is noticeably rising in California, Montana, New York) and elsewhere which should contribute to this tick-up. The only thing preventing this would be a roll-over of unemployment in those states, but we’re seeing sustained job cuts as well as an elevated continuing claims level from our Index=100.
Current job cuts stand at nearly 50,000 for the month, which is a decrease on a year-over-year basis when comparing MacroEdge data to Challenger’s, but we’re still holding onto our 62,500 estimate for the month. For March, we anticipate that we see in increase in job cuts (@J77324 - our WARN tracker) has done a great job explaining why this is in many of his threads on X. We’re also pleased to have another job cut data expert onboard with Ray, who is a software engineer by day. This will expand the scope of our data sources.
Our current February job cuts figure:

Unemployment by quarters from inversion remains very low:

In fact - it’s the lowest of any cycle since 1969, following the 10y3m inversion (on a quarterly basis). It will be interesting to see where it ends in February which may adjust the index slightly higher (or lower depending on the final February U3 number). Another key element to tracking the labor data ahead will be watching the construction employment headline figures on both the national and state level data. As construction becomes less of a headwind for future growth and active construction begins to contract - I am expecting that we will see an eventual contraction start in the total # of active construction workers - especially on the residential side of things. (See Redeye on this for more). Other sectors like technology remain very weak and have contracted sharply in states like California, and temporary helps, HR services, and trucking continue to see weakness. All of these elements are included in our cyclical leading employment index. While any sign of a slowdown remains slow-moving and dynamic - I still think it is quarters (and even a year) to early to declare this a 1994/95 repeat. The risk this time around across the board are much higher and this cycle is beginning to shape up much more like the years leading up to late 07/08. The land of debt’s economic engine simply can’t survive with sustained rates at 525-550bps, even with a $3+ trn deficit, based on the facts.

At our current rate of spending, we will roughly double the national debt over the next decade. With the economic cycle that I anticipate will begin to impact the economy - this could be magnitudes higher as each cycle takes more and more debt to keep things afloat in our current ‘grand ponzi scheme’. Demographics is something that I have yet to do a deep dive in and I owe you all an extensive deep-dive into America’s evolution into some hybrid between Japan and South Africa on demographics - but this is something that I will start working on this week for release in a week or two.
I’ll let the others take it away from here. Have a great evening.
Your friend Don
🌊 Pt. 2: Flow Action Section: Abu’s Charts of the Week with Milt’s Flow to Match!
Made possible with help from the @unusualwhales Alerts and Flow Tool.Sign up here!
🚨 If you’re following Milt—you need to be following his mentor ABU!
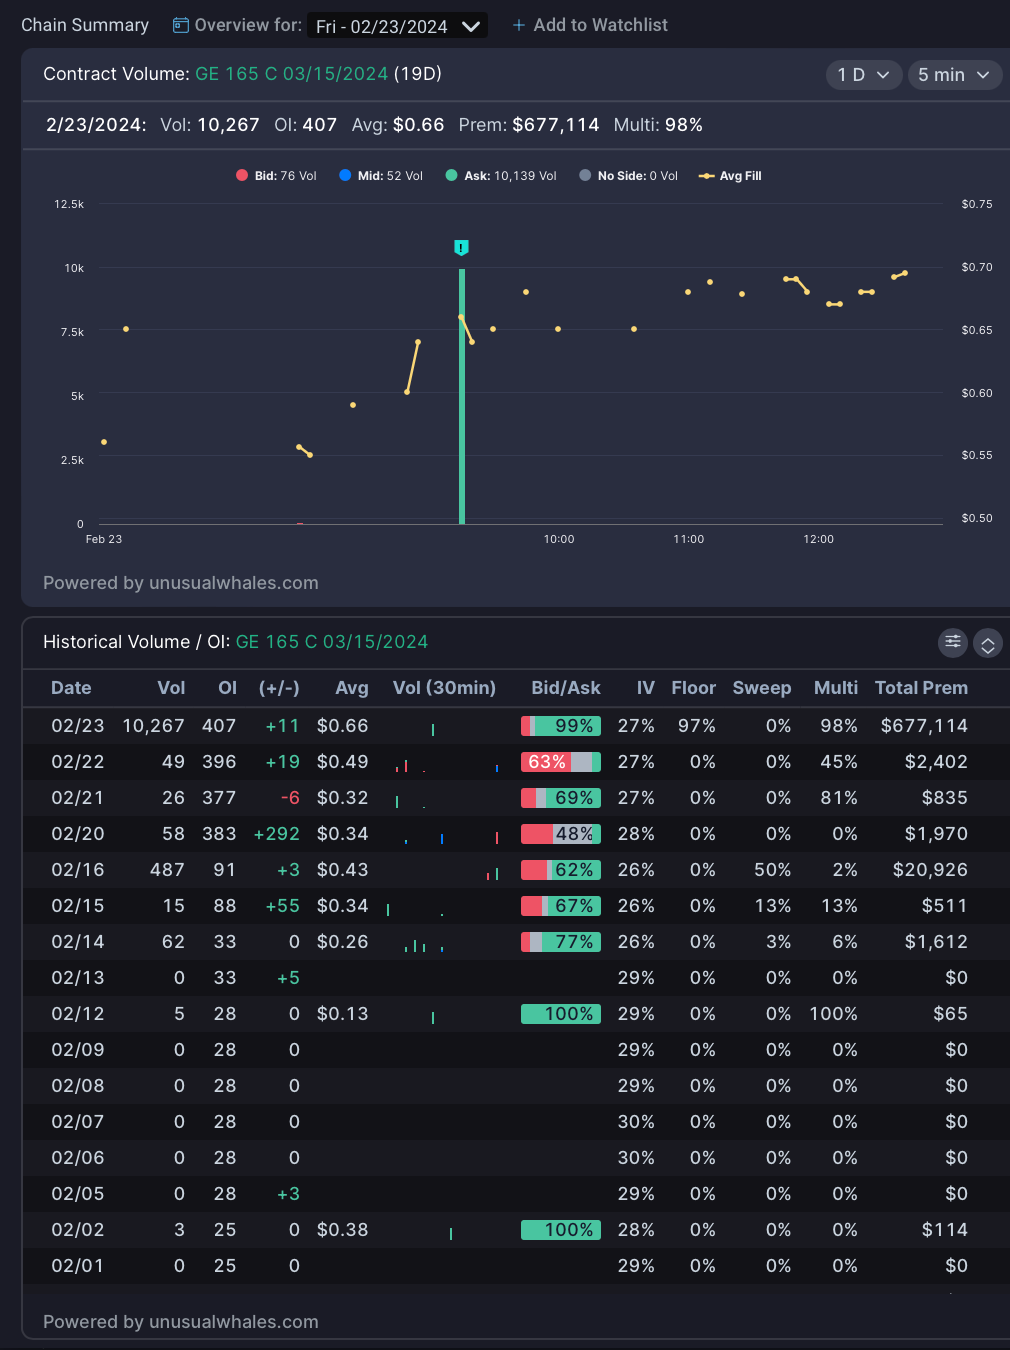
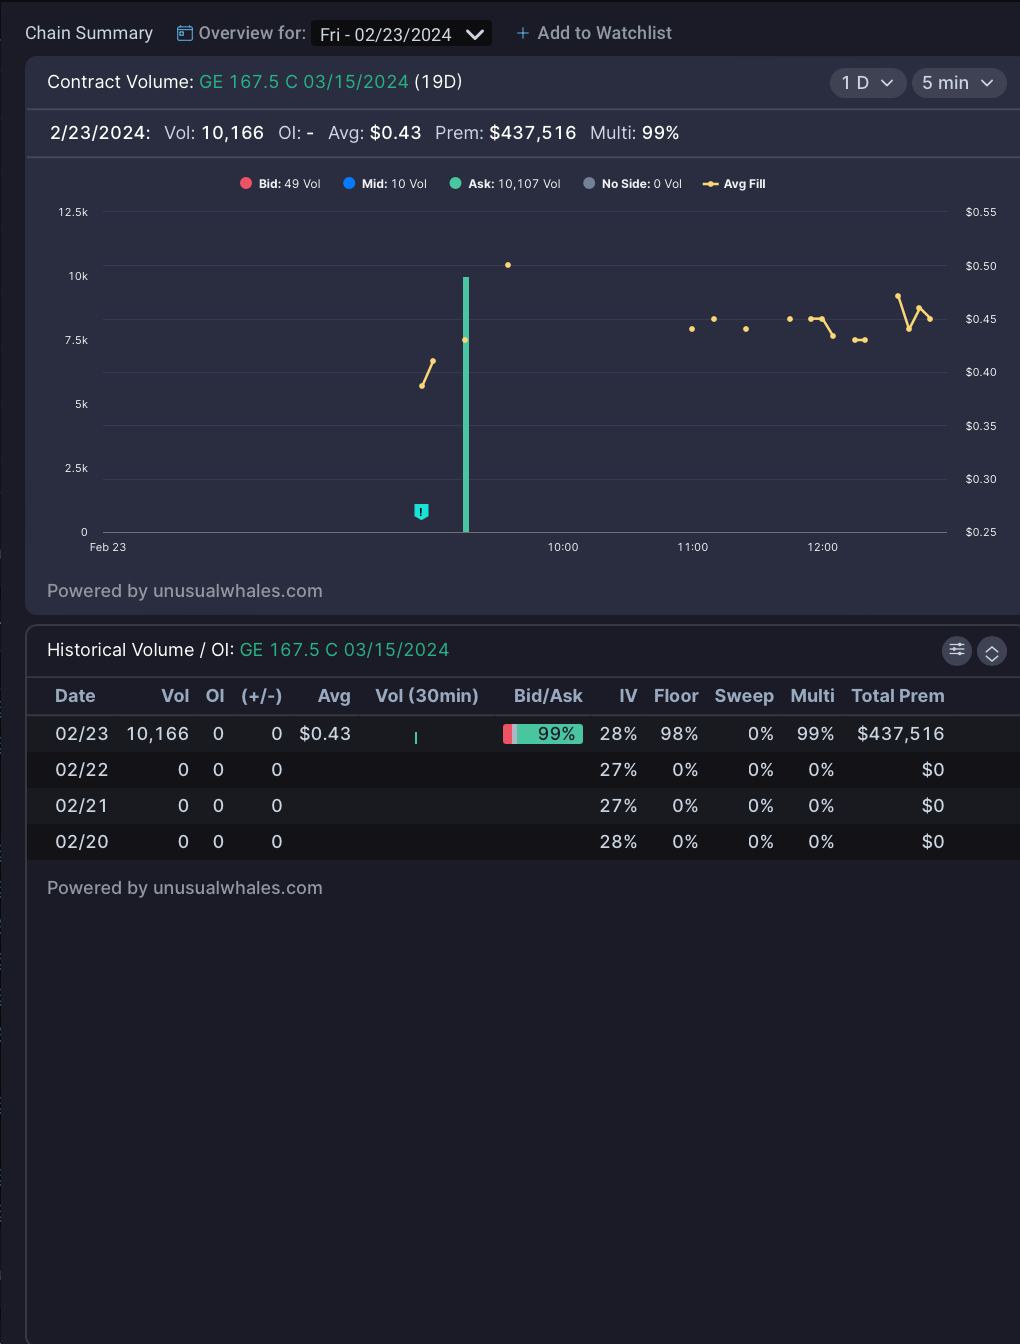
💡 1.GE 160c / 165c / 167.5c 3/15 // Millions in premium on 2/23
This thing has been quietly on a rocket, but the more we see the more we like. Abu forwarded me the chart, and I must say, the flow looks great, too!
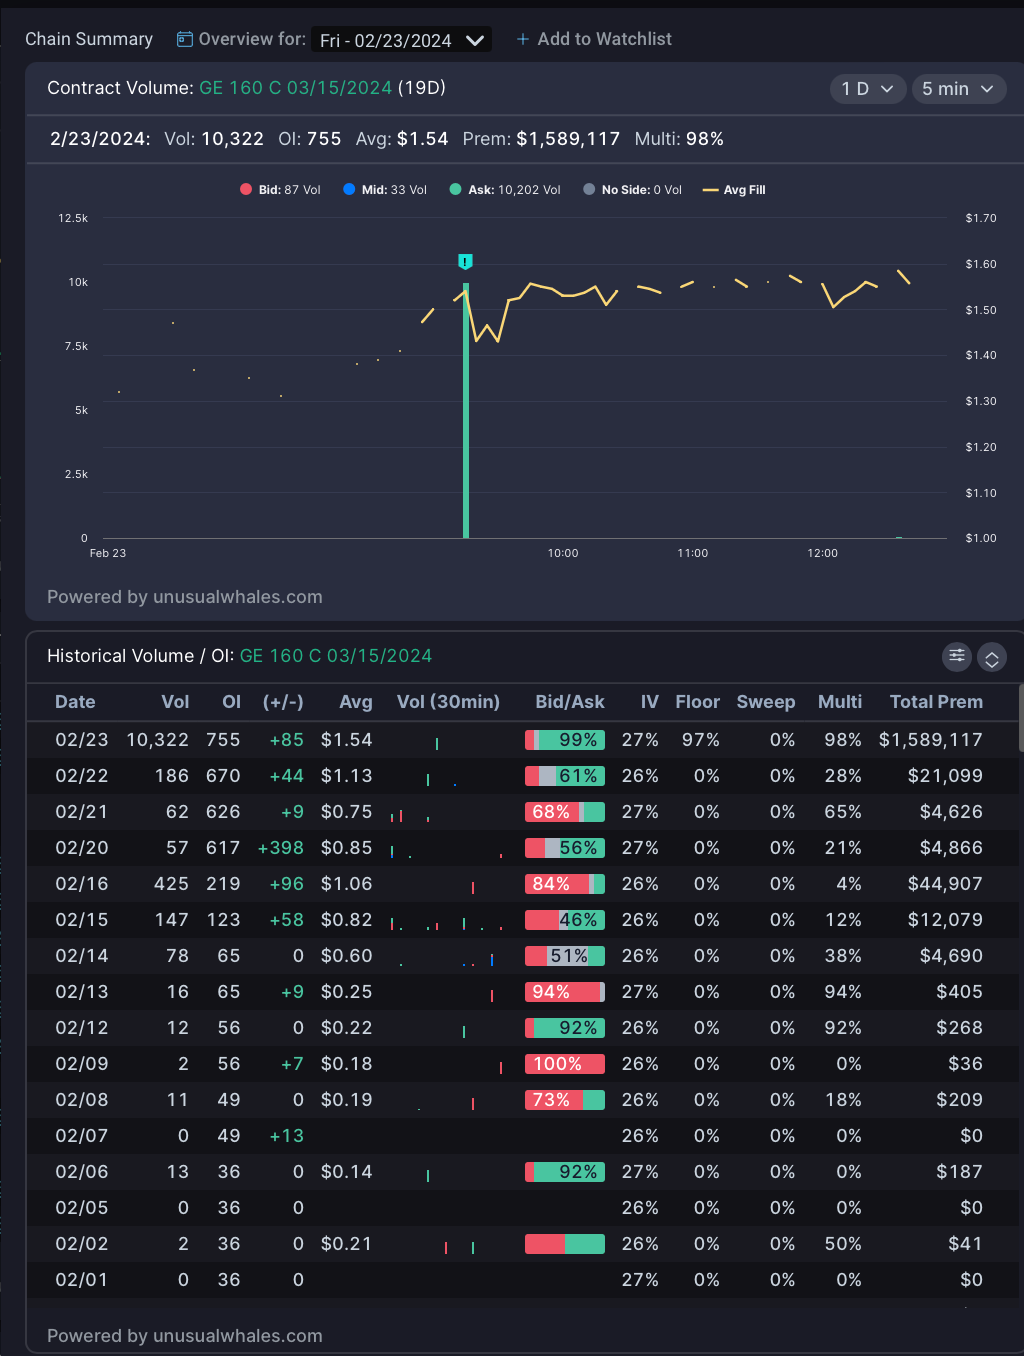
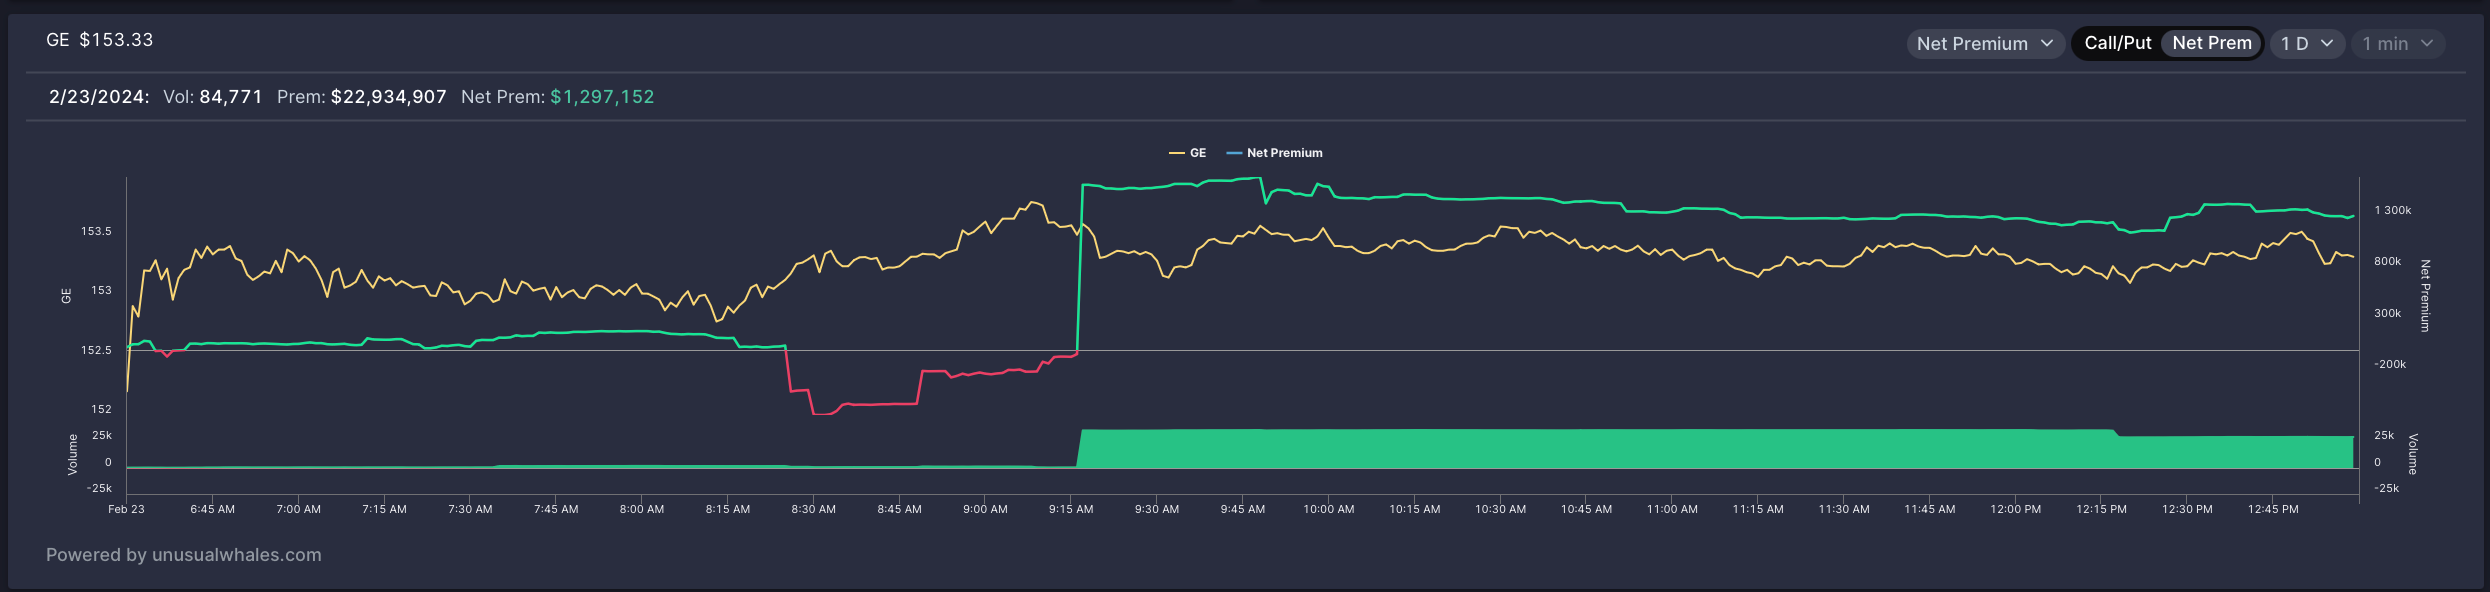
📈GE Chart and Entries:
After breaking the relatively steep shorter term uptrend, a test of some lower levels could be in order if we get what I think will be a little pullback on SPY 0.00%↑ to start the week. 152.27 and 150.34 are your optimal entries should we see downside.
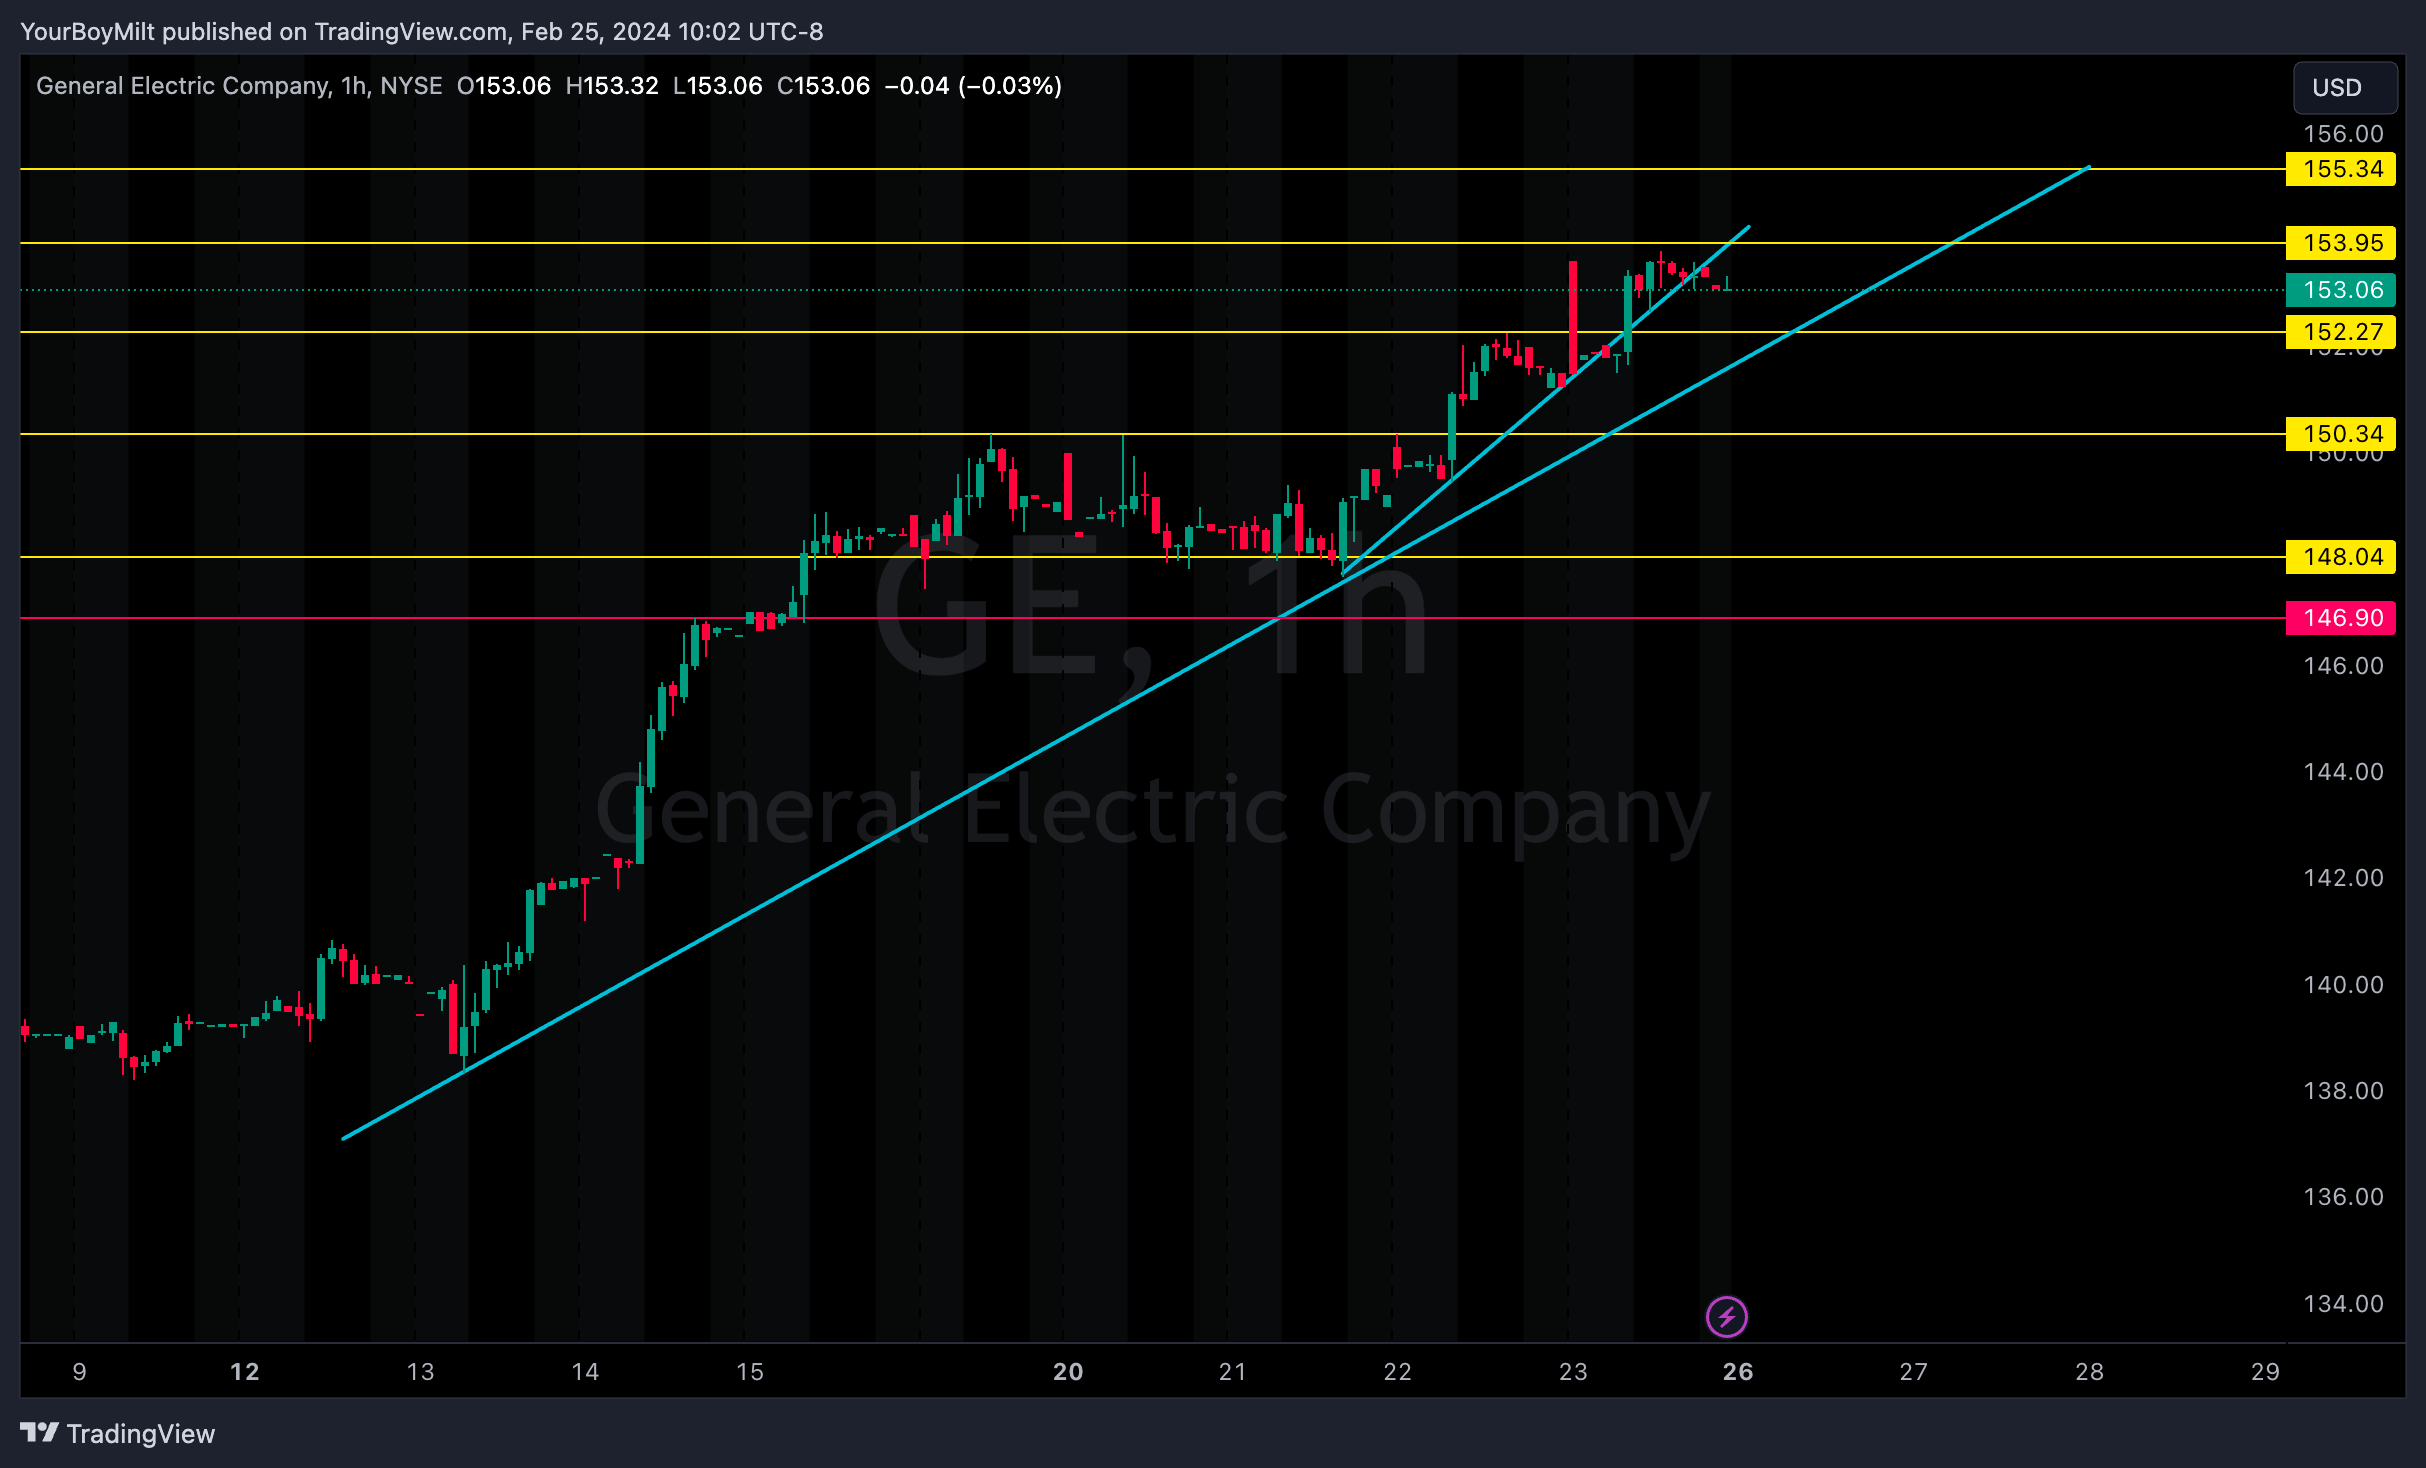
🚀YEET Prime Entry: 152.27 (fine), 150.34 (optimal)
👍YEET Official Call™: 160c 3/15
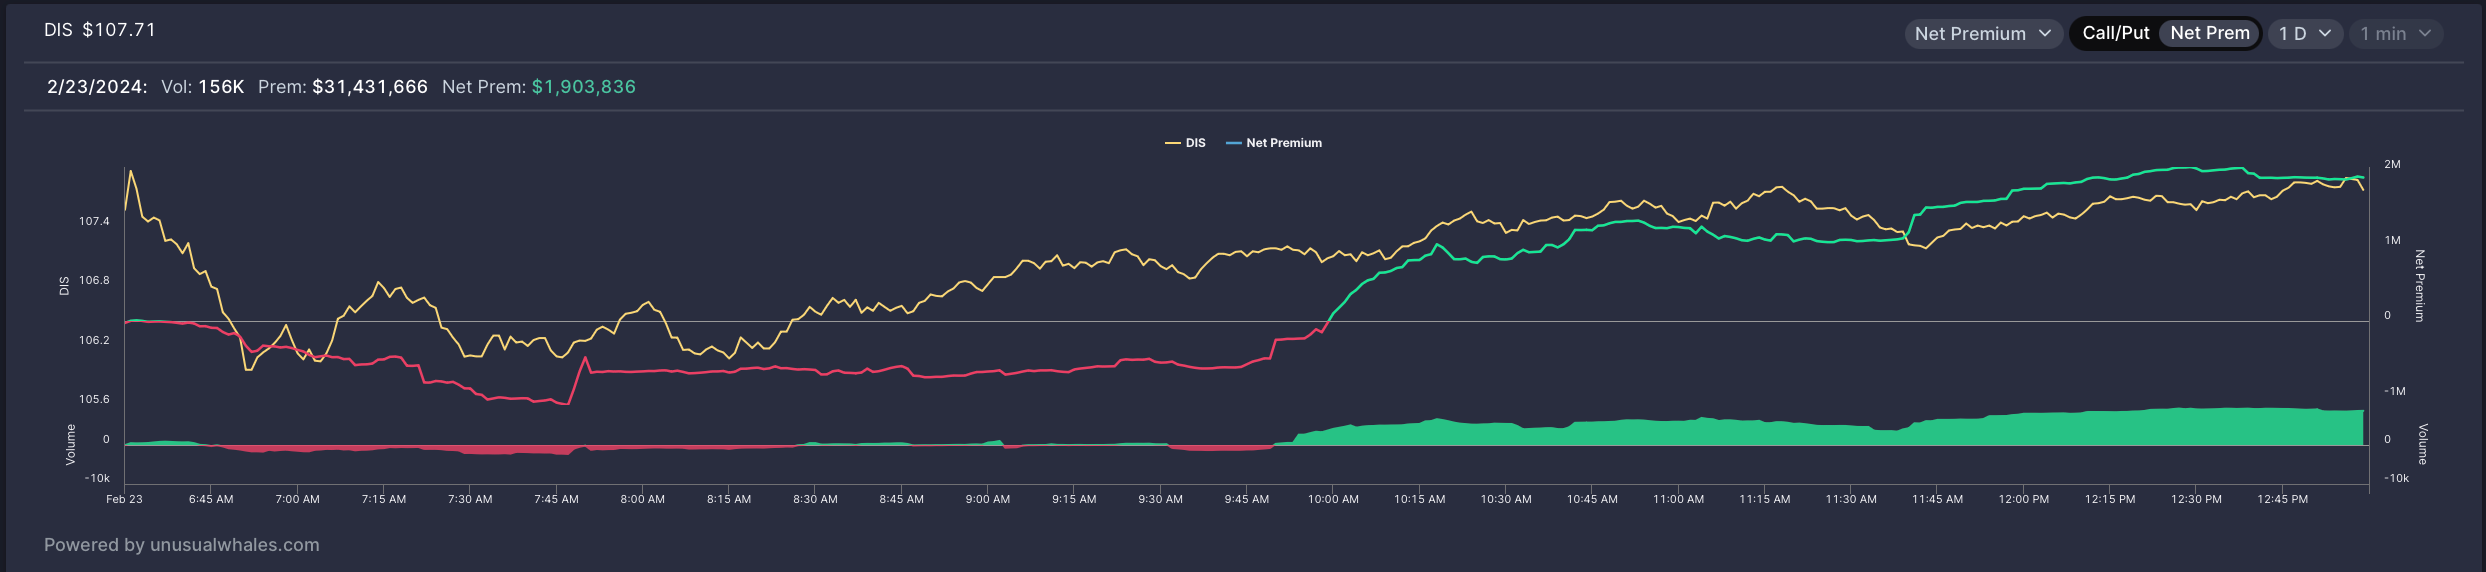
🐭 2. DIS: Bullish Price Action Chart That Can Be Played Both Ways In Case of Downside
DIS Chart is interesting here because you can view it as ultimately bullish, but with a lot to gain to the downside should we have a pullback.
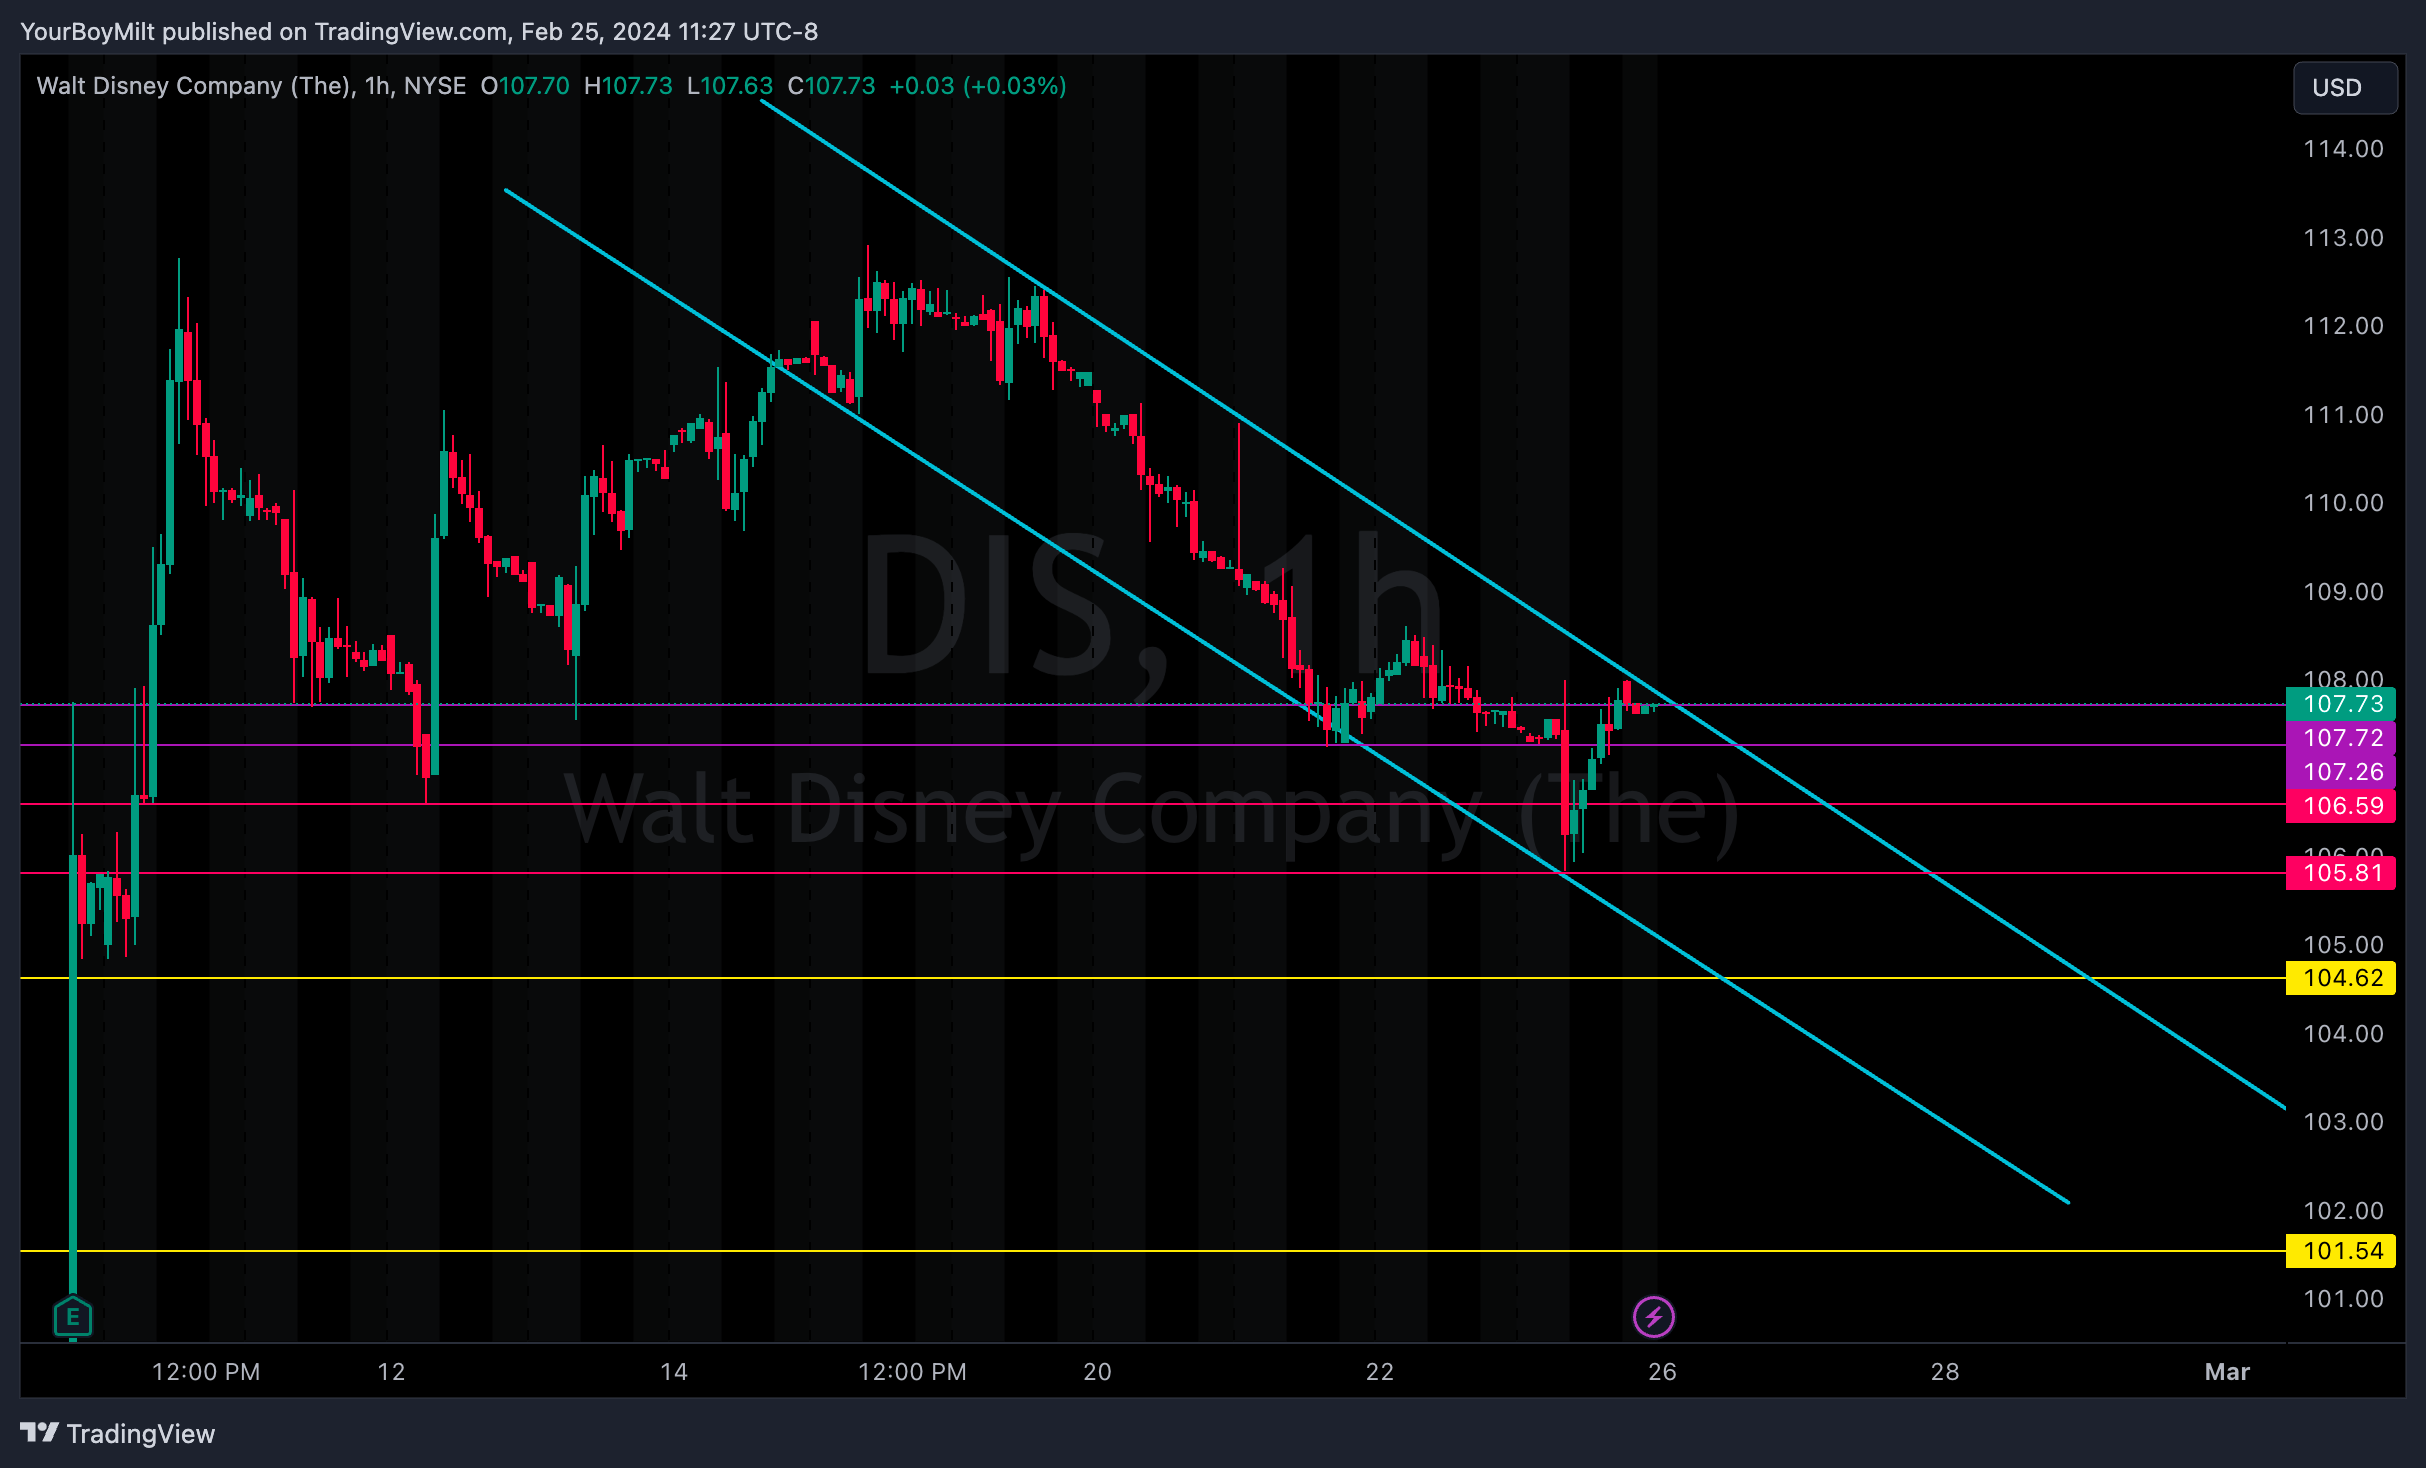

Ultimately, this chart is bullish as long as it can manage to reclaim (with, say, a 2 hour candle) above 108.
🚀YEET Prime Entry: 106.6 (fine), 105.81 (optimal)
👍YEET Official Call™: 110c 3/15
🗞️ Part 3: YEET PLUS Sunday Edition
For Prime Subscribers (or whatever it’s called I still don’t know):
👀The Big 3: SPY, NVDA, and TSLA levels, chart analysis, and flow analysis
⭐️Updates on Signature Trades Flow and Charts: BA, JD, CHKP
🚀Notable YOLO of The Day (OTM Weekly Unusual Whales Contract We Like)