
⚡️ YEET DD 11/20/25: Volatility Inc
What makes price action go crazy--and how to play it.

⚡️ YEET DD 11/20/25: Volatility Inc

🎬 Volatility explained through simple Price Action
SPY LEVELS
Key: 🔴 Monthly ⚪ Weekly 🟡 Homemade 🔵 Gap
Levels Above (ascending)
657.29 657.89 658.38 658.87 659.30 659.71 660.73 661.25 661.90 662.13
662.17 662.27 663.27 664.19 664.54 665.37 665.77 666.37 668.74
669.19 670.50 671.90 674.49 675.64 676.04 679.33
Levels Below (descending)
653.17 652.84 652.33 651.91 651.07 650.88 650.38 649.92 649.62
648.42 647.77 647.08 646.94 646.59 646.19 646.10 645.72 645.54
645.29 644.94
📈 SPY ANALYSIS – Volatility Inc.
🔥 Why Volatility Explodes
Volatility increases when the market skips several price levels in a single move. Each skipped level becomes unfinished business. These untested areas behave like magnets 🧲 that pull price back even if momentum is strong.
📊 The Skipped Level Chain Reaction
When ES or SPY skip levels in clusters, a predictable pattern follows:

A large candle pushes through several levels
The trend appears stronger than it really is
Price returns to test the skipped levels
The return move creates another outsized candle
This is why volatile markets feel like they whip back and forth. The structure underneath the chart is uneven and the market is trying to balance itself ⚖️.
💥 Flow as Confirmation
Options flow during high volatility reflects traders reacting to the structural imbalance. You often see
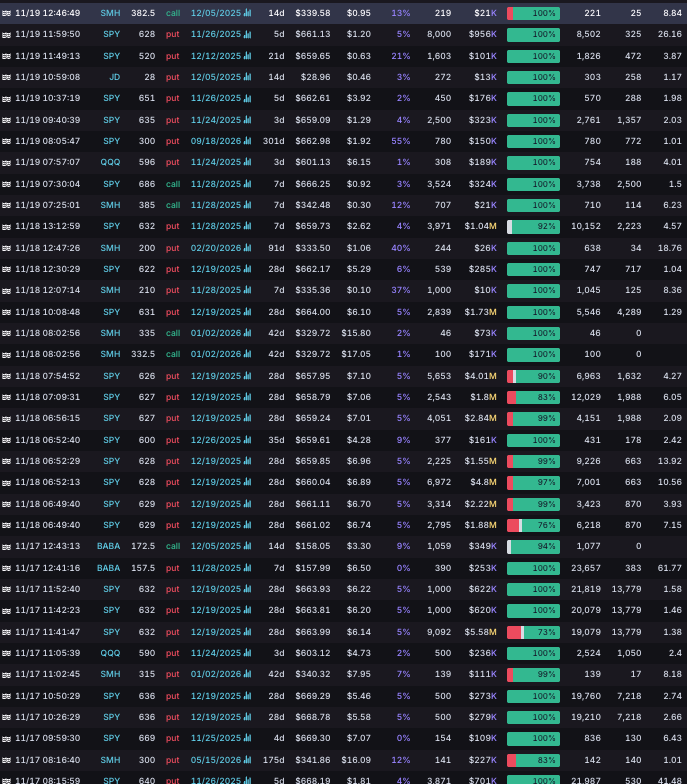
Big prints after oversized candles
Flow leaning toward the idea of forced retests
Volume spikes that enhance each swing 🔊
Flow combined with skipped levels gives a reliable sense of whether volatility is likely to continue.
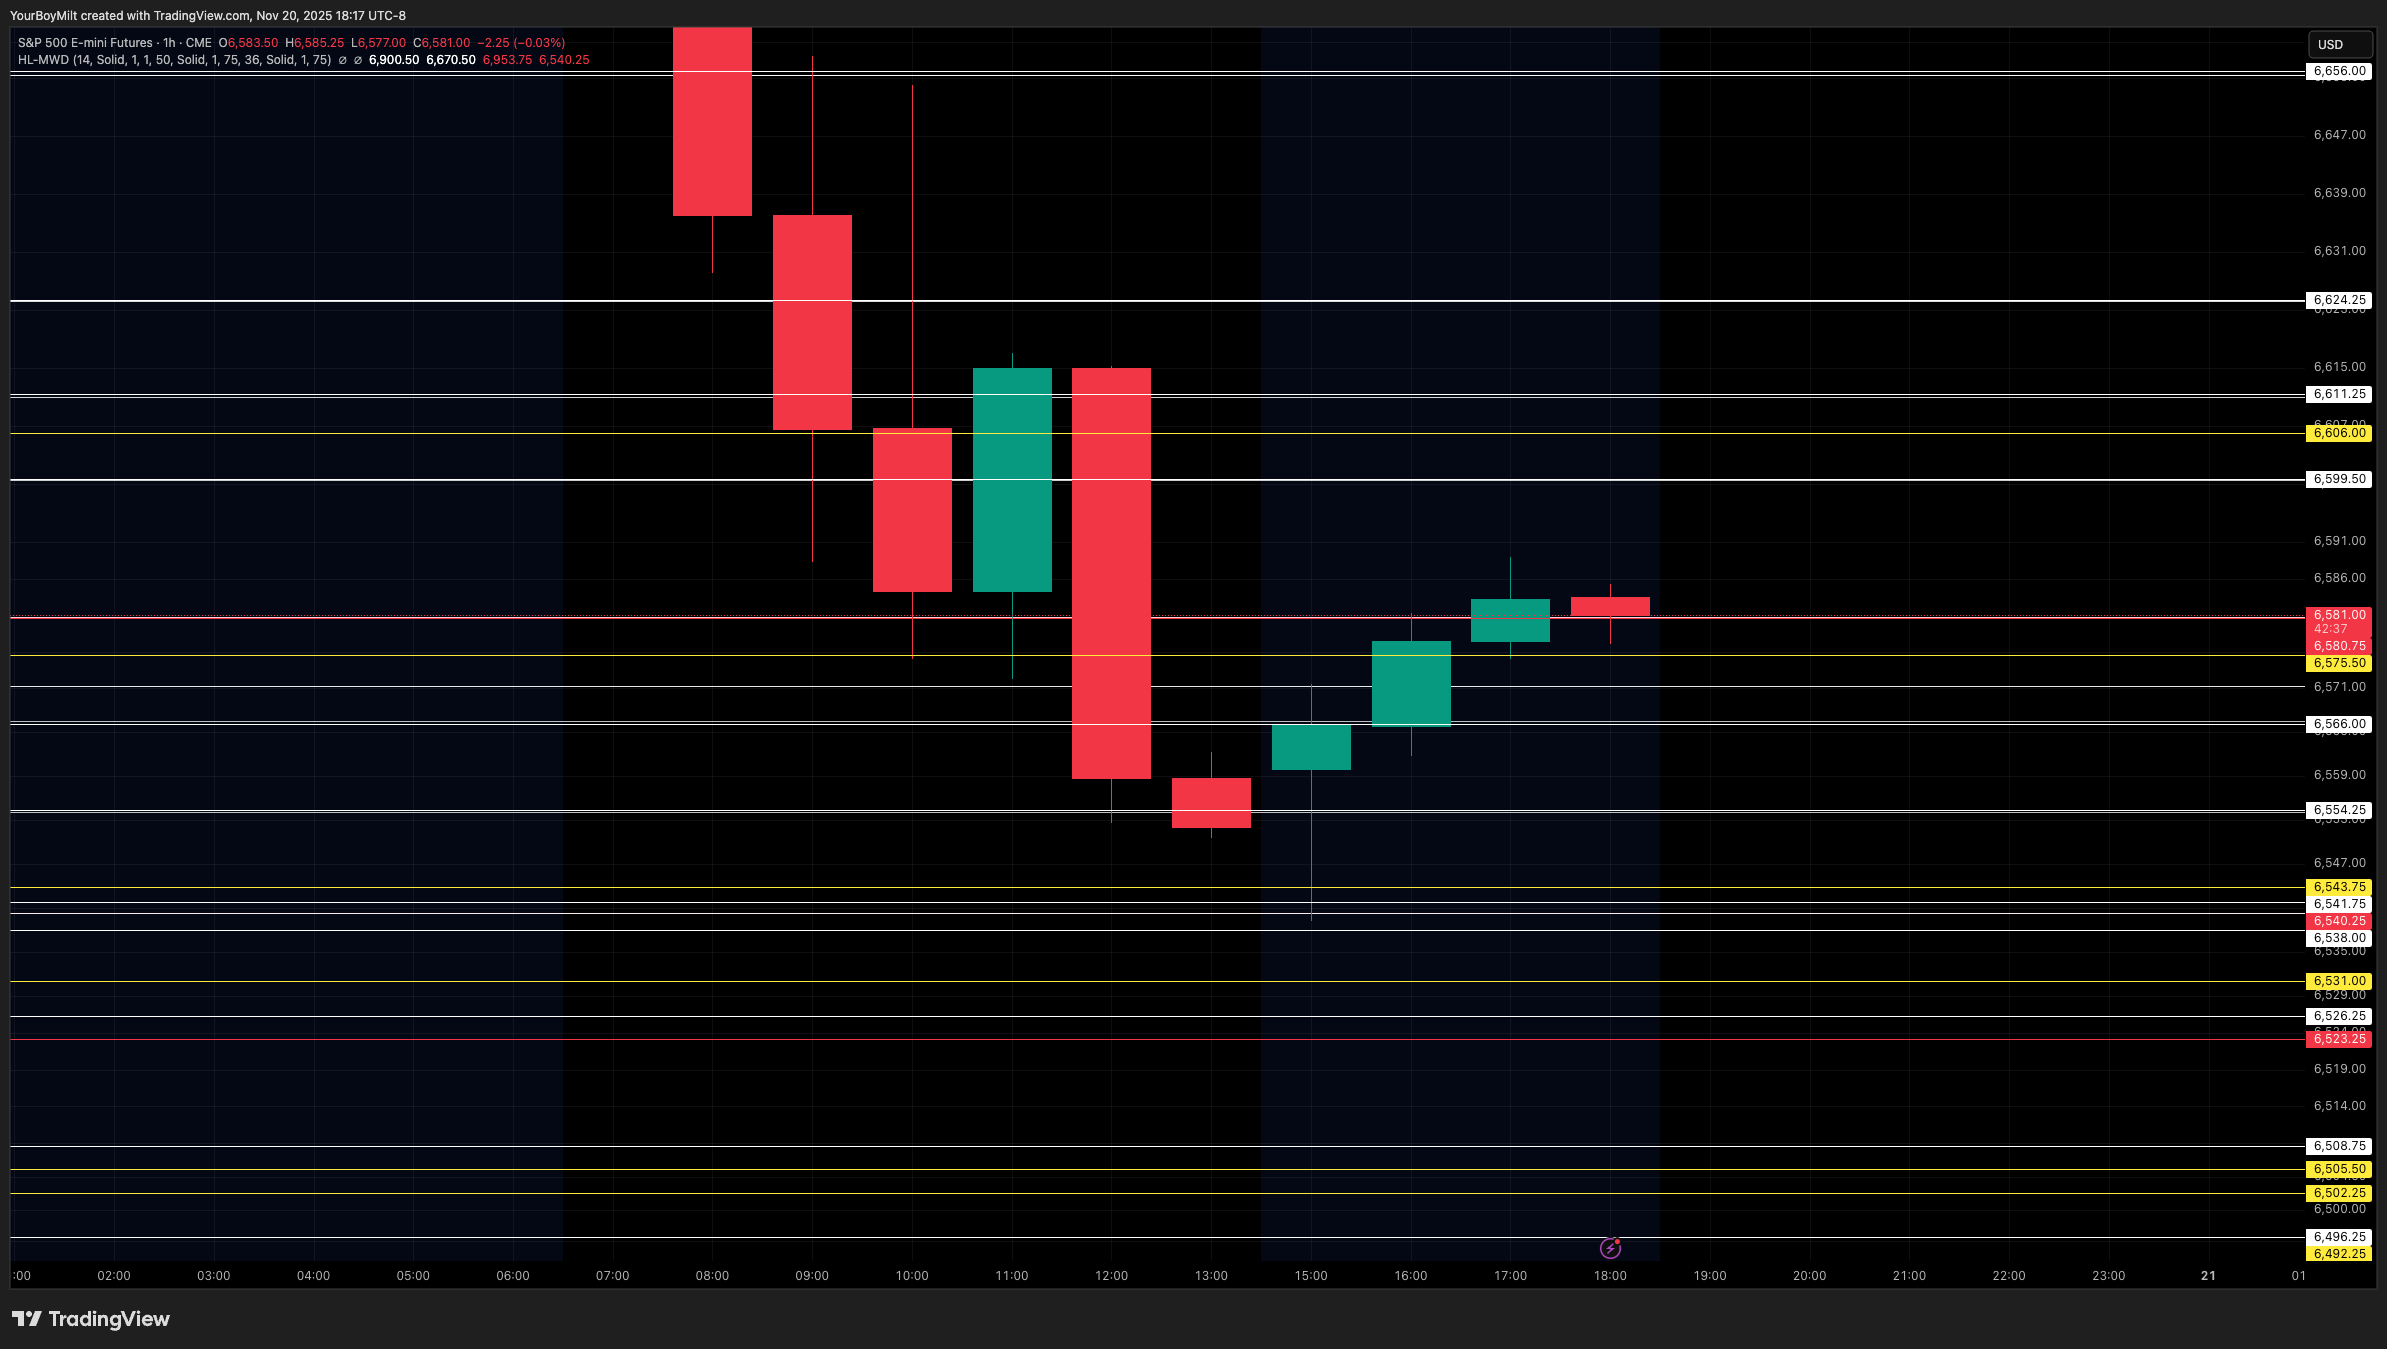
🔁 The Volatility Cycle
A monthly level gets cleared without testing. Price snaps back to touch it. Price then bursts toward the next skipped area. Price snaps back again.This creates a recognizable loop:
🚀 Overshoot
↩️ Retest
🚀 Overshoot
↩️ Retest
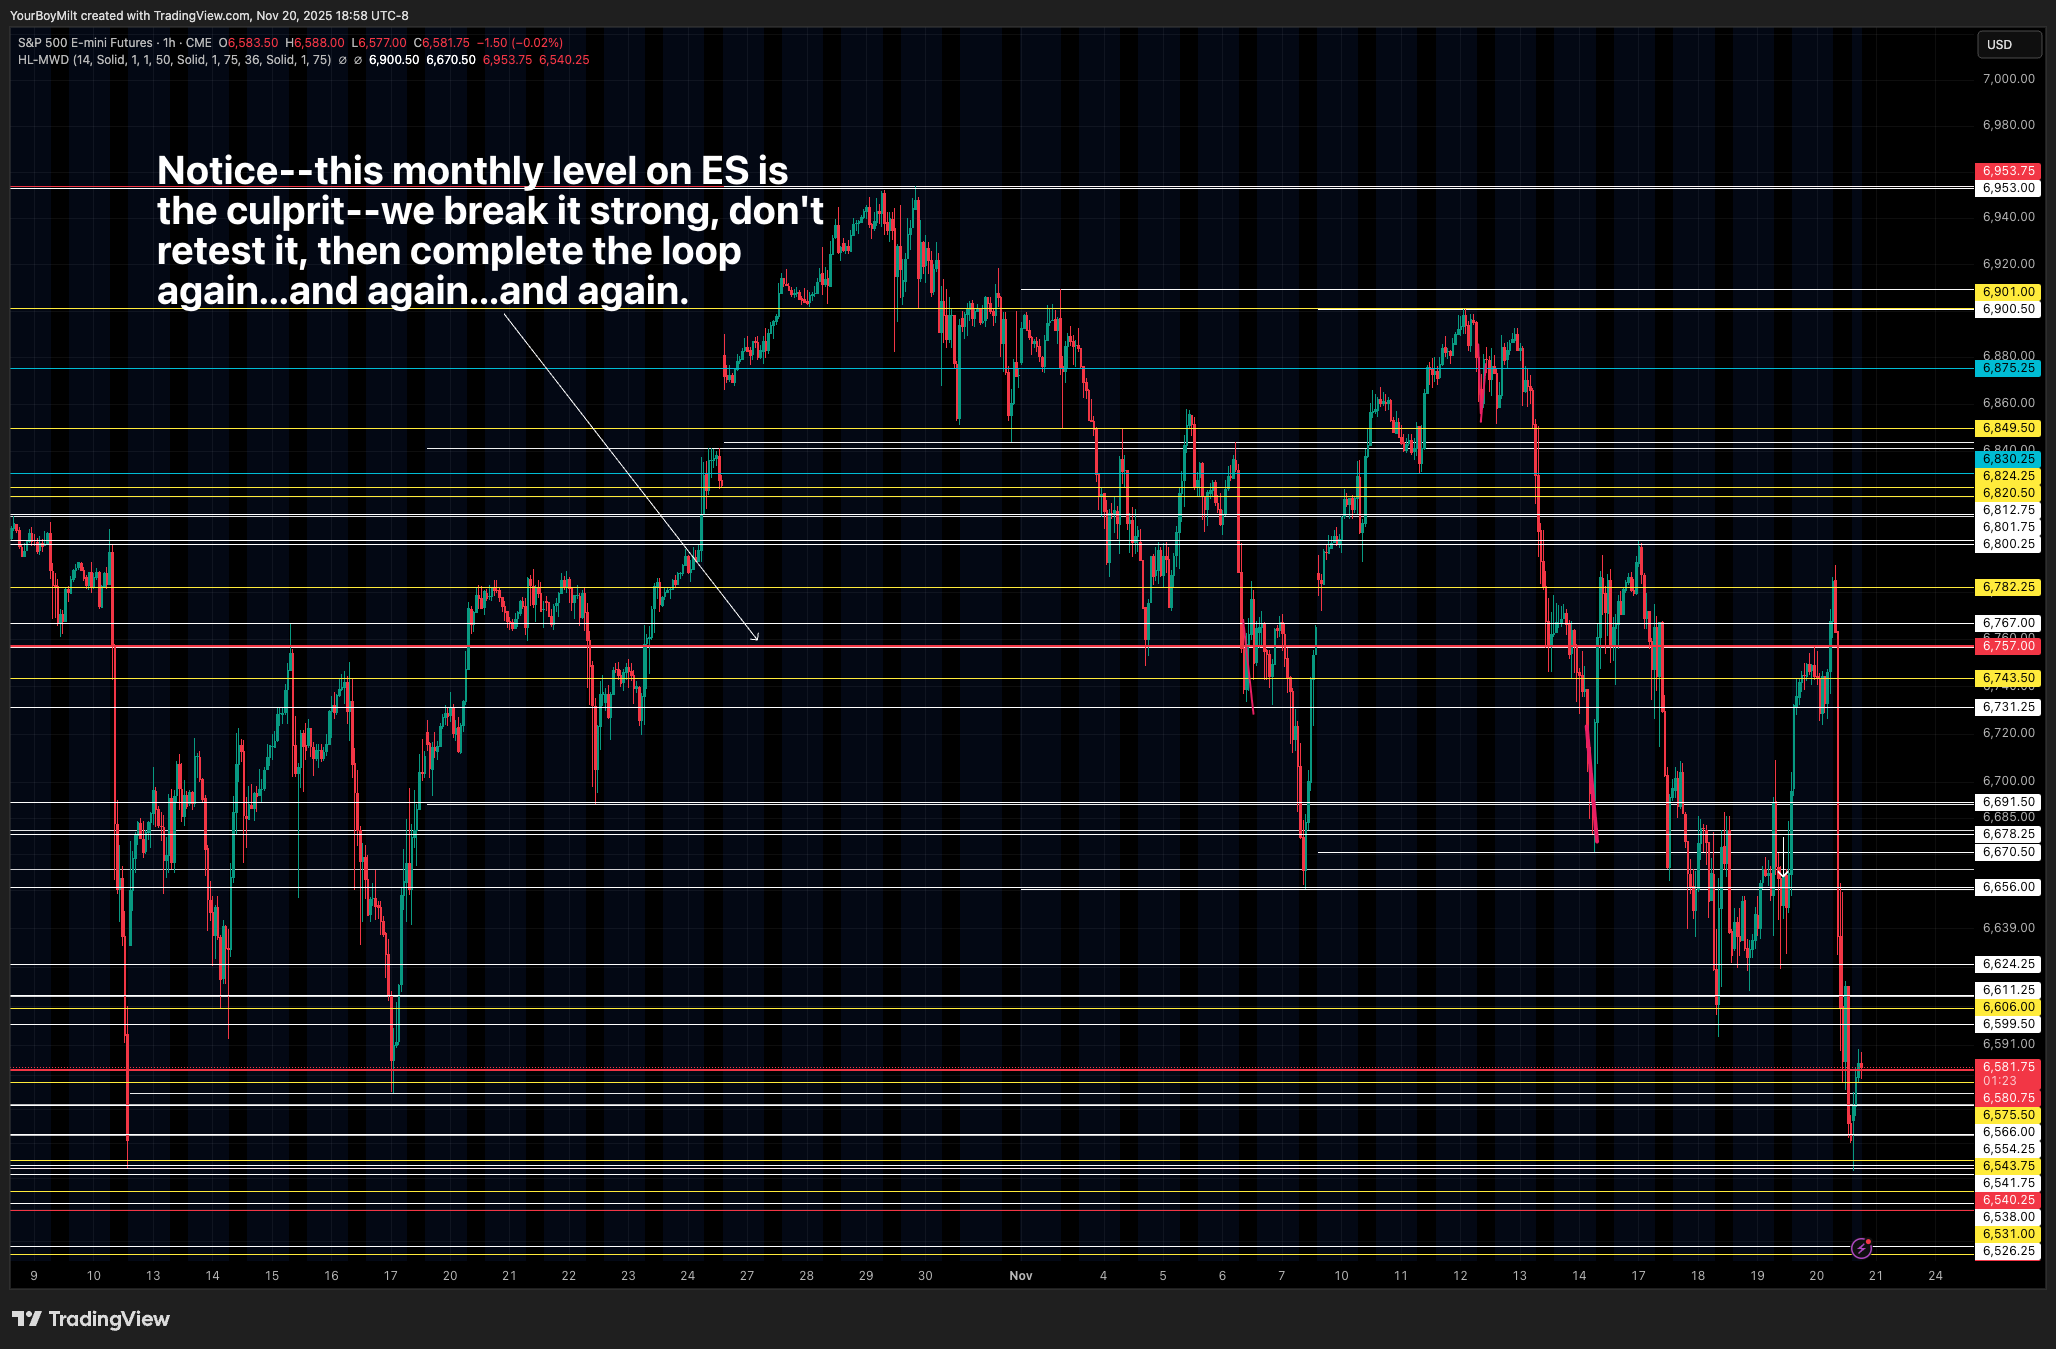
What looks like trend reversals is often just the market completing tests it avoided earlier.
🧩 What Ends the Cycle
The volatility cycle slows once the following conditions start appearing:
Skipped levels finally get retested in the same day
Monthly structure begins to hold
Candle size starts shrinking
Flow becomes less aggressive and more balanced
These signals normally lead into consolidation and a return to more normal market behavior