
🩸YEET DD 8/18: SPY 22 point and NVDA exhaustion say we will drop majorly, two flow plays
Finally, relief to the downside is on the horizon

NOTE: So SPY was hanging in that 50-60 PARI range. Even though SPY barely moved on the day, its PARI score ripped higher — and here’s why. PARI looks back ten trading sessions and compares today’s close against where we were then, while also factoring in how volatile those ten days have been. On Aug 18, SPY was sitting more than 20 points above where it was just two weeks ago, and the ride to get there was unusually calm. That combo — strong distance from the 10-day base plus low realized volatility — pushed PARI into the upper tier of its historical range. For traders, it doesn’t mean SPY suddenly turned bullish in one day, but that the structure of the past two weeks now looks like prior hot zones: extended, steady, and ripe for a snap-back fade.
📊 SPY Levels (Color Key)
🔴 Major Resistance: 646.20
🟡 Yellow Levels: 645.72, 645.54, 645.49, 645.24, 645.22, 644.40, 644.25, 642.85, 642.18, 642.00, 641.47, 636.66, 636.18, 635.57, 635.03, 634.38, 633.64, 631.62
🔵 Blue Levels: 640.20, 639.87, 639.29, 638.56, 638.17, 638.04, 637.64, 637.60, 637.50, 637.42
⚖️ SPY PARI
Current reading: 79.9 → Momentum Regime
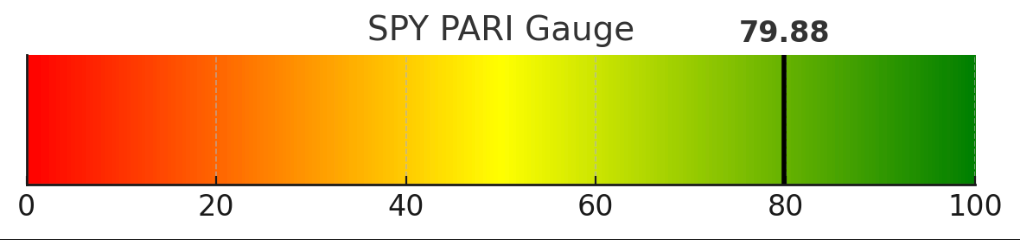
How we got here: PARI looks at the last 10 sessions. On Aug 18, SPY was sitting ~22 points above its 10-day base, while realized volatility over that window was unusually calm. That combo (big momentum vs. low vol) catapulted PARI higher — even though the day itself looked flat.
What it means: SPY is now in a “hot zone”. When PARI pushes this high, it usually signals one of two things:
✅ Continuation ONLY if buyers push through 🔴 646.20
⚠️ Exhaustion if momentum stalls and vol creeps back in
Translation for the layman: PARI isn’t saying “SPY ripped today” — it’s saying the last two weeks of price action are stretched and calm enough to be treated like a loaded spring.

⚡ NVDA PARI (Last 10 Days)

Ran too hot: swinging between 70–80 daily.
Aug 6/8/15 → hit ~80 again.
Aug 18 → cooled to 70.5, but still well above neutral.
Interpretation: NVDA has been the engine for SPY, but it’s extended.
✅ If PARI stabilizes >75 → could drag SPY through 646.20.
⚠️ If NVDA closes <65 → look for a fast SPY gap-fill into 640.
🔮 Predictive Read: SPY + NVDA PARI (Bearish Tilt)
SPY PARI (~79.9, momentum regime)
When SPY prints this high, it’s not a “new fuel” signal — it’s a stress signal. PARI this elevated means price is stretched far above its 10-day base while volatility is artificially muted. That combo almost always marks fragile extensions rather than durable rallies. The market is too calm for how high it’s gotten, and that imbalance tends to correct by force. In other words, SPY looks less like it’s gearing up for liftoff and more like it’s standing on shaky stilts.NVDA PARI (~70.5, hot but cooling)
NVDA has been the driver of the broader tape, but its PARI rhythm — spiking into the 80s, cooling into the 60s, then spiking again — shows a pattern of exhaustion churn. Now that it’s cooled back into the low 70s, the message is that leadership is slipping, not strengthening. NVDA isn’t breaking down yet, but it’s no longer adding net new thrust — which historically sets up drag on the broader index when momentum fades.
🧭 My Take
Both PARIs are flashing that the market is overstretched, overquiet, and overdue. SPY is priced like nothing can go wrong, and NVDA has been running at full heat for too long. That cocktail rarely resolves with another calm leg higher — it usually snaps. The risk here is a sharp air-pocket move lower, especially if NVDA finally loses its grip.
⏳ Timing the Snap
SPY PARI ~80
Historically, SPY doesn’t hang out in the 75–85 band for long. It’s the statistical “redline” of calm momentum. In past runs, it has held there for 3–5 sessions max before either breaking out violently or snapping back. Most of the time, the correction phase starts within a week.NVDA PARI ~70s churn
NVDA has been swinging between 65–80 for almost two weeks straight. That’s already long in the tooth. The pattern says it’s running on fumes — the next decisive leg usually hits within 2–4 sessions once PARI stops bouncing and picks a direction.