
🌊 YEET Flow/Action 101 pt. 1 : SPY Foundations
Understanding how to use the Net Premium Tool, and forming a thesis for the week…

Editor’s Note: Apologies for any format ugliness—thisYEET had to be created on mobile, as will the YEET+ editions through Tuesday while some important things get sorted out regarding the interwebs. While that presents some obvious limitations around flow, SPY is still workable as before, and this felt like a good time to lay foundations on how we use net flow and charts to get everyone up to speed.
What follows is a tutorial on how we’re using net flow with so much success, and how I form my SPY thesis for the week. Both of these are ‘trade secrets’ in a sense, but it felt appropriate to bless y’all since I’m not as around as I’d like to be the past few days.
For YEET+ folks the Twitter there will be active and the main place I am through Wednesday.
1. The Net Premium Flow: My Step 1 tool in looking for Scalp Entries and Forming a Swing Thesis
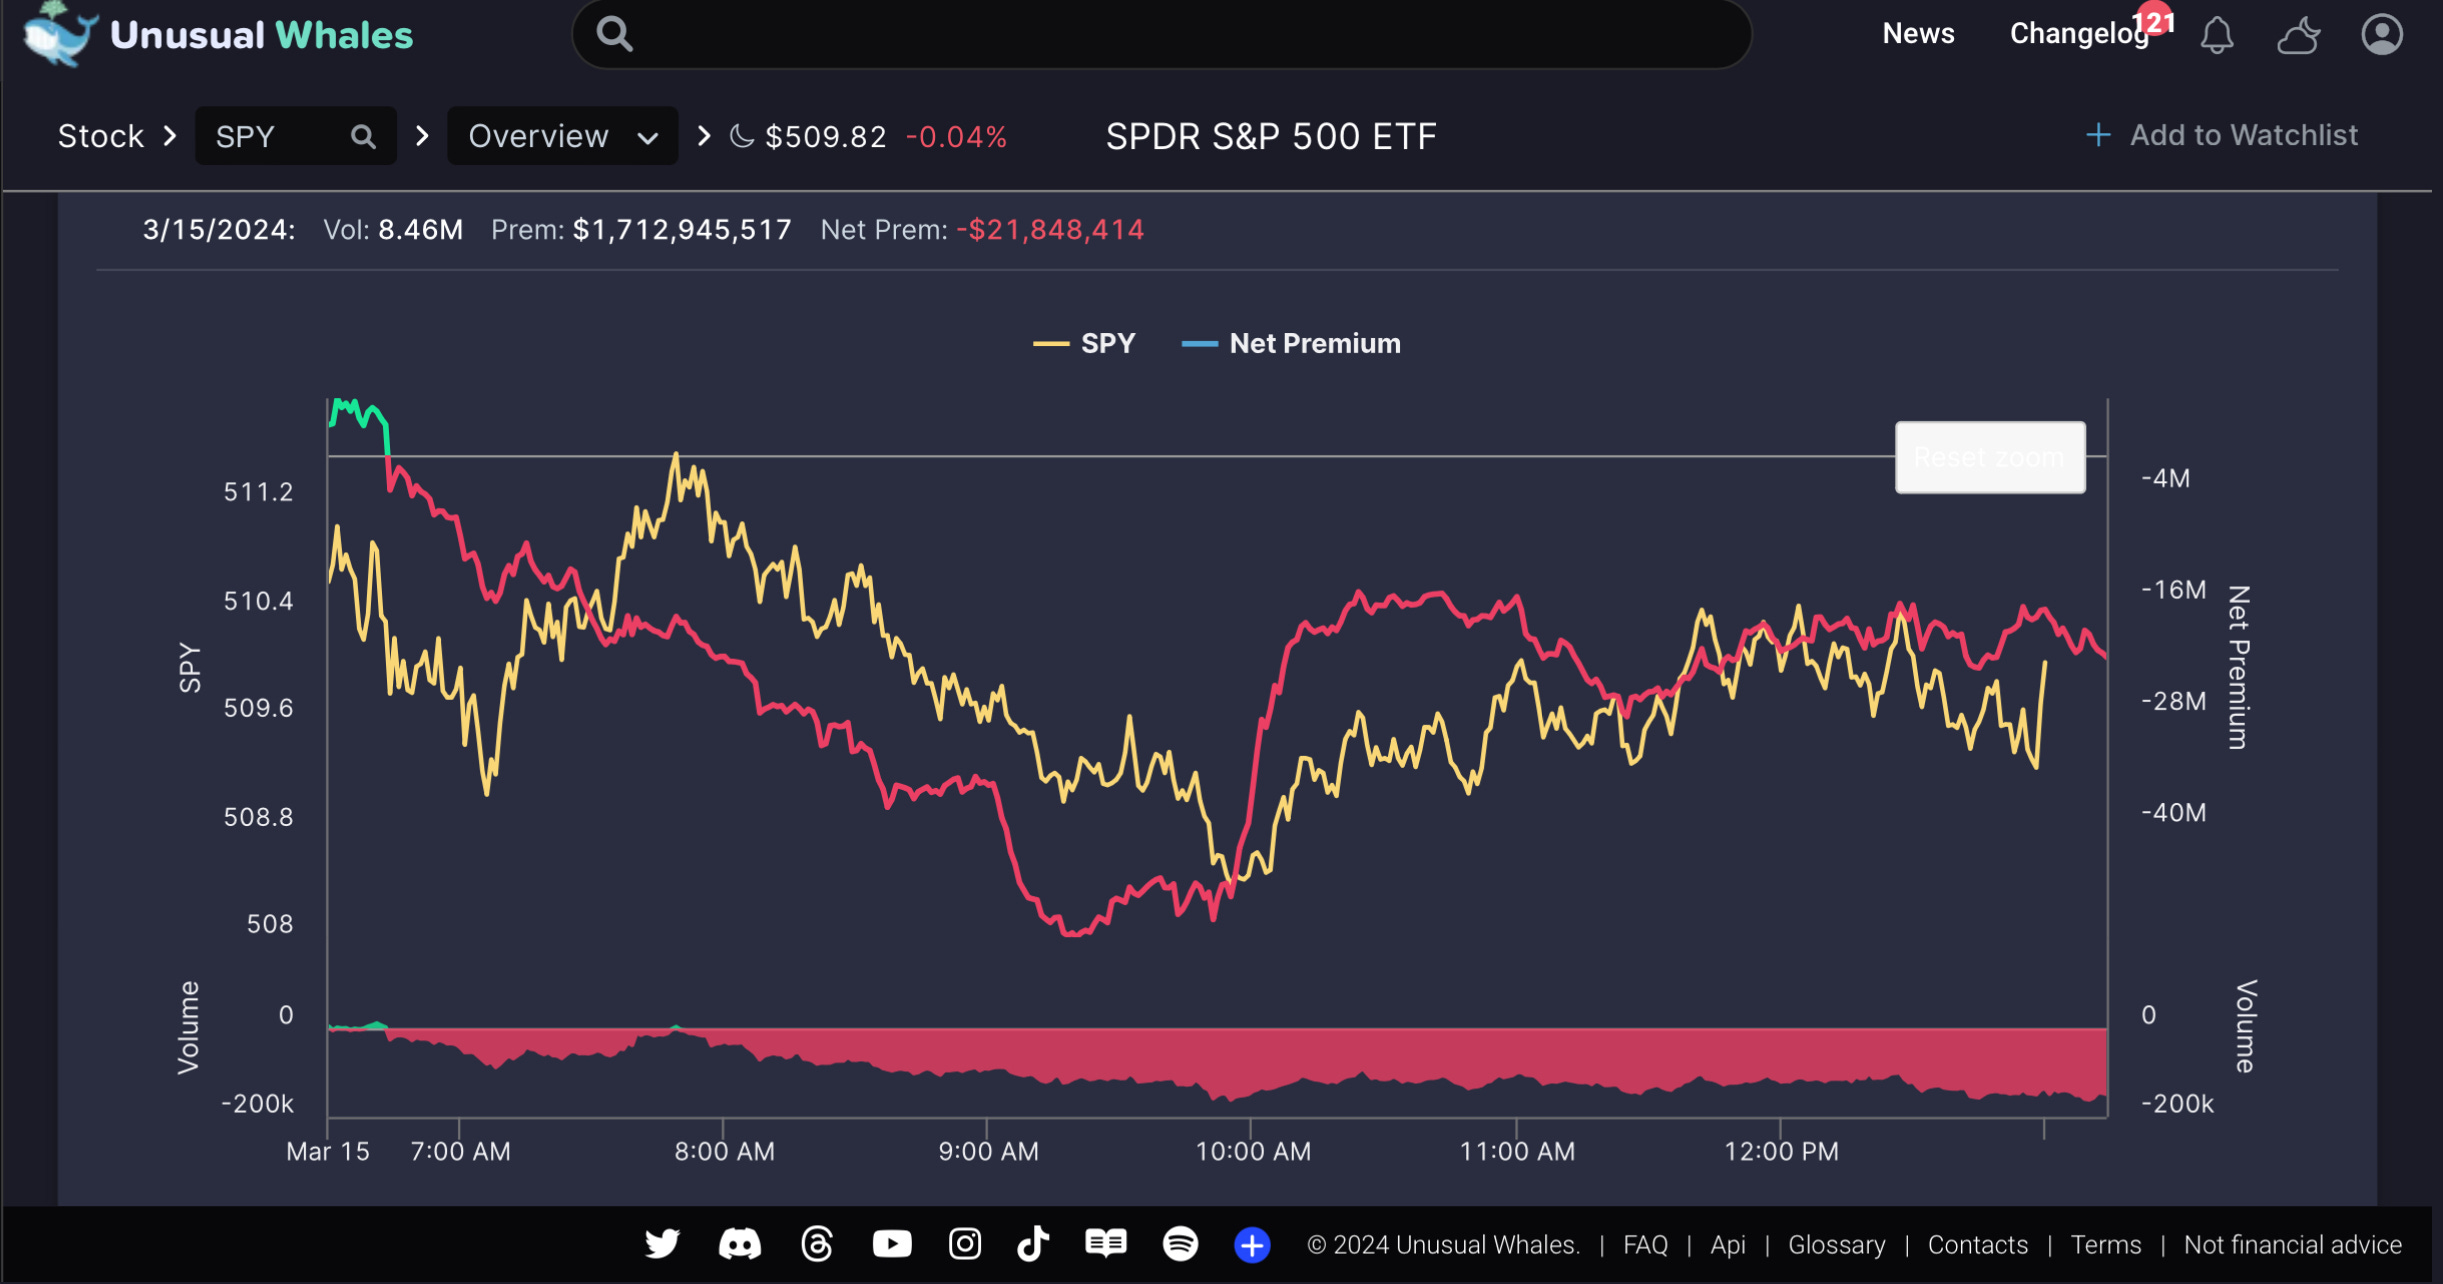
This tool is by no means an ‘absolute’ in how we go about trading SPY, but we look for two particular things:
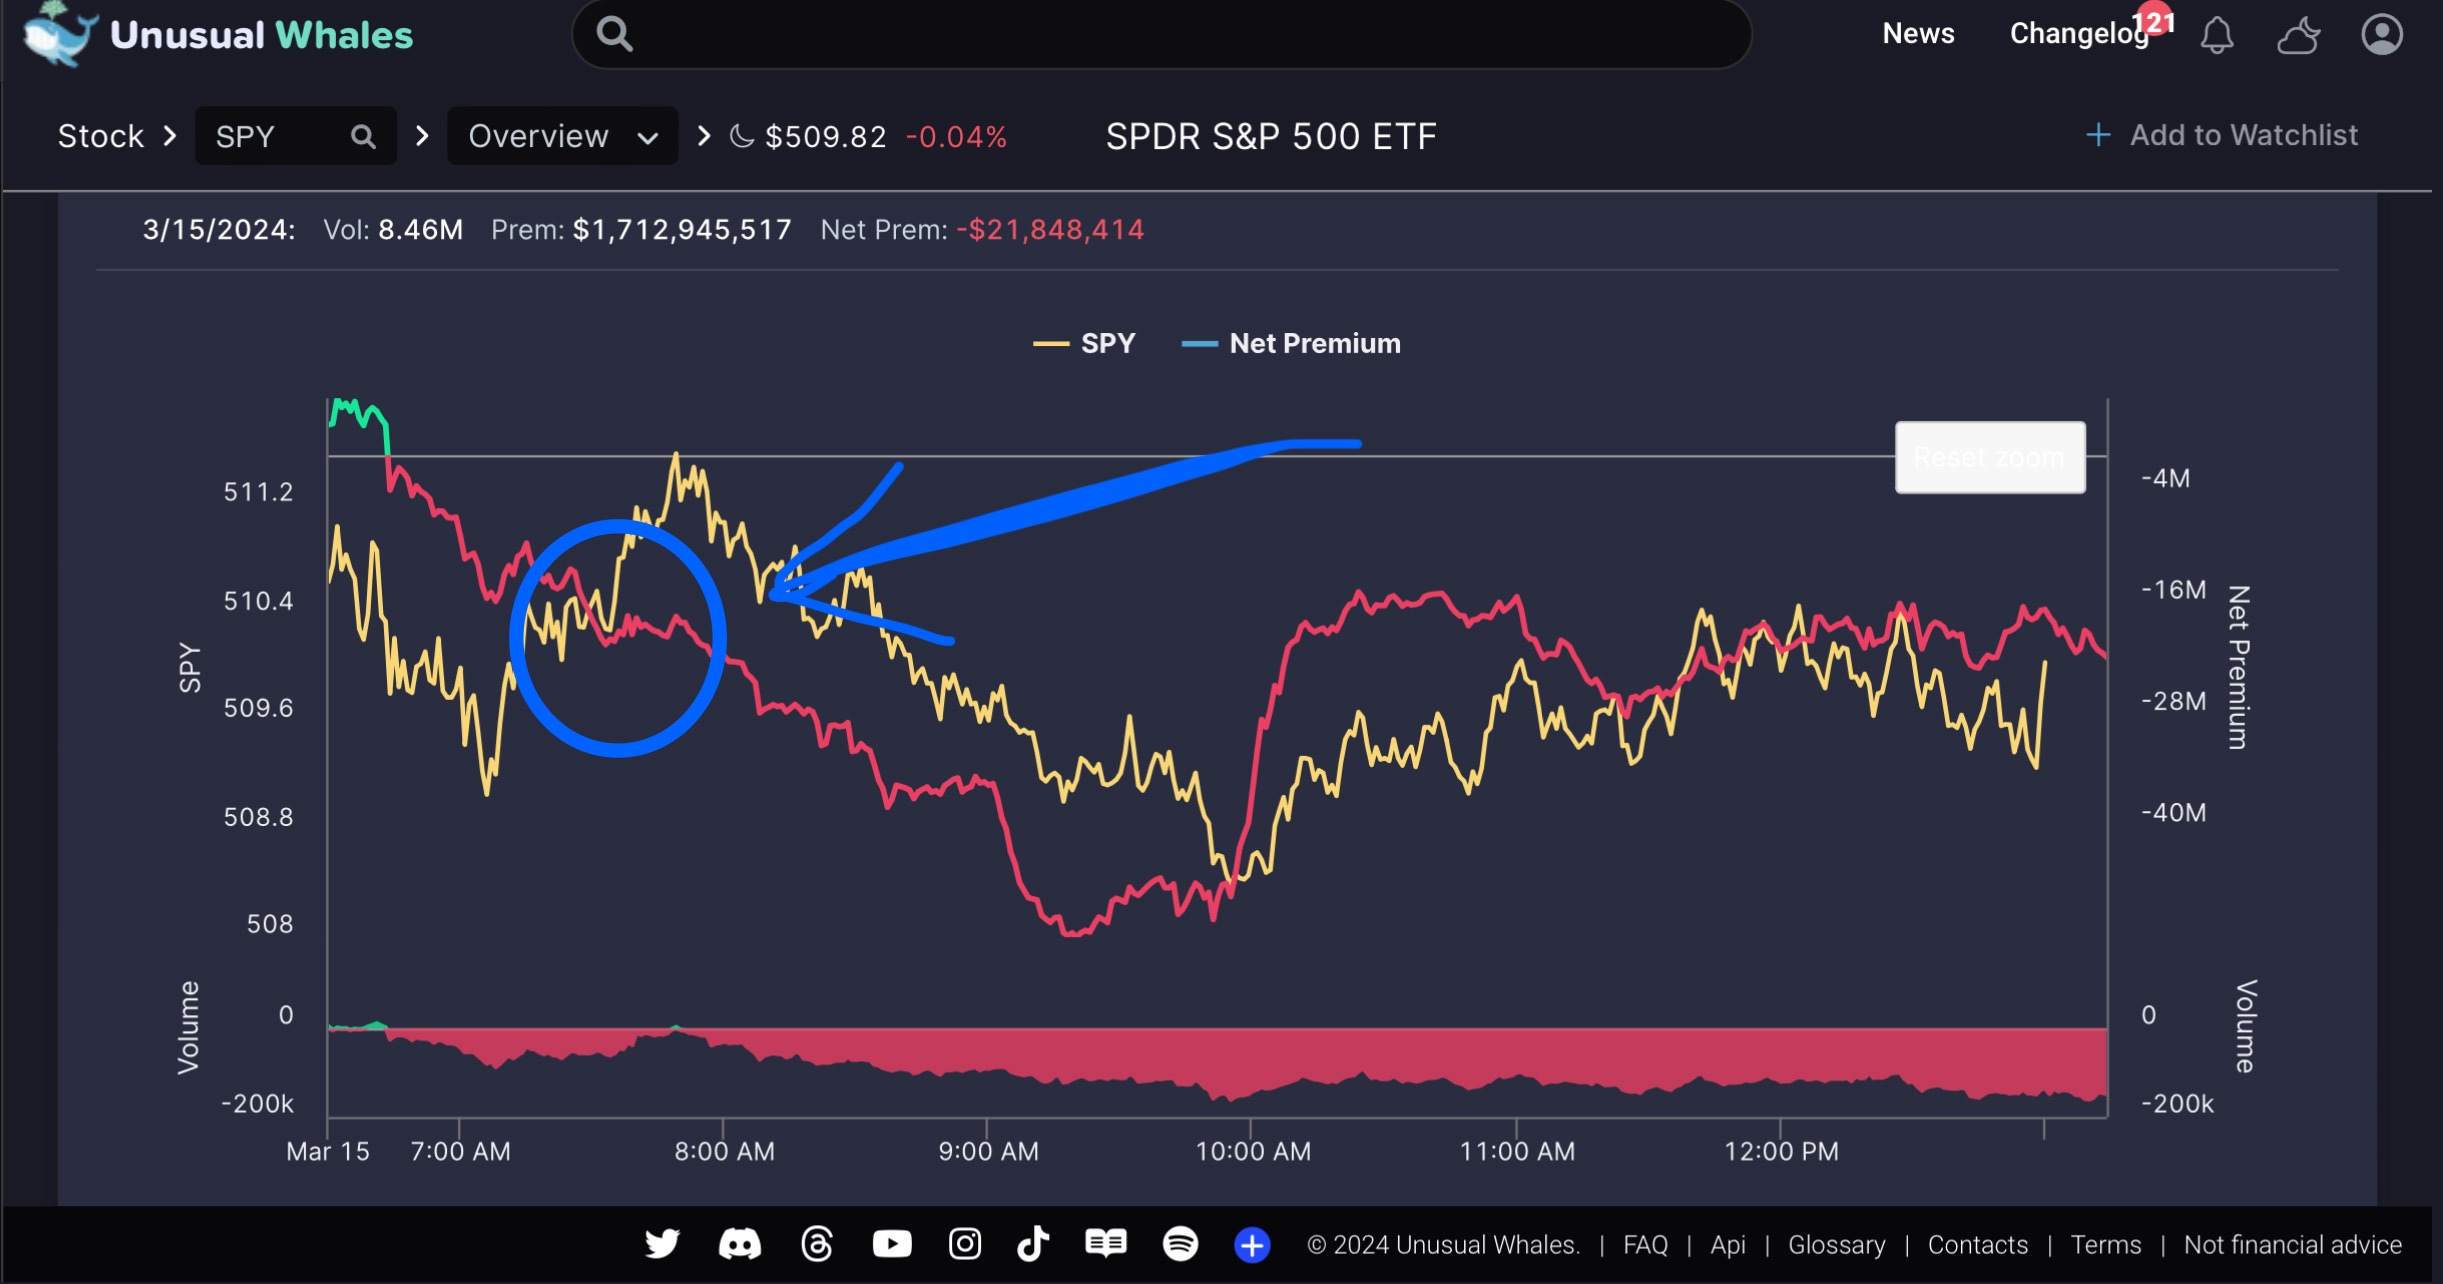
Divergence between the current price and the Net Premium. For example, if the yellow line (price) is going up as the red line (premium) is going down, then we give more credence to the bearish premium being a signal. On Friday there was an early divergence which was an excellent signal for an intraday short I’ve circled in blue.

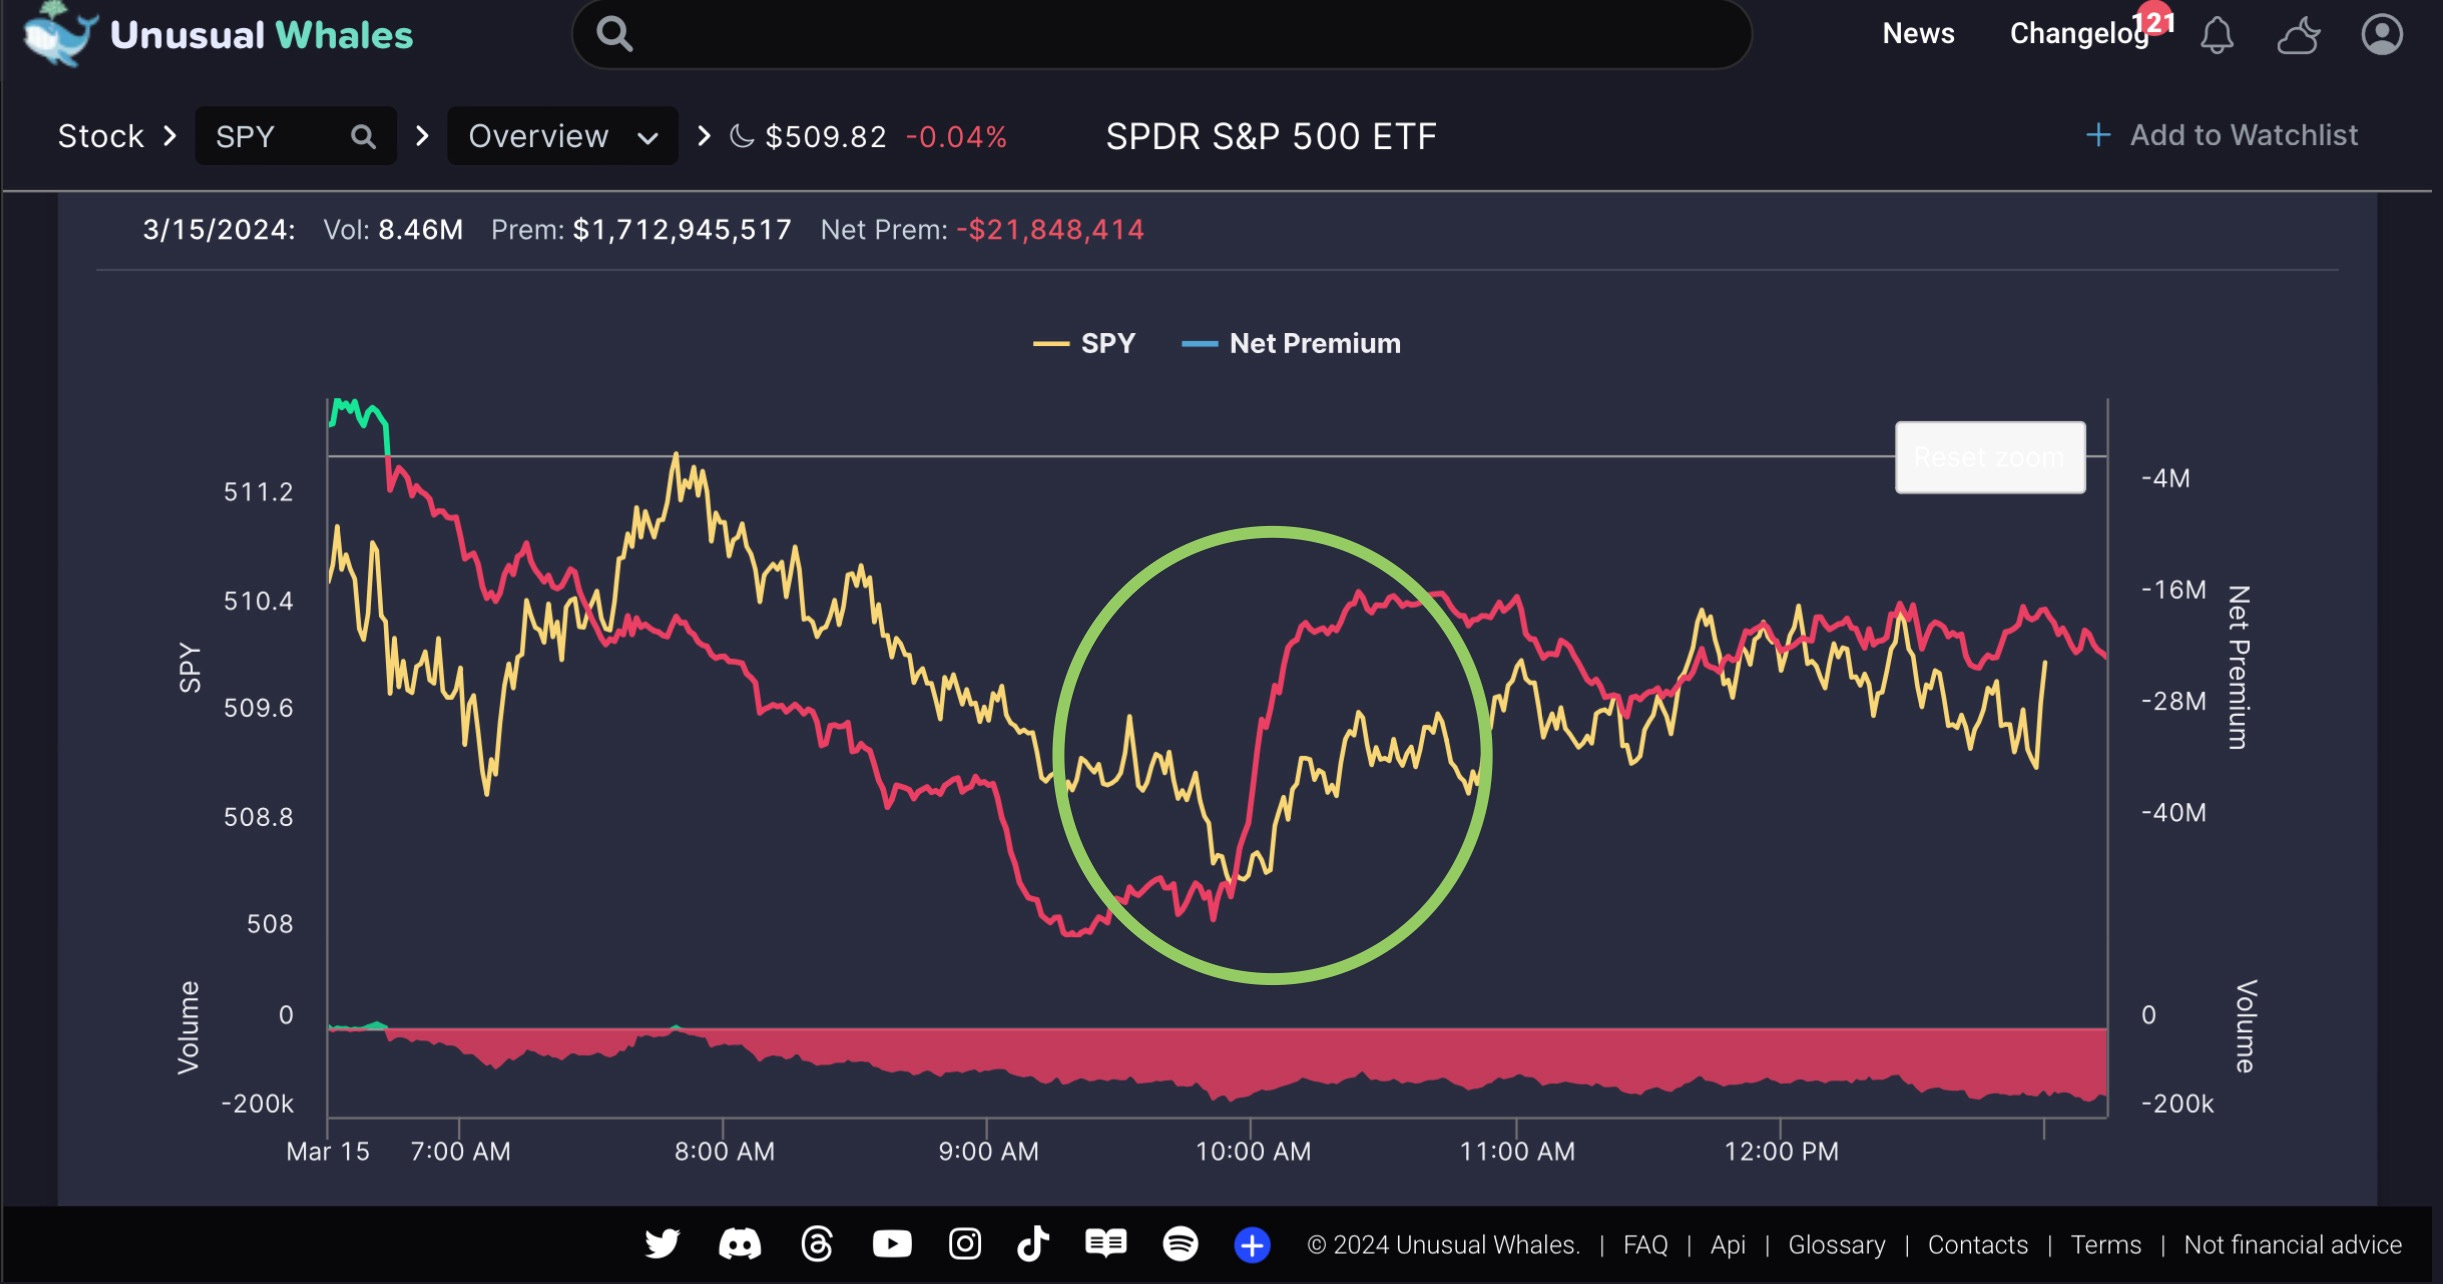
here you can see a bullish spike in the price diverge from a quickly growing bearish net premium—often an opportunity to short at a nice entry. Large spikes in either the positive or negative direction, particularly into the end of the day: these large movements signal shifts in sentiment from the market—usually these coincide with some macro speech or numbers release. Here, we see into the latter half of Friday we had a large jump in sentiment circled in green (note that ES is trading positively in the futures session as a result).
Net Premium and Levels Confirmation: Charting without a Chart
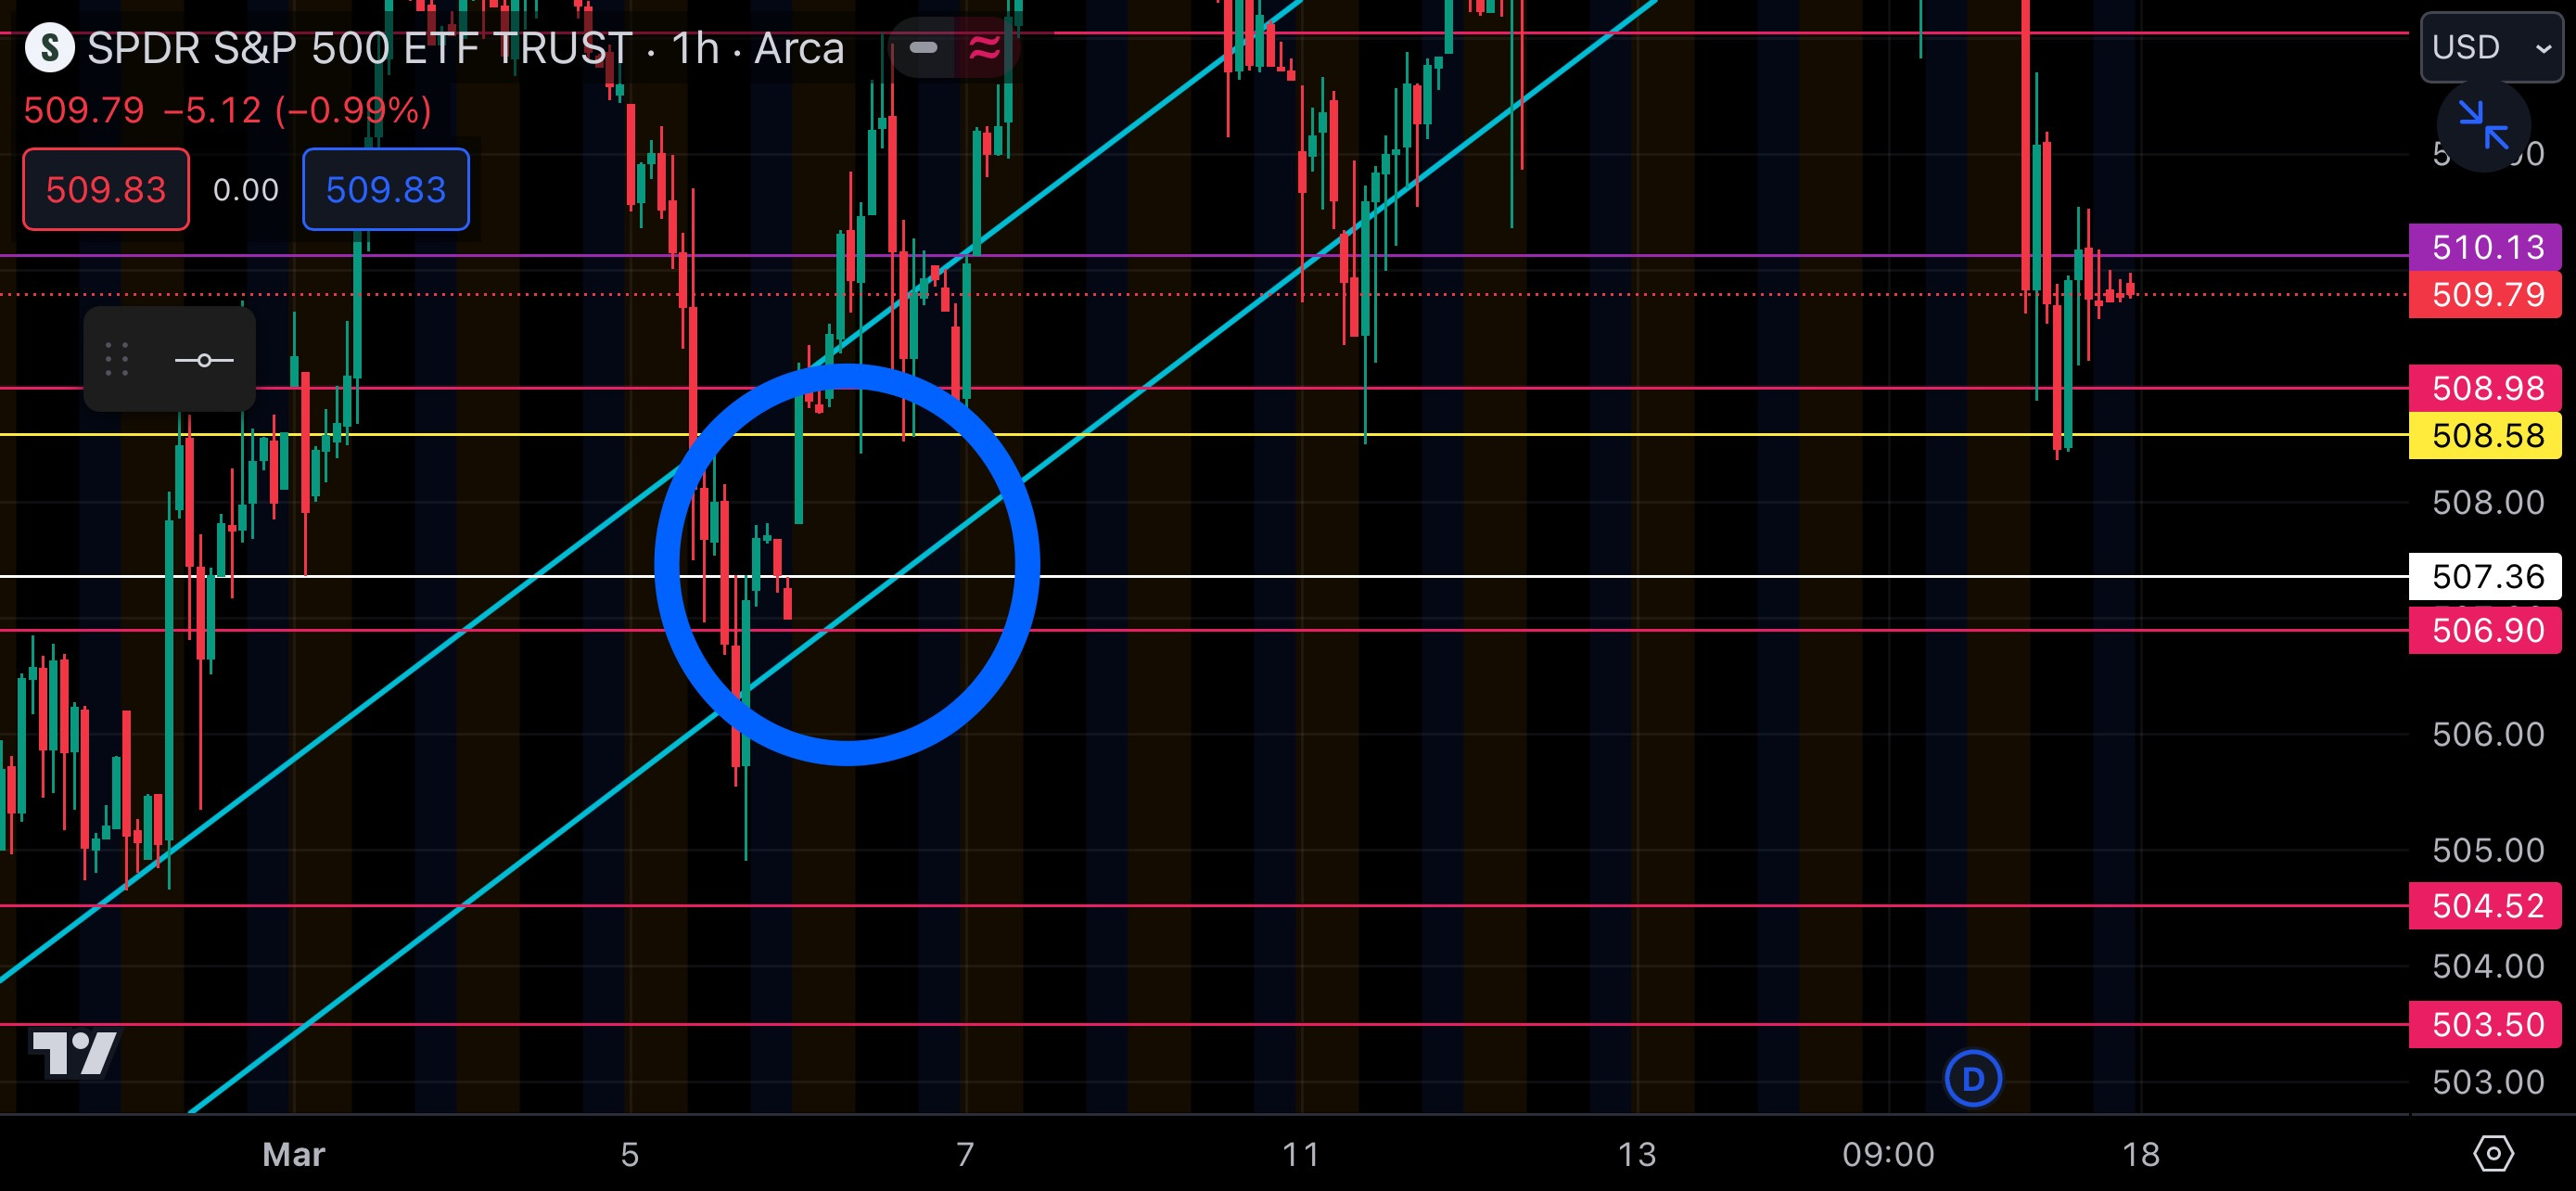
You can use this tool on a variety of daily intervals, and sometimes the value is in zooming out. We know that levels are important where net premium and SPY price level coincide for large moves. For example, looking at the 7 day net premium flow for this week, we could’ve made a conclusion about 508 that led to a profitable scalp Friday:
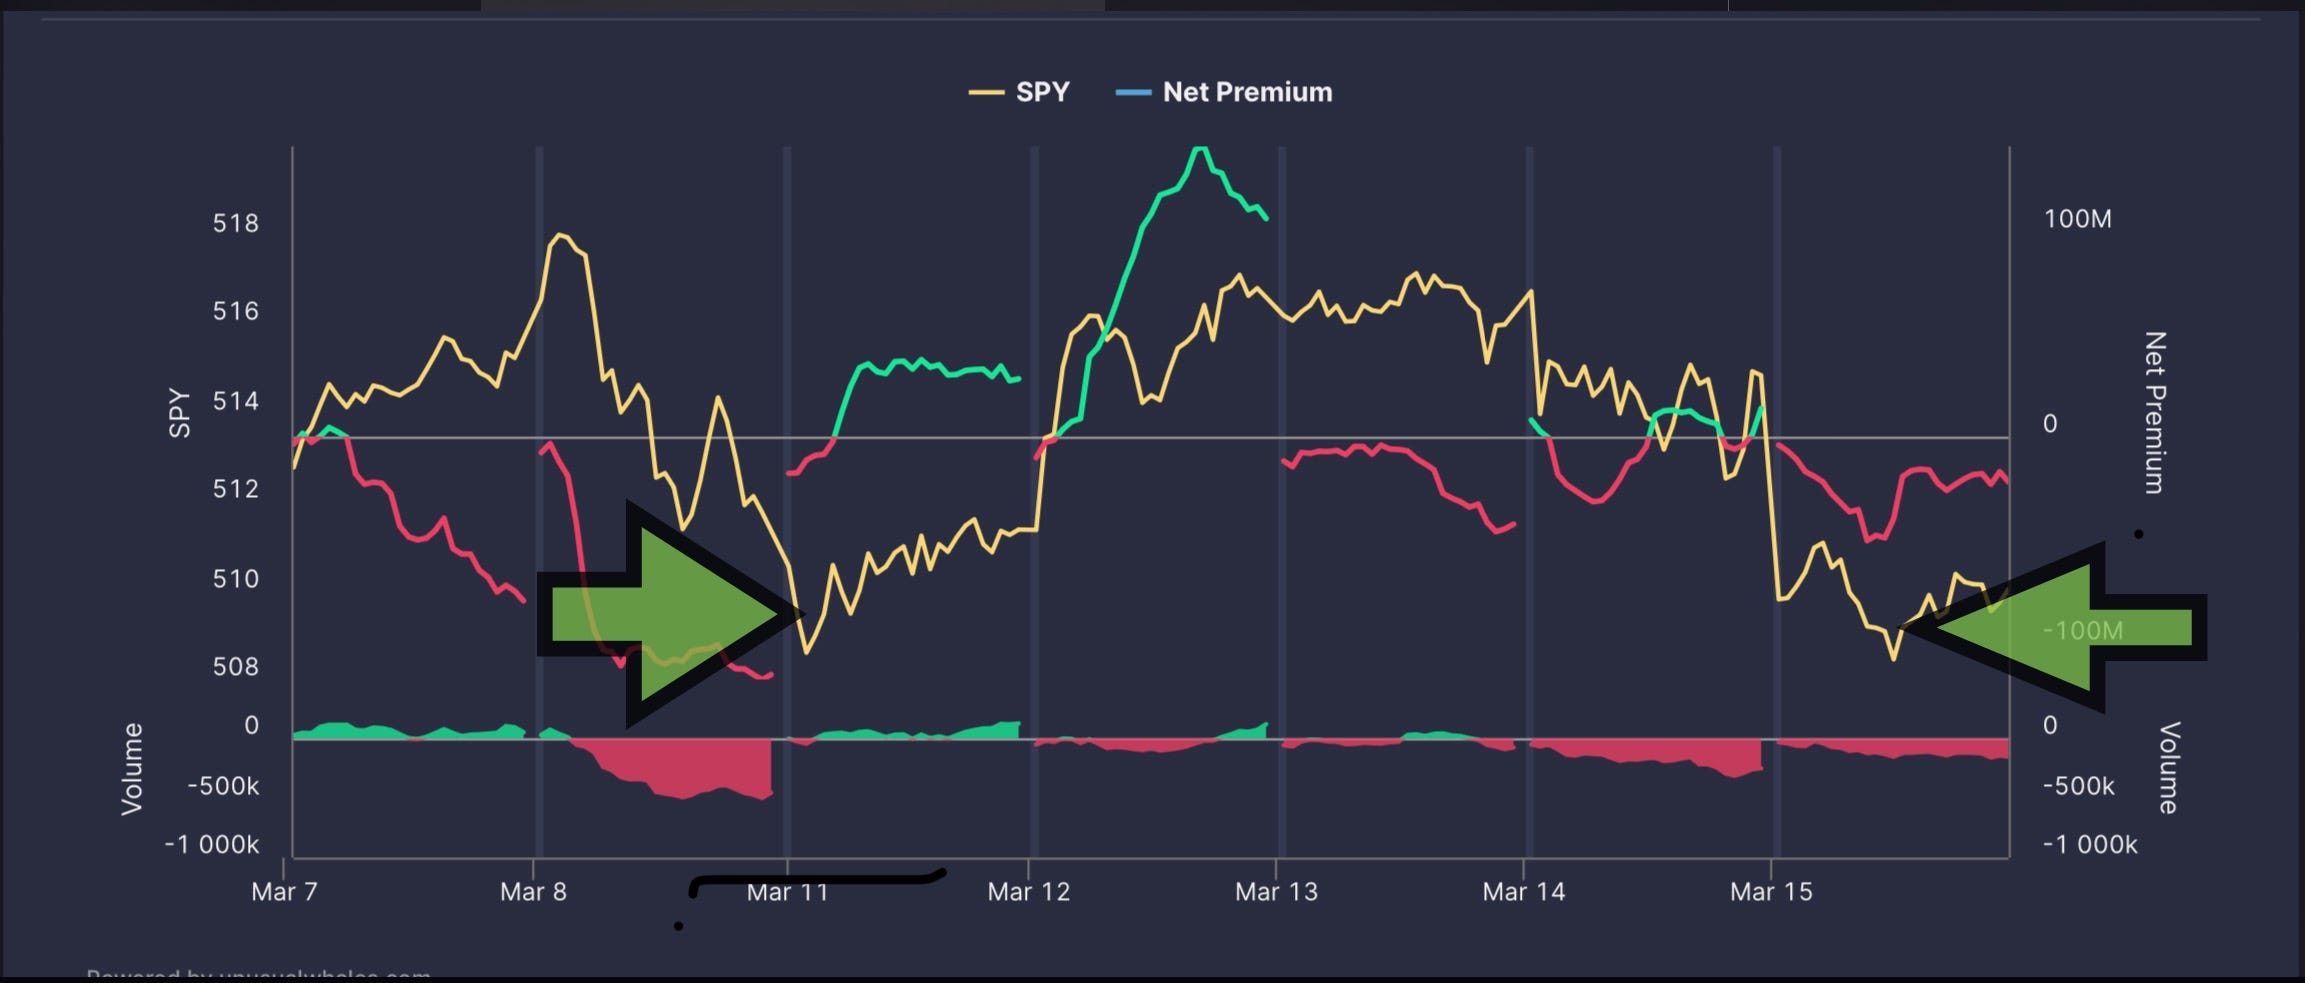
The last time we visited 508 on Monday the 11th, we saw an increase in SPY price and, importantly, a huge gap up in net premium, from largely net bearish to positive (green arrow 1). SPY ultimately went on an 8 point run from that level. You can see we hit that level on Friday and had a modest but notable increase in price, with a net premium turnaround into the end of the day. This is the type of movement that, if the chart isn’t disagreeable, would lead me to take a chance on a bullish SPY swing.
2. Applying the Charts for This Week: Forming Our Thesis
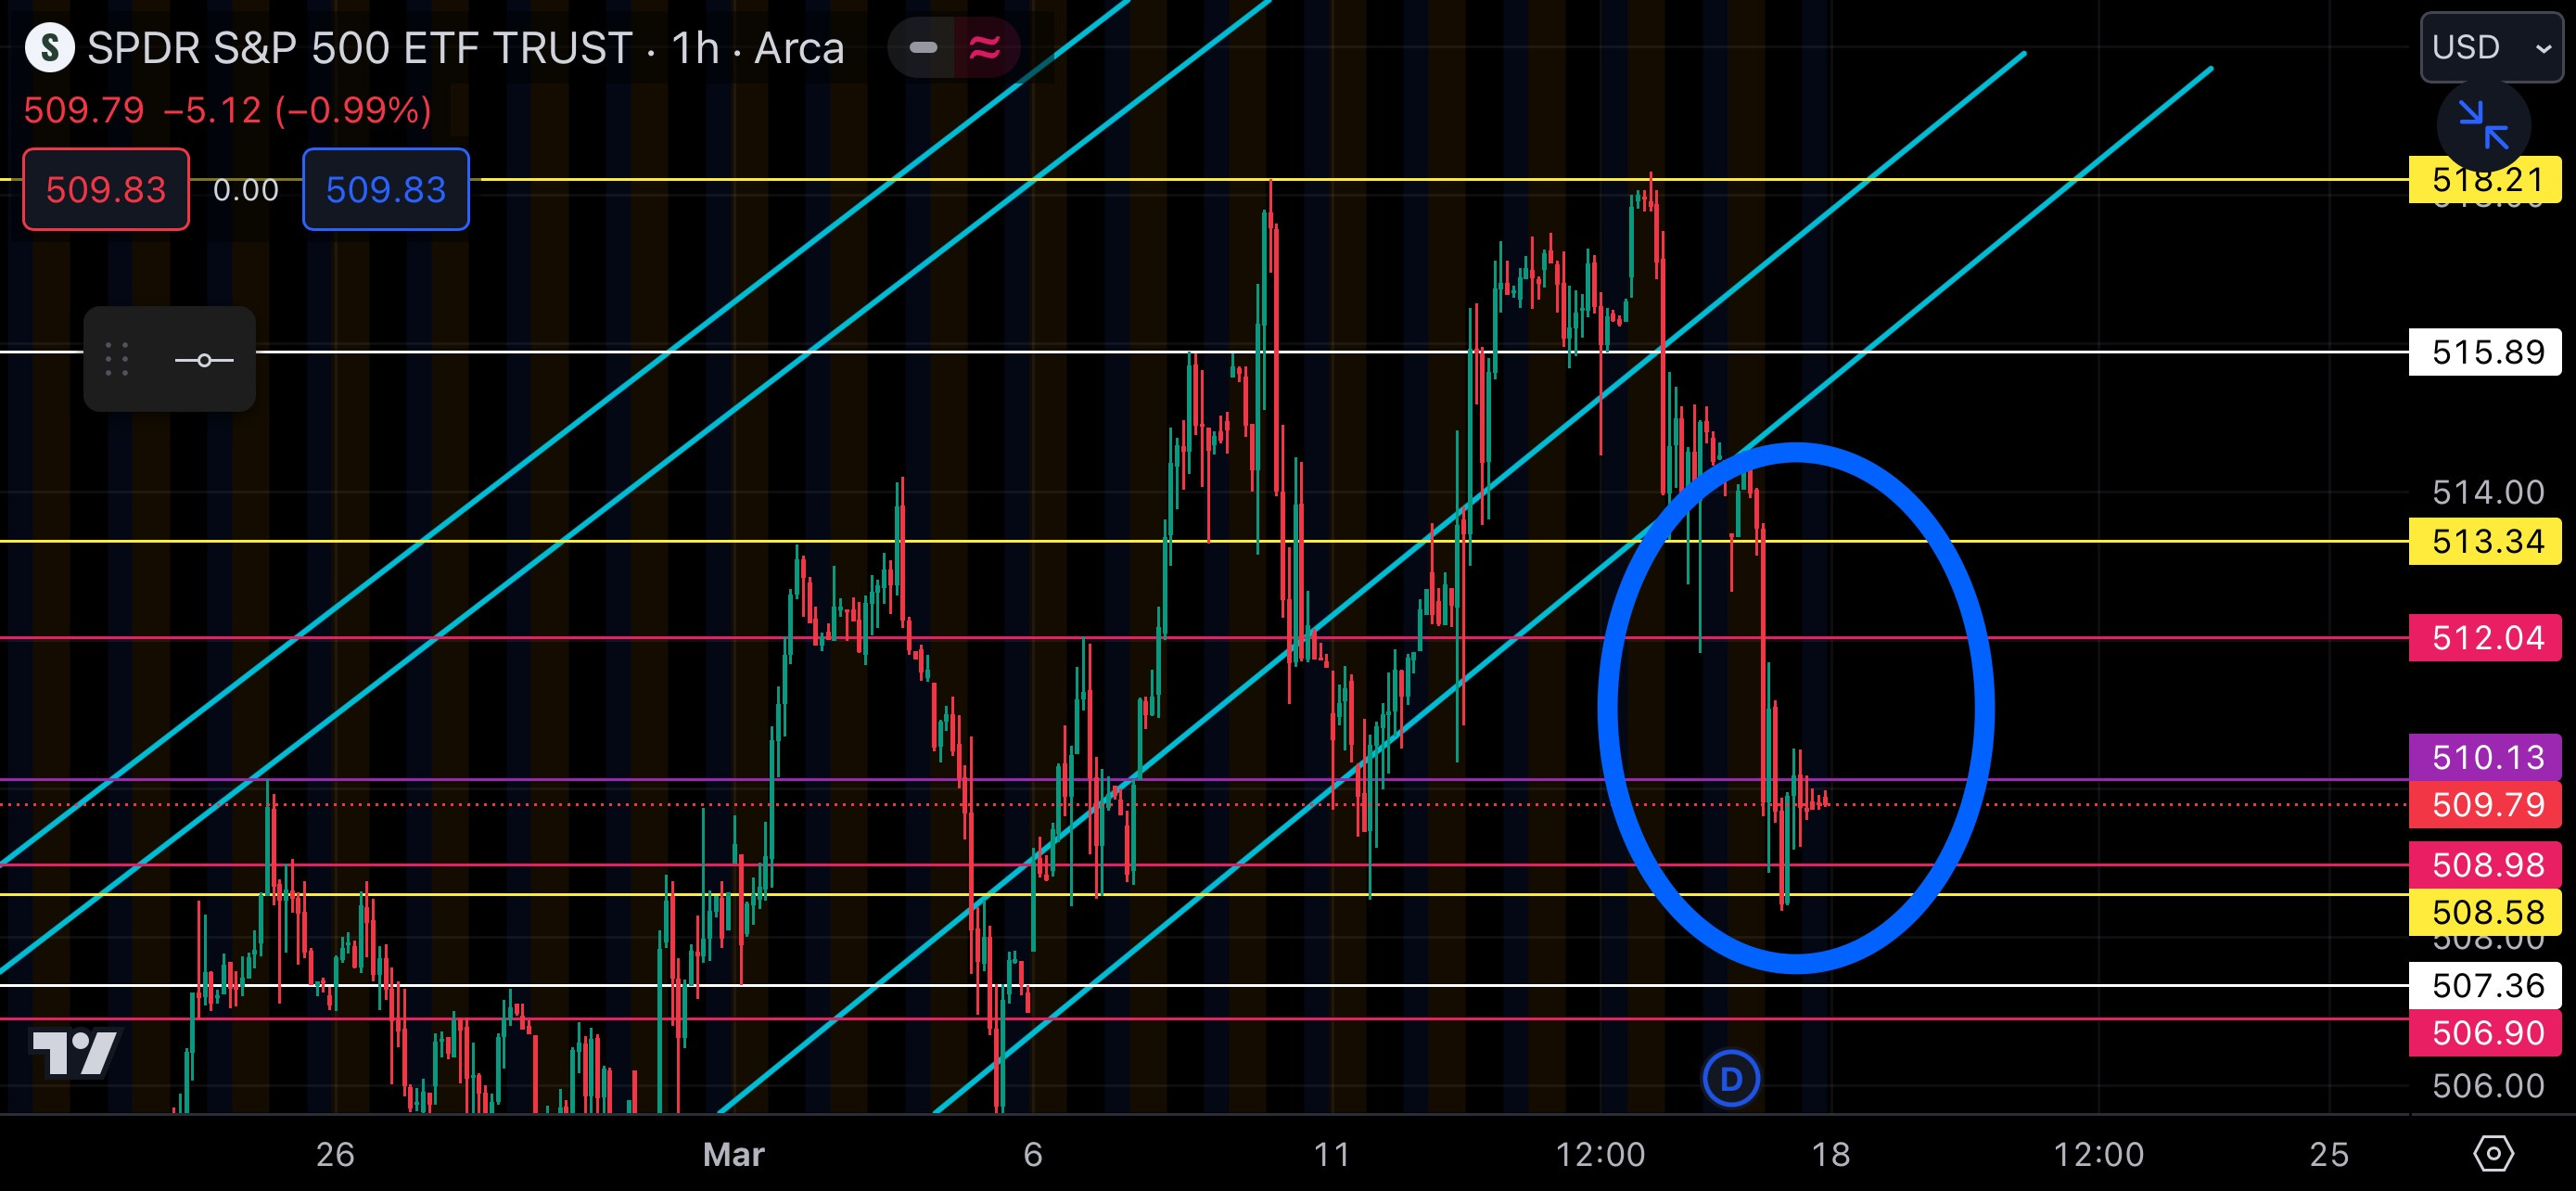
With the net premium into EOD Friday as any indication, we know that either overnight or early in the session tomorrow they are going to backtest some of the upside levels we fell through. The most logical first stop, then, would be SPY 412–but don’t get it twisted, we are outside of a well established channel right now which means things are bearish until proven otherwise👇
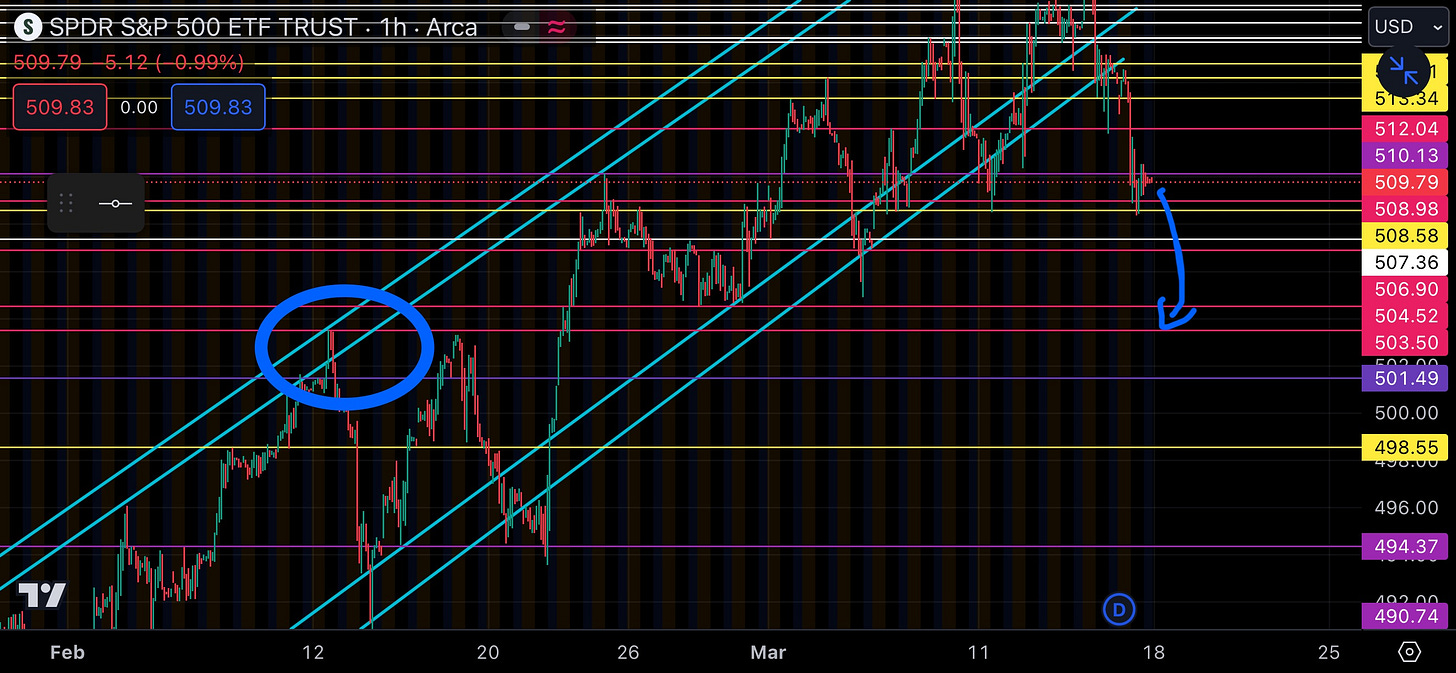
Where do we go after the upside retest? The chart is telling me two spots are on deck:
There is a gap to be filled down to 507.36: this is a gap created by ES overnight action—they do not get left unfilled for long.

The previous SPY top of 503.5 has not been retested after this large rise—that represents a very possible ‘final destination’. Key points of turnaround for SPY are often magnets for retesting.
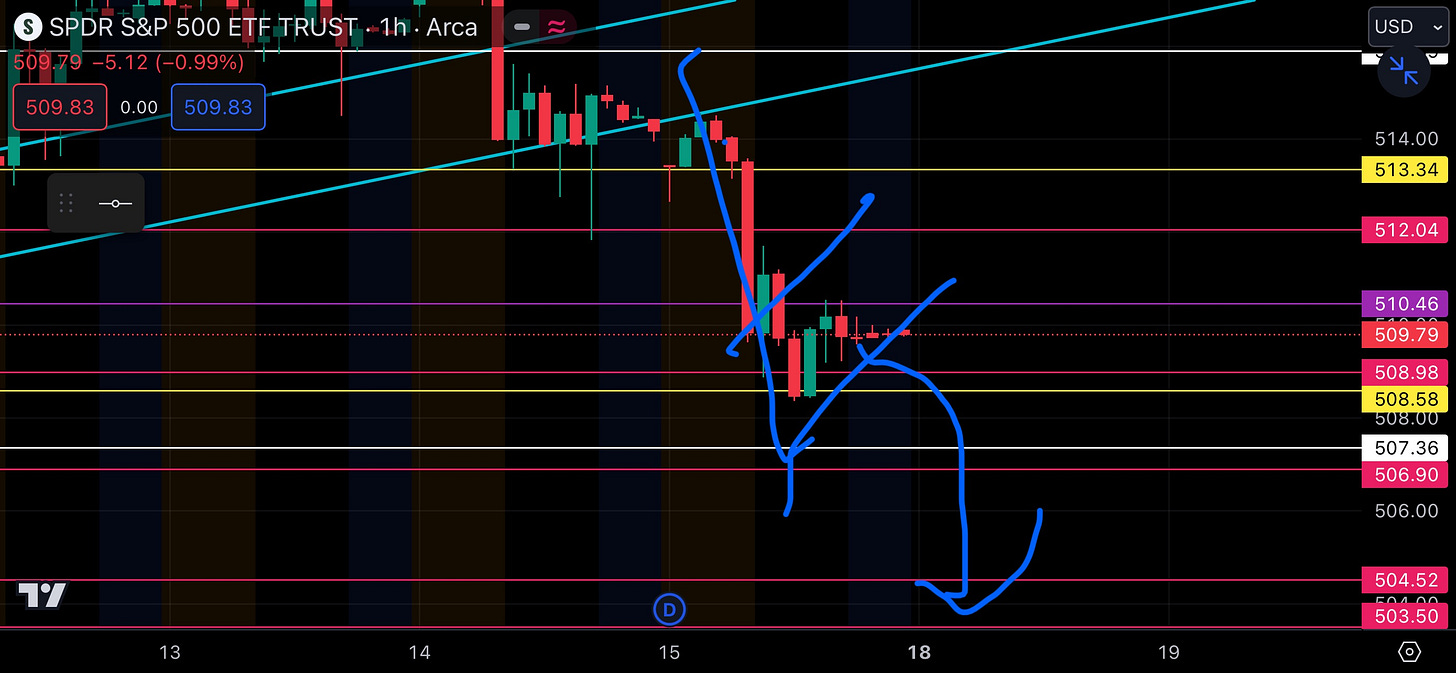
Further cementing the chart thesis that downside tests of these levels are coming is the bear flag forming on the hourly:

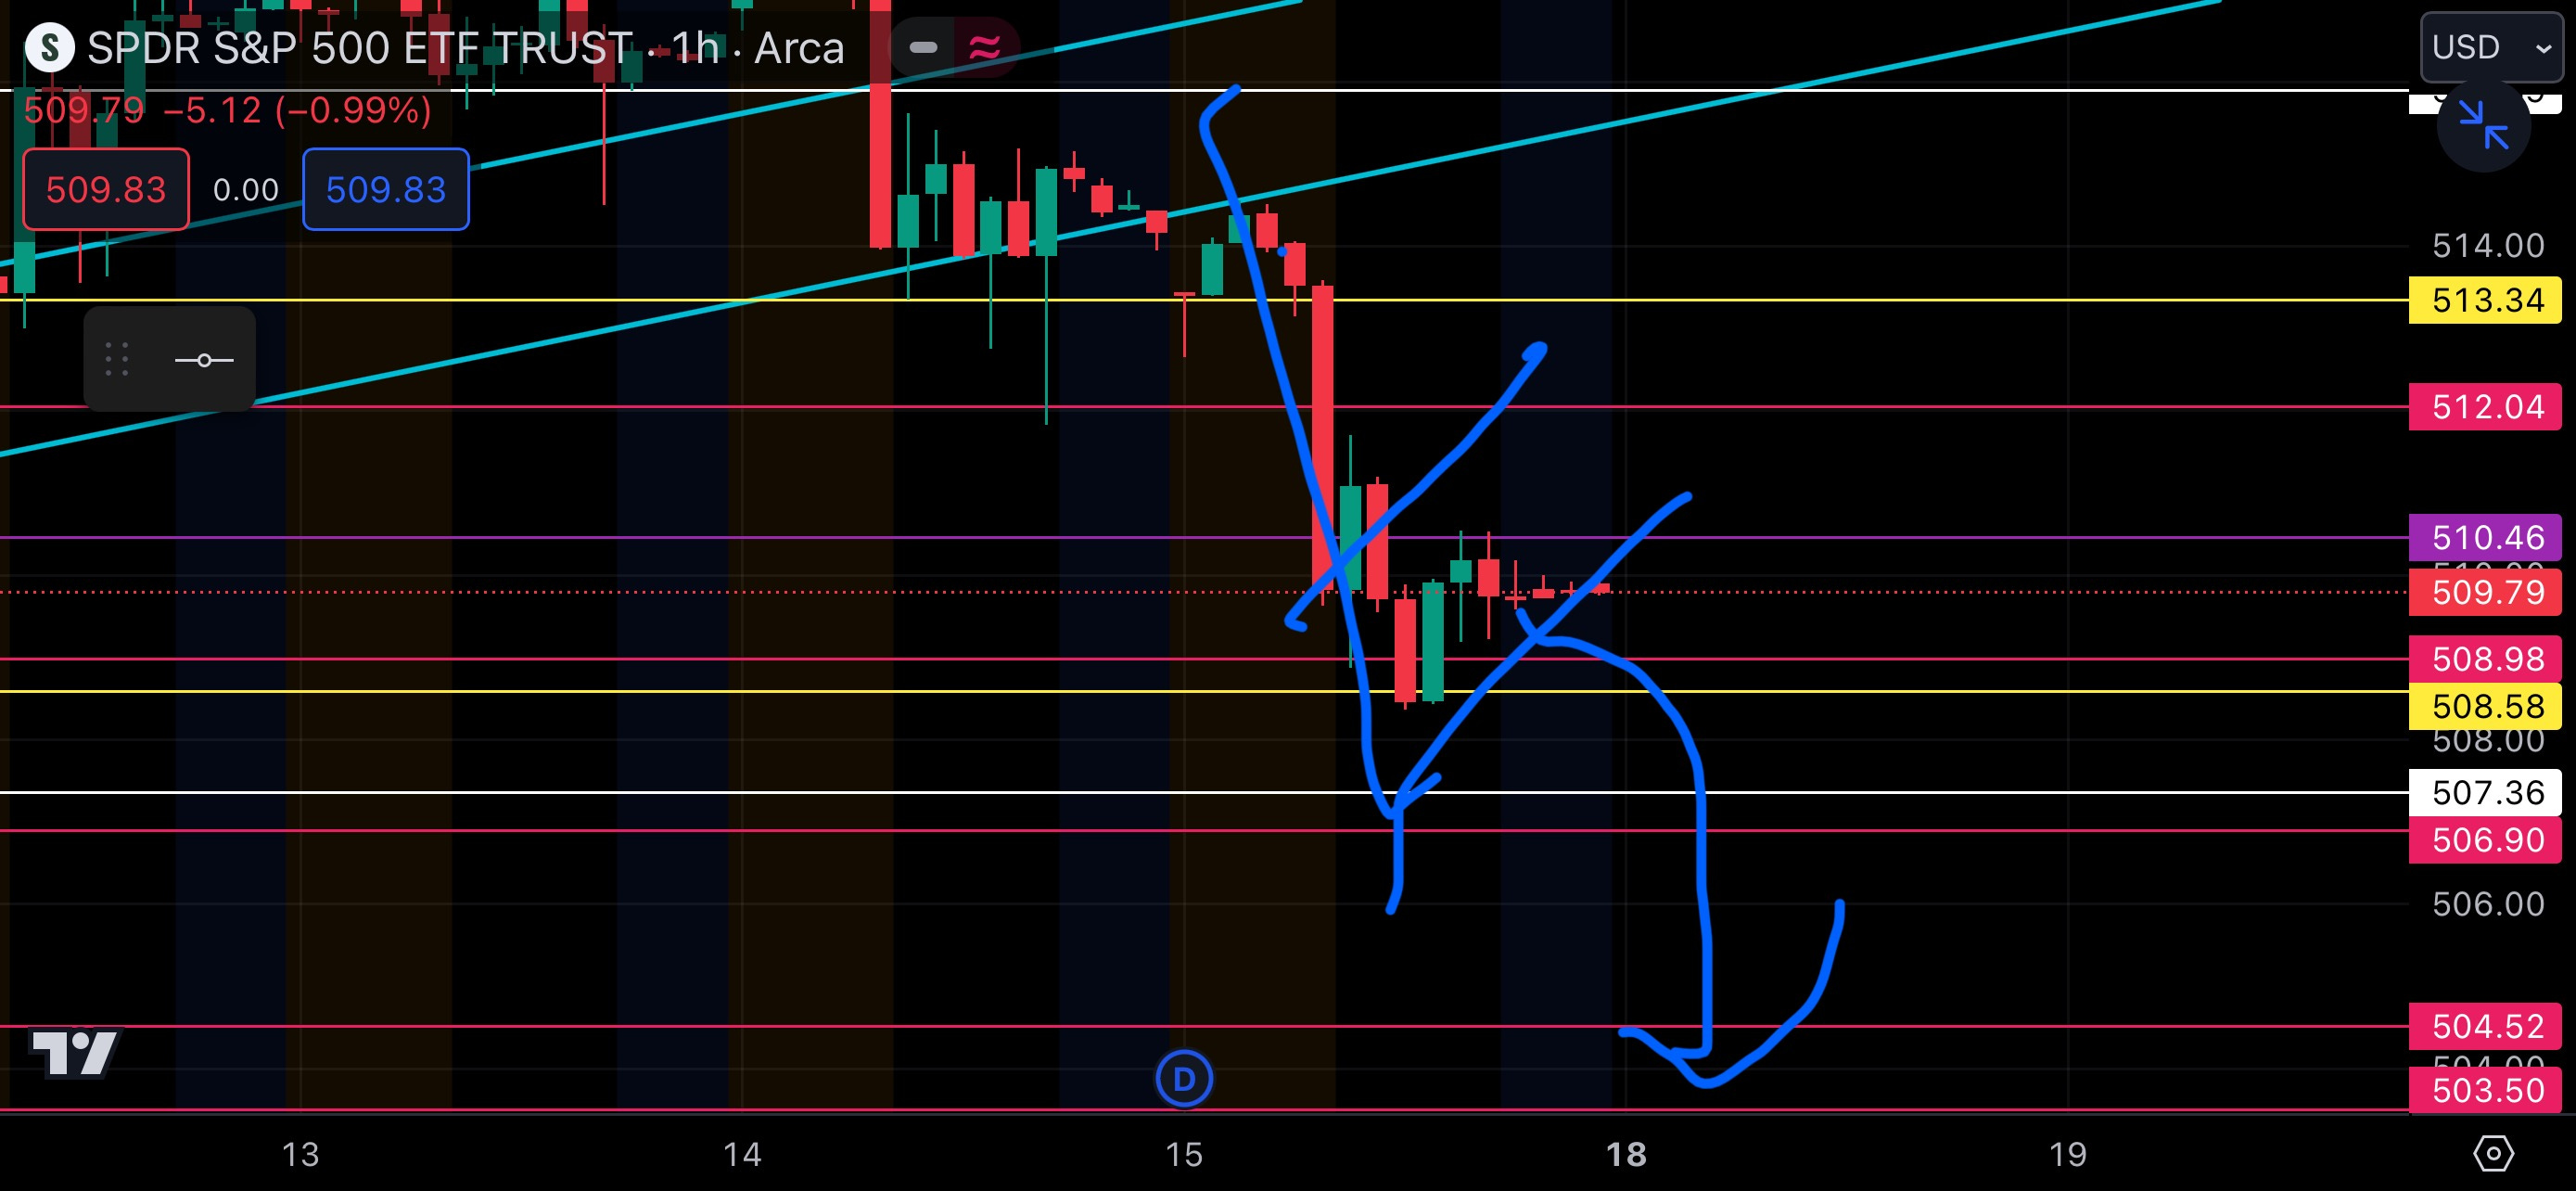
3. Callouts on the YEET Private Twitter Account Monday through Thursday:
The callouts Thursday (SPY and SPX puts) should’ve netted you somewhere in the 150% to 300% range depending whether you took Target 1 or 2.