
‼ YEET FOMC Preview: What Does the Chart/Flow Say
A look at the coming action from a few perspectives

WELCOME! Some stuff we will cover that will make sense to you shortly!
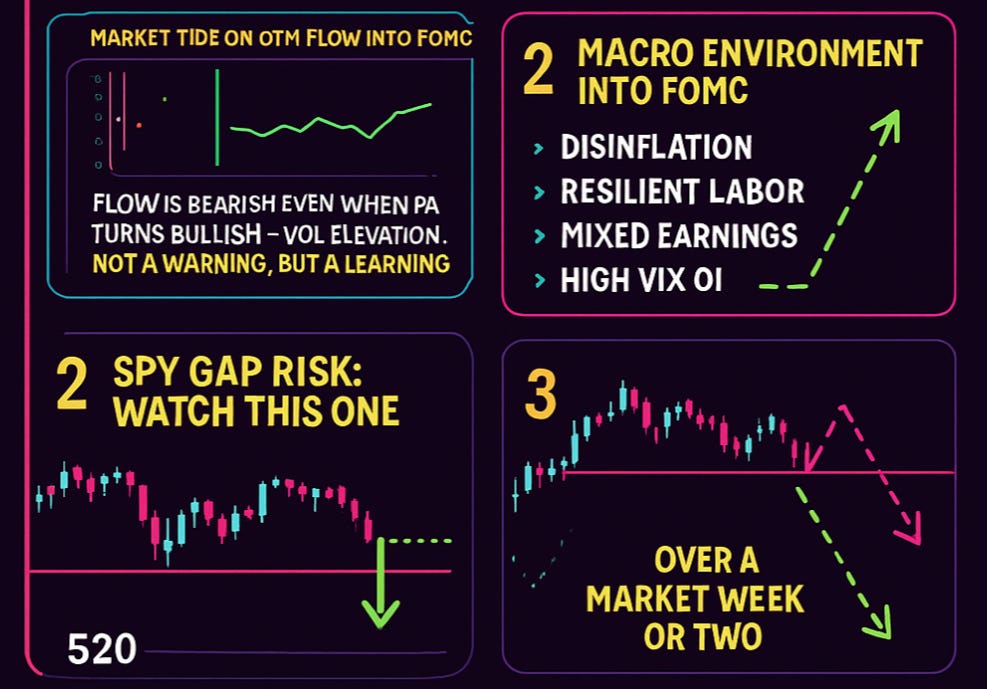
🧠 Market Tide on OTM Flow into FOMC
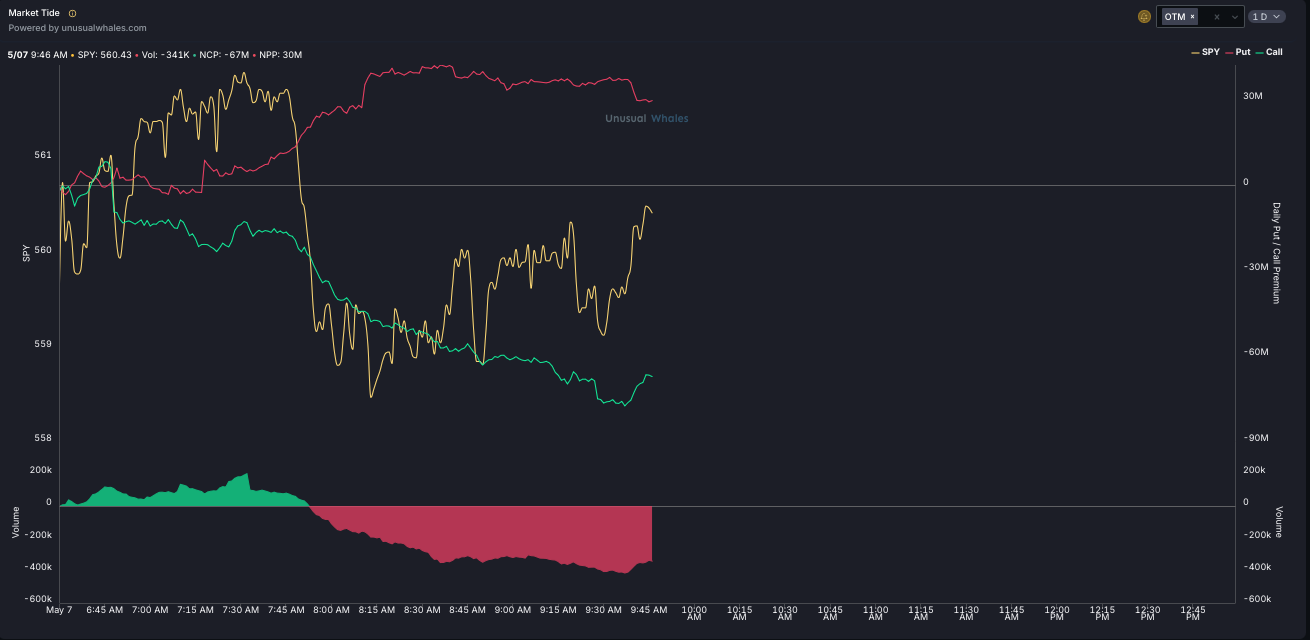
Flow is bearish even when PA turns bullish, and remains elevated. The nuanced interpretation here is key: this isn't a red-alert signal but more a marker of expected volatility elevation. It's likely a put elevation, not a clean directional lean.
Why? All my primary flow screeners are ringing bullish. So this isn't a warning—it’s a learning: markets may whipsaw through FOMC, and large players are preparing for volatility rather than certainty.
1. 🧭 Macro Environment into FOMC
Markets are heading into this week’s FOMC with:
Disinflationary trends (CPI softening)
Surprisingly resilient labor data
Mixed forward earnings guidance
High VIX OI and elevated gamma at key levels (SPY 560, 570, 580)
Expect Powell to thread the needle: remain cautious about inflation persistence while hinting at timeline flexibility. This likely fuels whipsaw reactions unless paired with clean data flow.
2. 🧨 SPY Gap Risk: Watch This One
SPY has a massive downside gap to ~520. If selling intensifies—especially on macro disappointment or outsized reactions—this is the target they can start filling quickly. Clean air below 542-538.
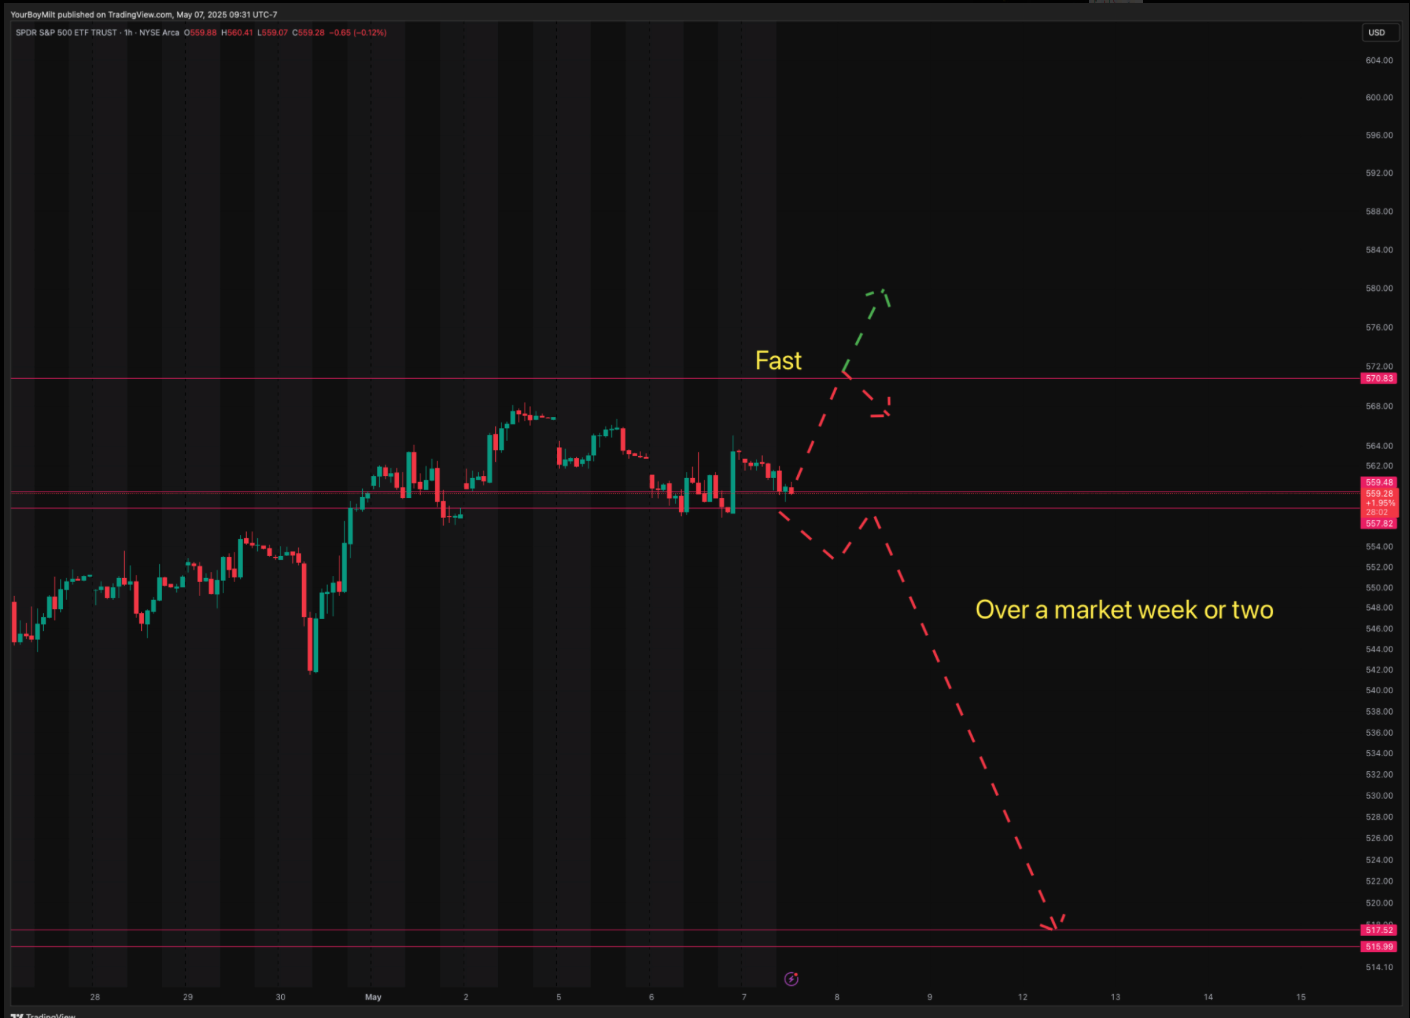
3. 📈 SPY Key Hourly Trends
We're hovering at the mid-trend decision zone.
Hold above 560 → tag 570 quickly ("fast").
Lose 556/554 zone → waterfall possible over a market week or two.
Hourly chop reflects indecision → FOMC likely resolves it.
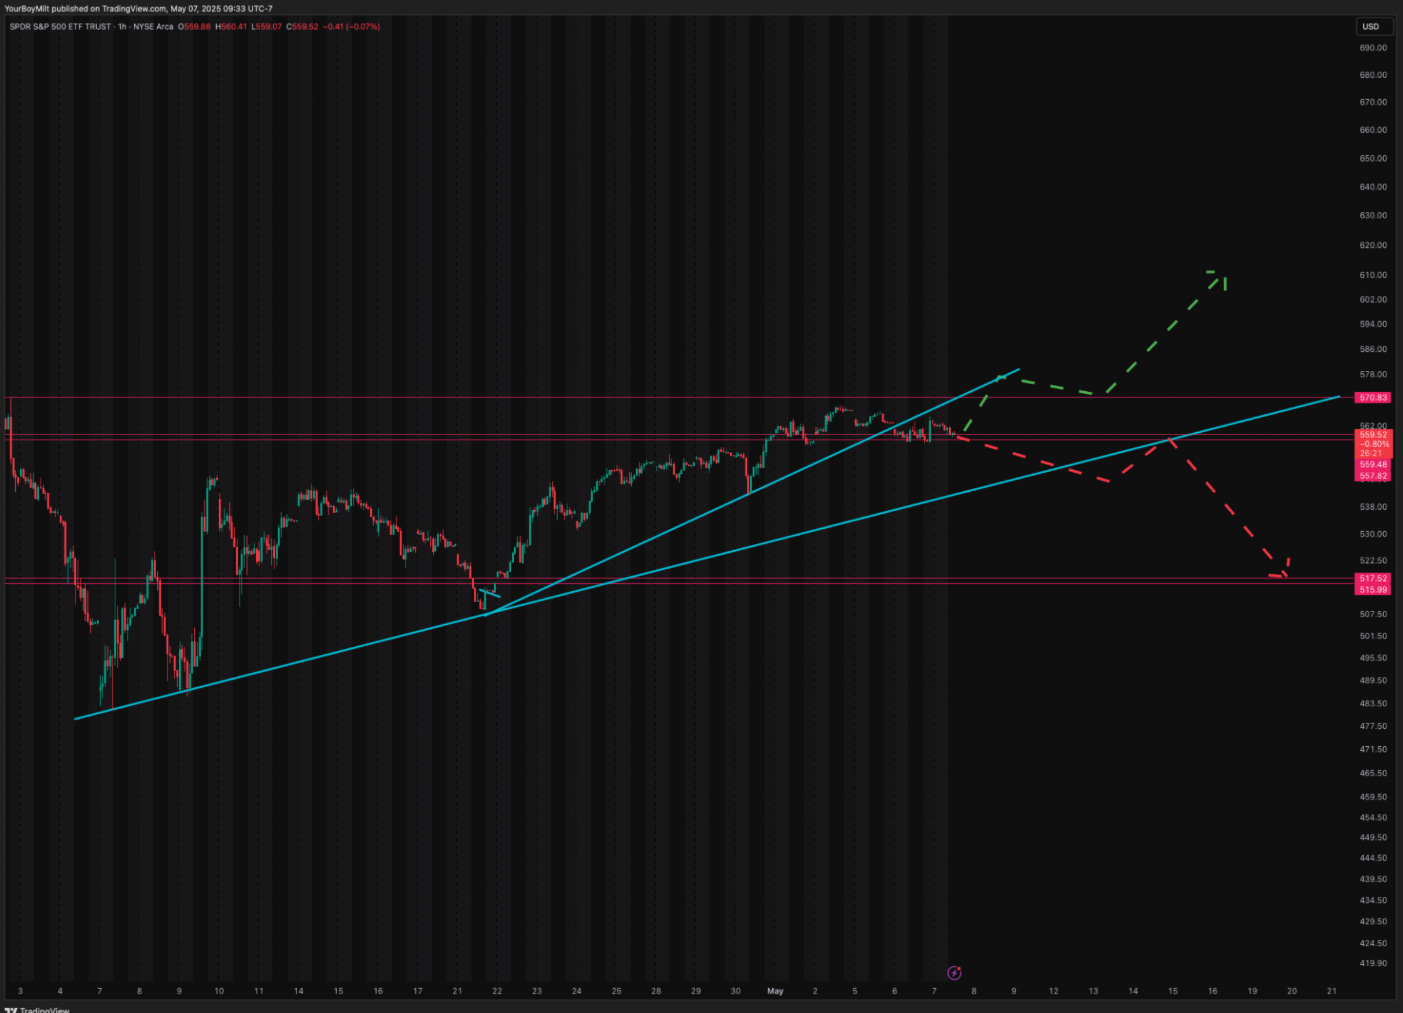
4. 🧲 Monthly Levels – These Stick Like Magnets
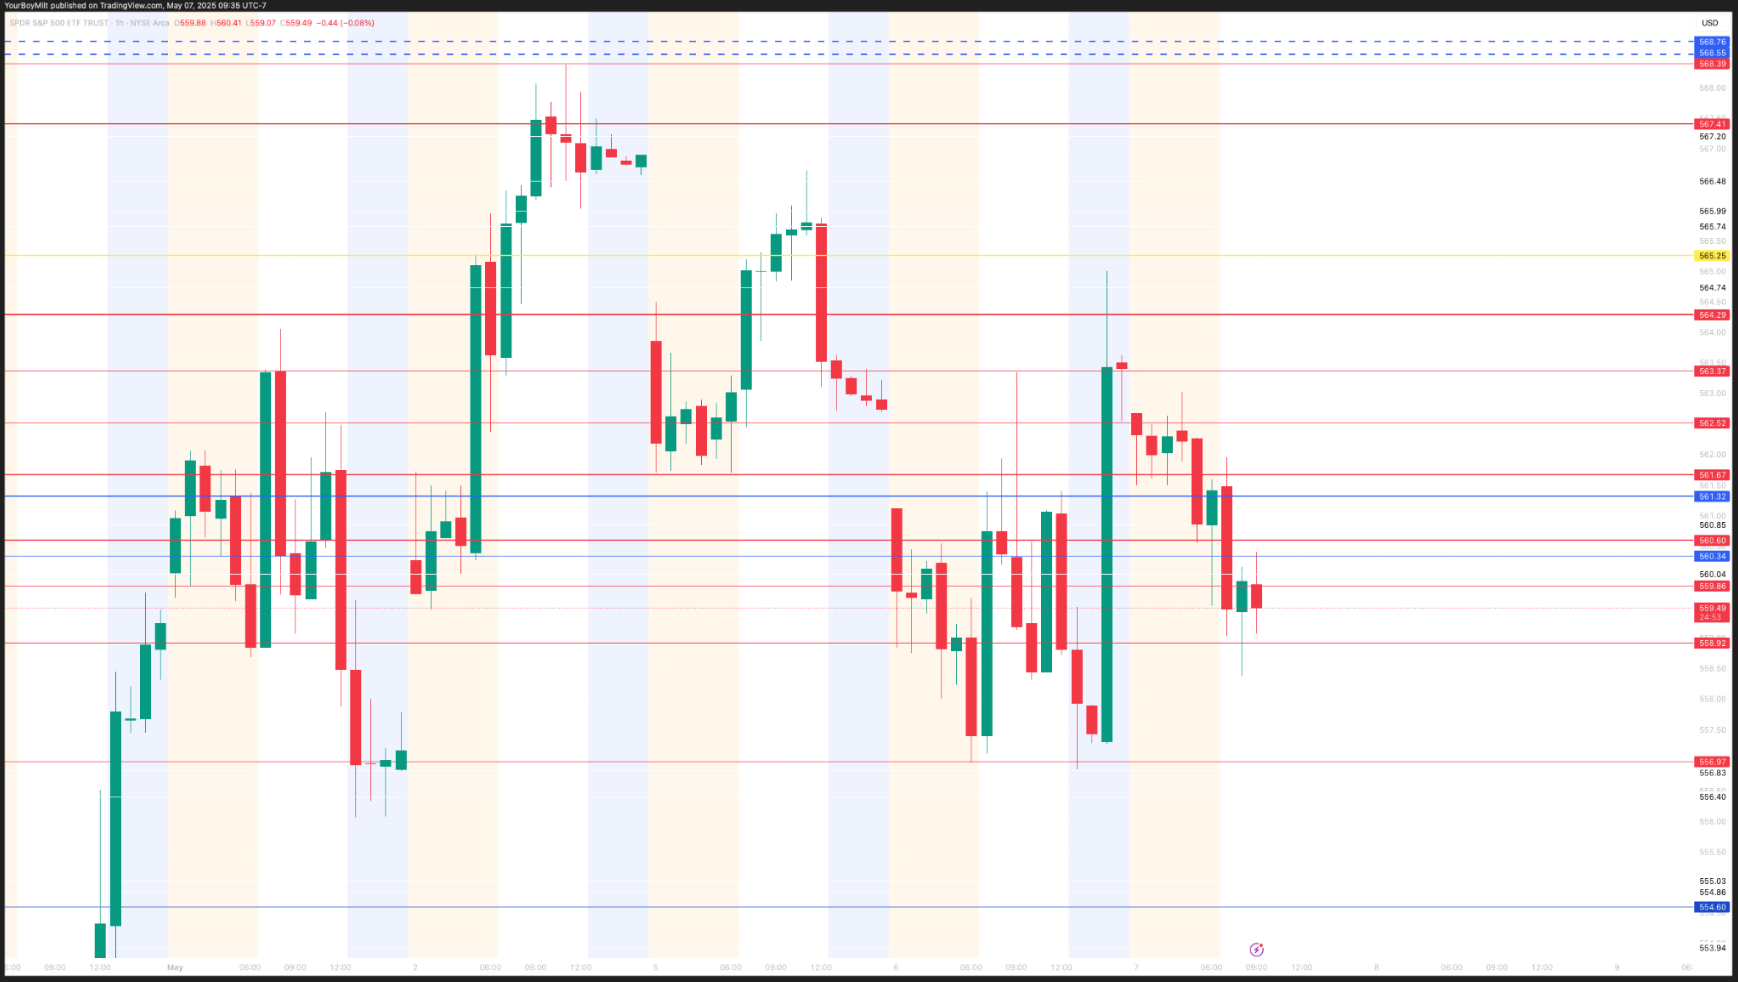
Monthly levels shown in red — price tends to gravitate and pin to these in volatile environments.
➡️ How to use:
Drop to 5-min or 15-min to watch for flags forming through a level.
If it cleanly consolidates and holds above (or below), expect continuation in that direction.