
⭐️ YEET Friday Night Lights: Spotlighting the Flow and Charting Behind the Biggest Plays This Week
How good things happen---explained.

⭐️ YEET Friday Night Lights: Spotlighting the Flow and Charting Behind the Biggest Plays This Week

This week was about combining flow intelligence + chart structure to anticipate and hit the biggest moves of the week.
What makes it special: every single method below was taught HERE inside YEET and then confirmed in real-time by the market.
Most of these apply to all unusual options flow and charting — YEET Plus just packages them for you into Orange Swan, SPY Magic, Nautilus, People’s Screener Ultra, etc.. If you have your own filters and such, you can use these methods
1) 🟧 Orange Swan — Predicting the Dump Before It Happens
Concept
Orange Swan measures the direction, extremity, and clustering of extreme OTM flow prints. Low readings (below ~2) signal institutional bearish aggression.
Example from the YEET
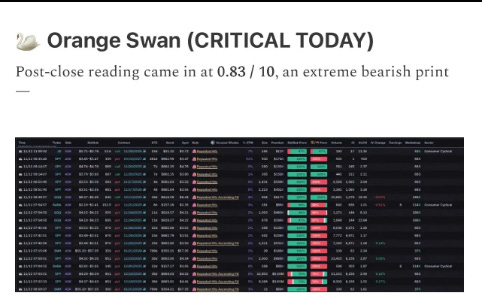
On Wednesday, the YEET Orange Swan hit 0.83 / 10, which we called out as “an extreme bearish print.” That reading told us a massive selloff was coming.
📄 Reference: “Bear To The Future” issue
Real-Time Validation
The very next morning:
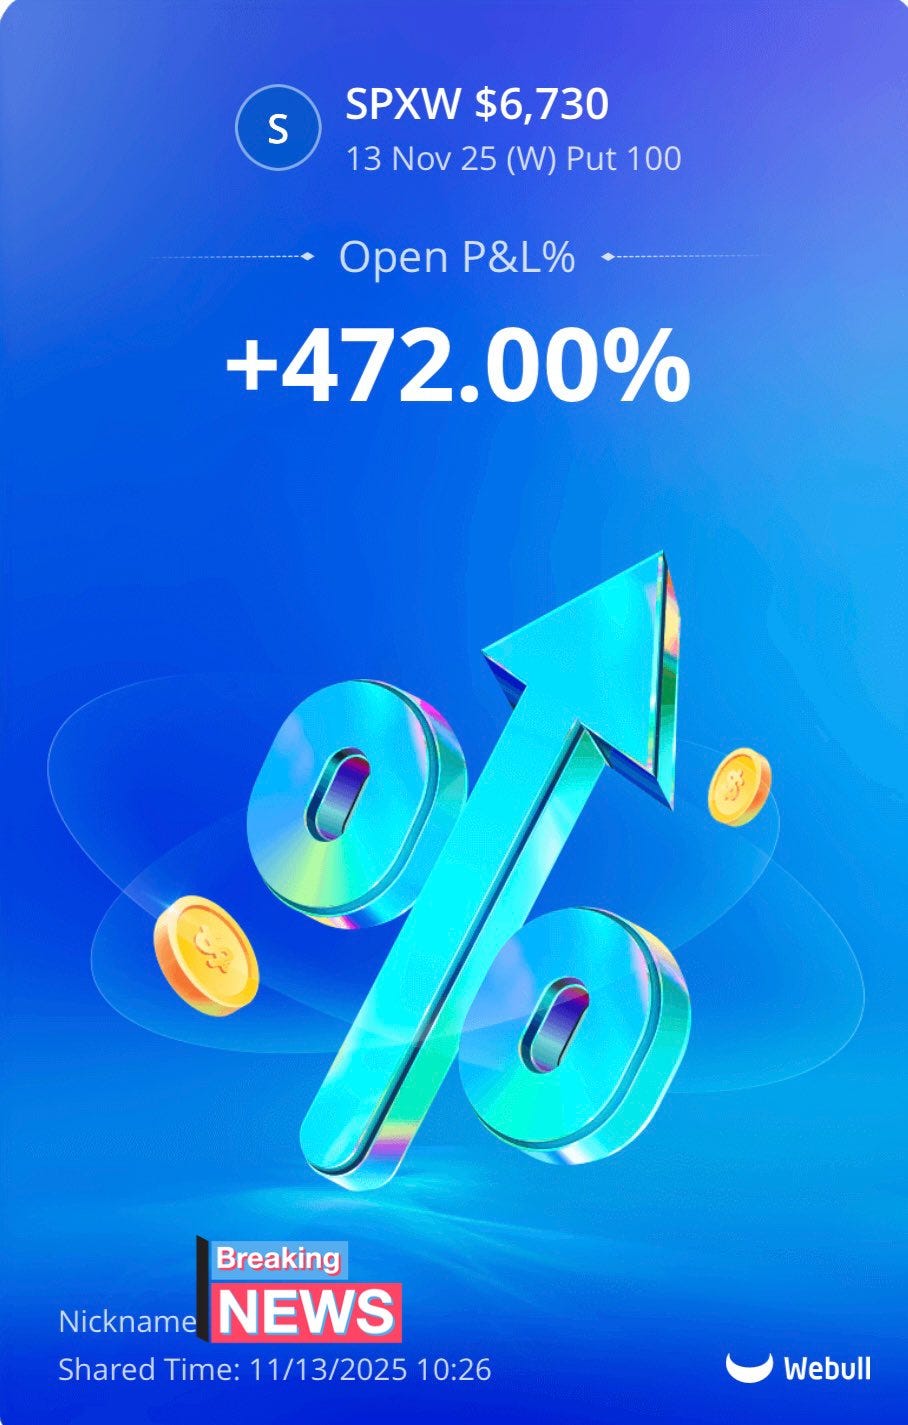
SPXW $6,730p 11/13 play went +472%, the exact scenario Orange Swan is built to anticipate.
💡Bonus Application
When SPY has downside gaps, a heavy Orange Swan reading often precedes the gap-fill move, letting you position early.
YEET Plus subscribers get Orange Swan every day via Discord + Substack Messenger.
2) 🛩️ The Flying V — Calling Bottoms With Confidence

Concept
The Flying V identifies bottom reversals when two things happen together:
A downtrend line finally breaks
Index-level OTM flow switches direction (SPY Magic in +)
New uptrend forms
This forms the “V,” giving you a high-conviction early entry.
Example from the YEET
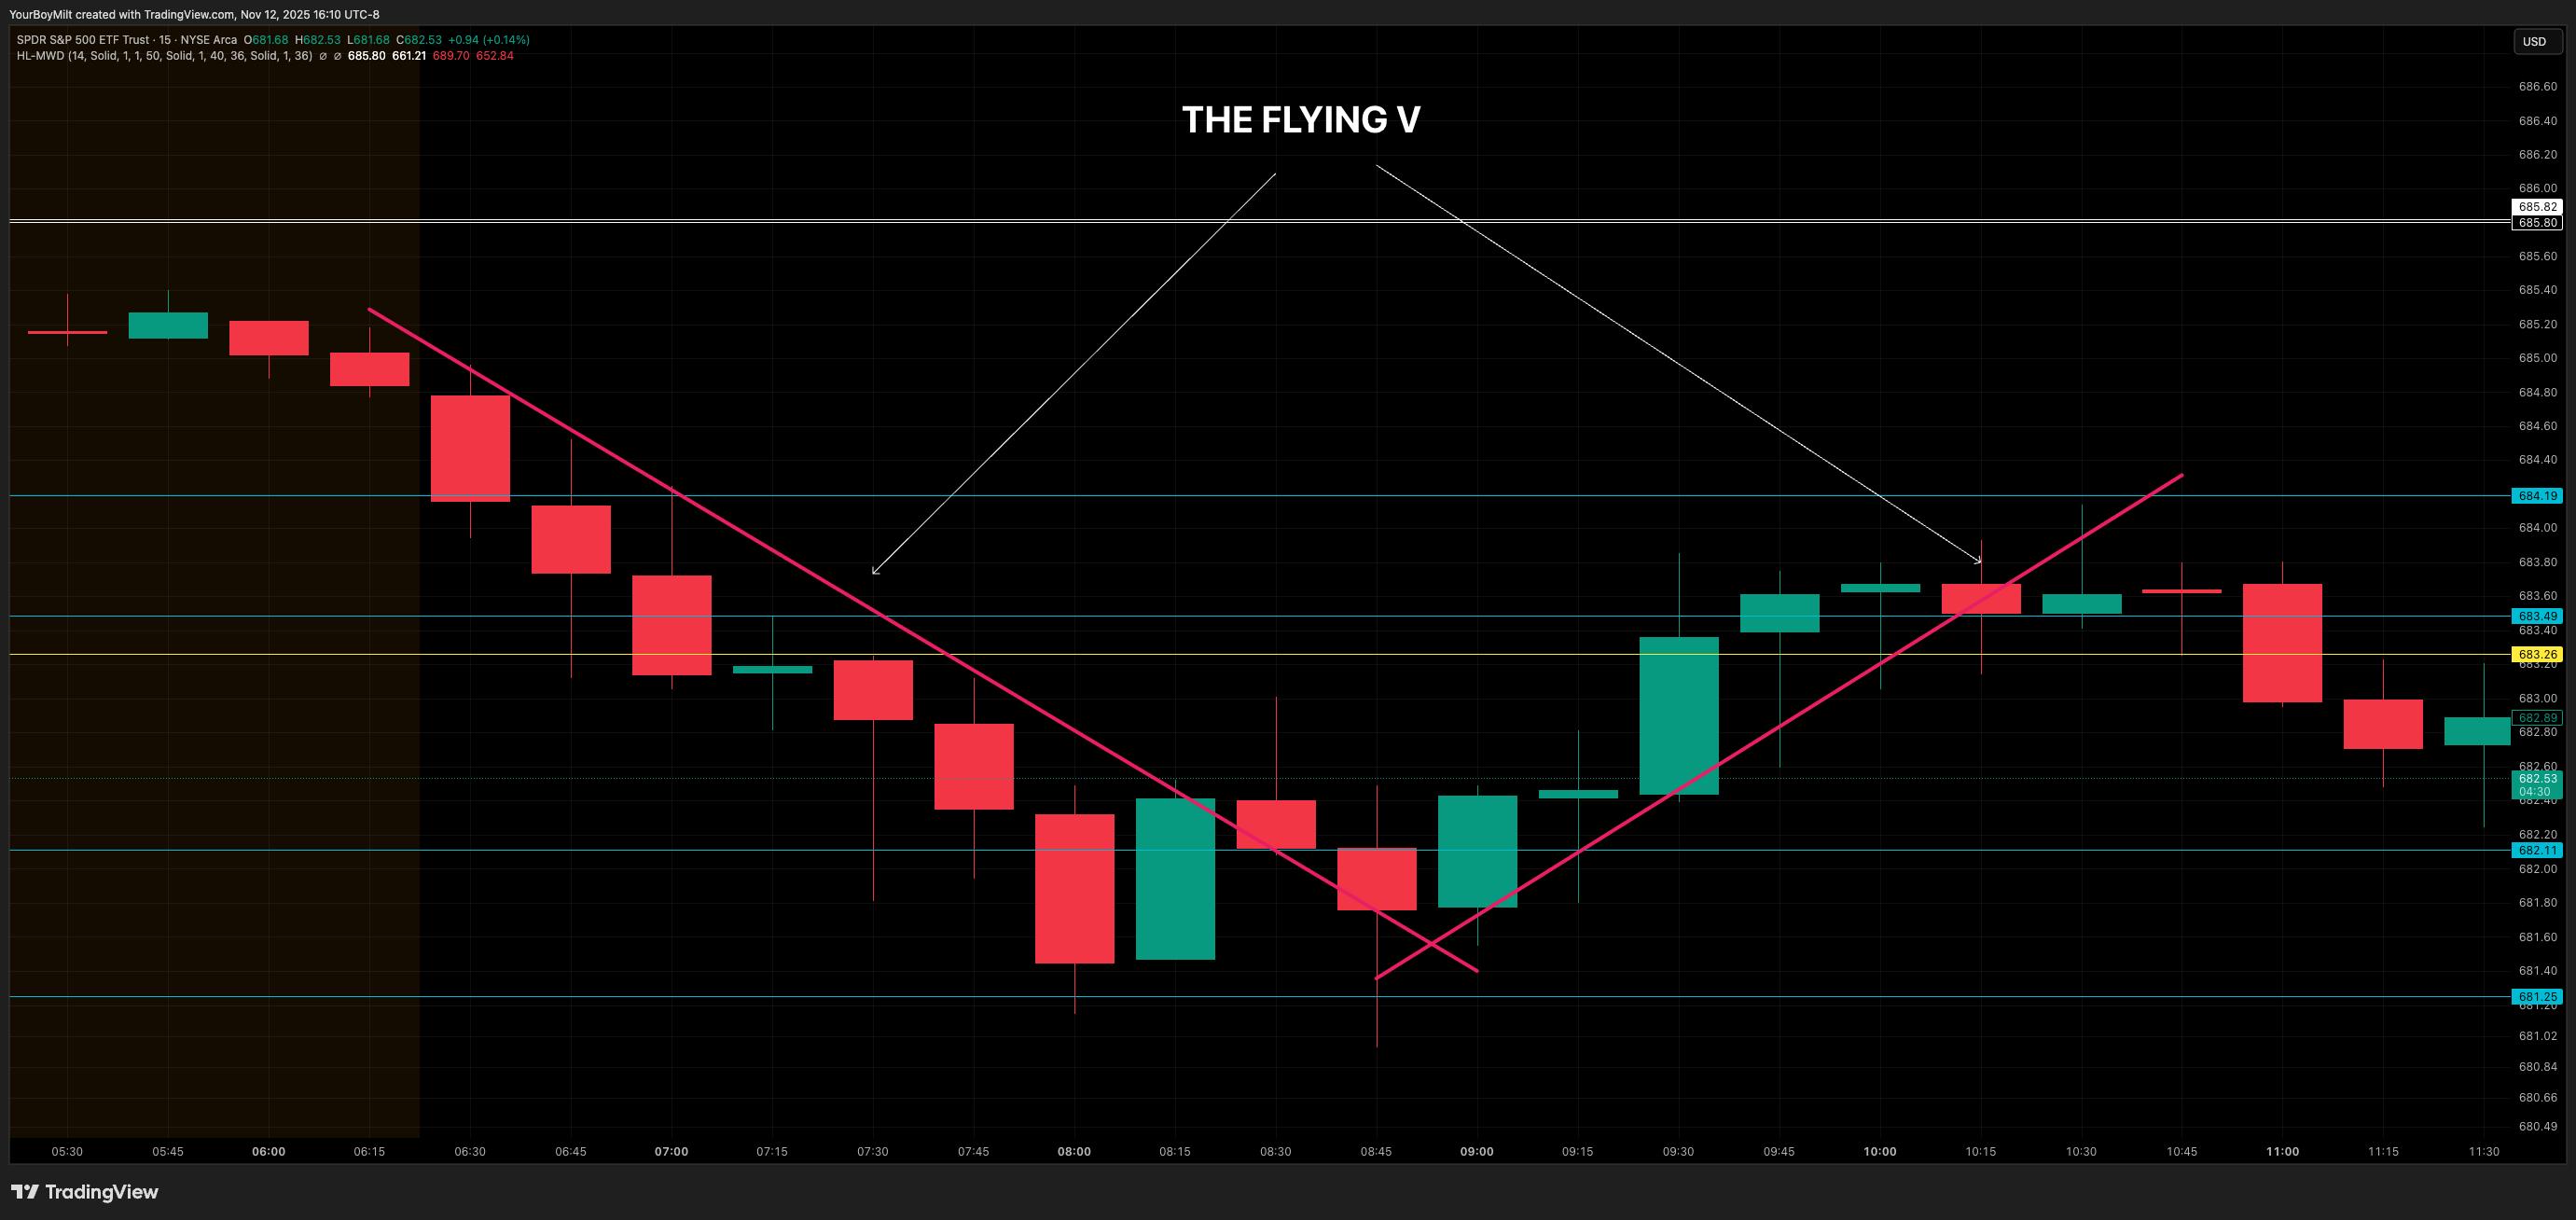
In the Flying V D.D., we showed the downtrend break + flow confirmation that produced a clean reversal setup.
📄 Reference: “The Flying V” issue
Real-Time Validation (Today)
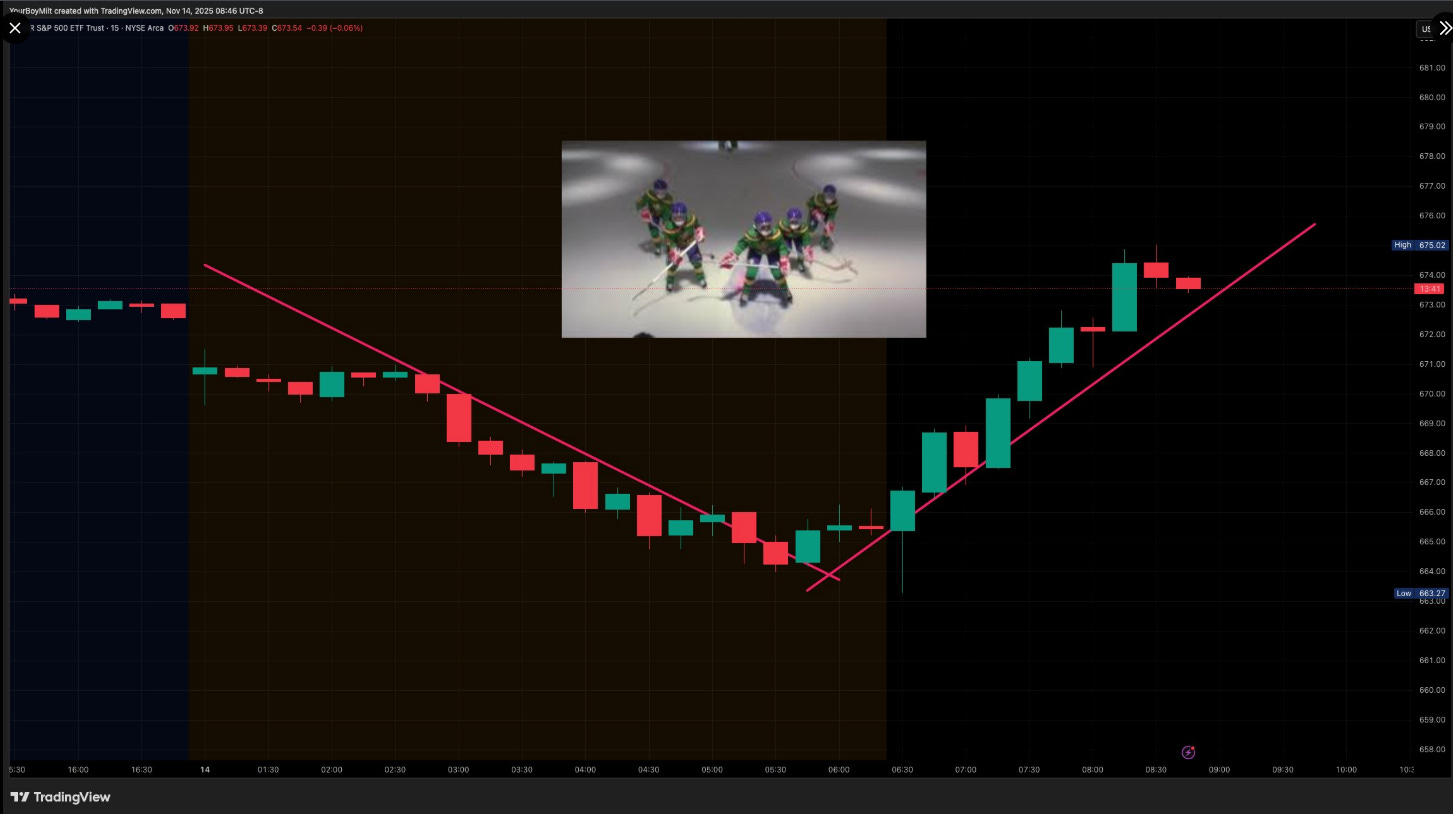
A full premarket selloff, a clean downtrend break, and then a straight-line climb as calls came in.
This is the simplest bottom-catching pattern in trading once you know what to look for.
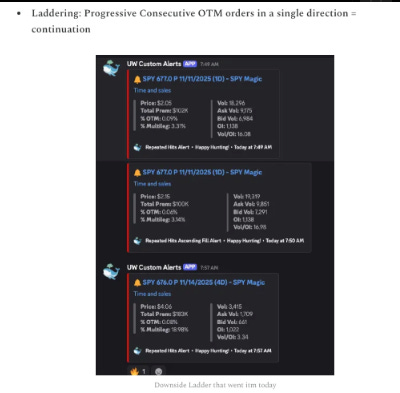
3) 📉 Put Laddering — Progressive Bearish Continuation
Concept
Put laddering is when whales buy progressively OTM puts in a chain, back-to-back.
It signals:
This is different from one big sweep — ladders are intentional and sequential.
📰Example from the YEET
Real-Time Validation (Today)
consecutive OTM prints
each a lower strike
This is textbook ladder continuation.
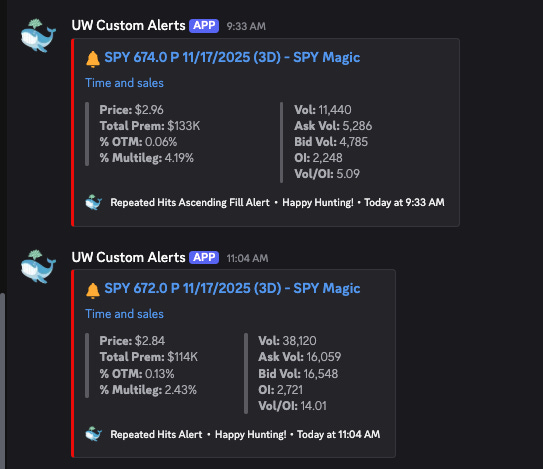
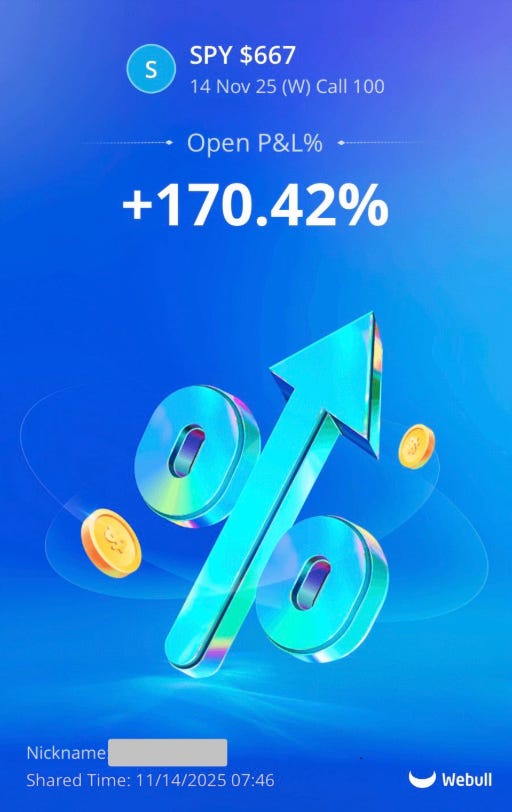
4) 📦 Call Blocks — The Cleanest Form of Bullish Intent

Concept
Call blocks (or put blocks) are large repeated institutional prints with unmistakable direction.
No games, no chop, no randomness — it’s simply:
Block print → direction revealed → follow the whales
The trick is seeing them in the context of the trend, not in isolation.
🥩 Example from the YEET
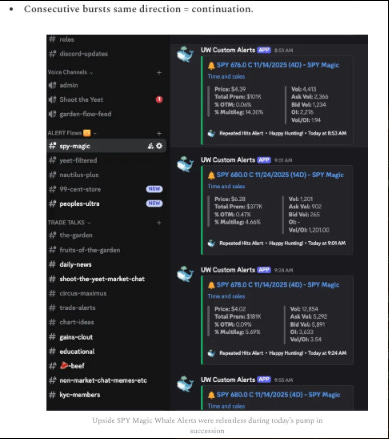
🚀Real-Time Example (Today and Earlier this week)
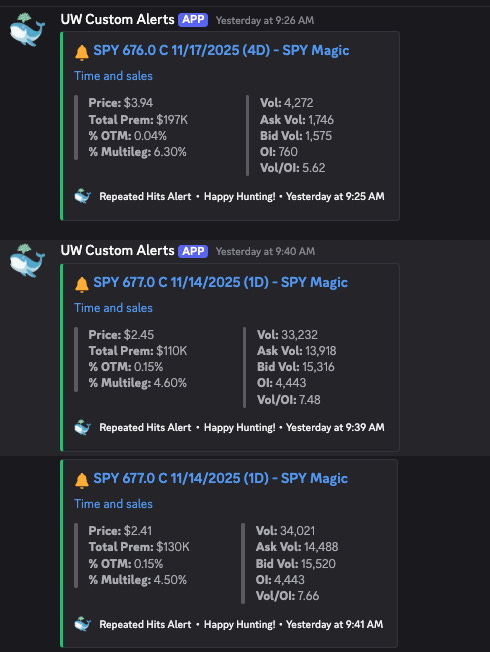
🔮Blocks are the easiest signal for beginners to follow because they remove ambiguity.
5) 🔀 Divergence — When Flow and Chart Don’t Match
Concept
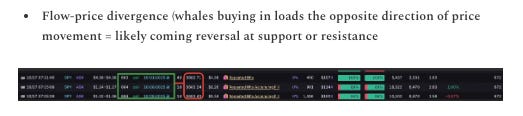
Flow divergence happens when:
chart is trending down
but whales are buying calls, or
chart is trending up
but whales are hammering puts
Divergence usually precedes: reversals
🐻Example From Today (the put ladder was divergent)