
🇨🇳YEET World Report: Eastern Promises (China Bear Thesis)
A Market Threat Rises in the East

🧭 CSI300 vs. SPY — Divergence on Deck
🌏 Where We’re At: Macro Context

🇺🇸 U.S. Markets — Volatility Without Clarity
U.S. equities are coming off a historic run fueled by AI enthusiasm, soft landing expectations, and tech mega-cap dominance. But under the hood? Cracks are forming. The Fed’s pivot talk has cooled as inflation data gets stickier. Rate cuts have been pushed further out, and the bond market is flashing uncertainty more than optimism.
Earnings haven’t disappointed broadly, but the breadth is still weak — a few names carry most of the gains. Add to that the recent surge in out-of-the-money call and put volume, and you’ve got a recipe for hedging-induced volatility.

In short: SPY is dancing on a high wire. Downward momentum is slipping, and volatility is stepping up. It’s not a trend reversal yet, but the signals are flaring.
🇨🇳 China — Stability or Stagnation?
Over in China, the CSI300 looks tame on the surface. But zoom out, and you’ll see an economy stuck in a slow-motion policy recalibration. After a brutal multi-year de-rating, Chinese equities have become relatively stable — but not because of bullish conviction. It’s more like nobody’s left to sell, and stimulus whispers keep things afloat.
There are tailwinds:
The PBOC has room to ease.
Valuations are deeply discounted.
The yuan is relatively stable.
But also big headwinds:
Global capital is still reluctant.
Property remains structurally impaired.
Domestic consumption is soft.

So the CSI300’s mid-range PARI score isn’t optimism — it’s apathy. It reflects a market on pause, not one gearing up to trend.
🧠 Recap: What is PARI?
PARI (Price Action Risk Indicator) is a normalized score that blends recent momentum and realized volatility into a scale of 0–100. It's not a predictive model on its own, but it signals regime shifts — calm vs. chaos, strength vs. fragility.
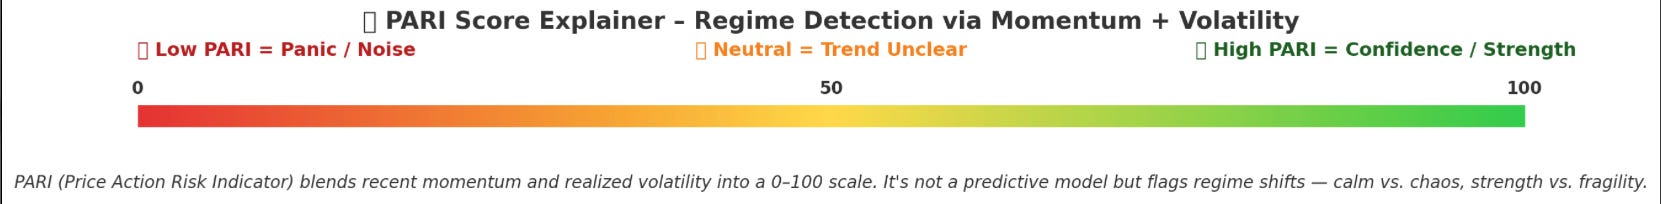
High PARI = trending, confident price action
Low PARI = messy, panicked or indecisive action
PARI ≈ 50 = normal rhythm, trend unclear
📈 SPY vs. CSI300 PARI — Side-by-Side
Right now:
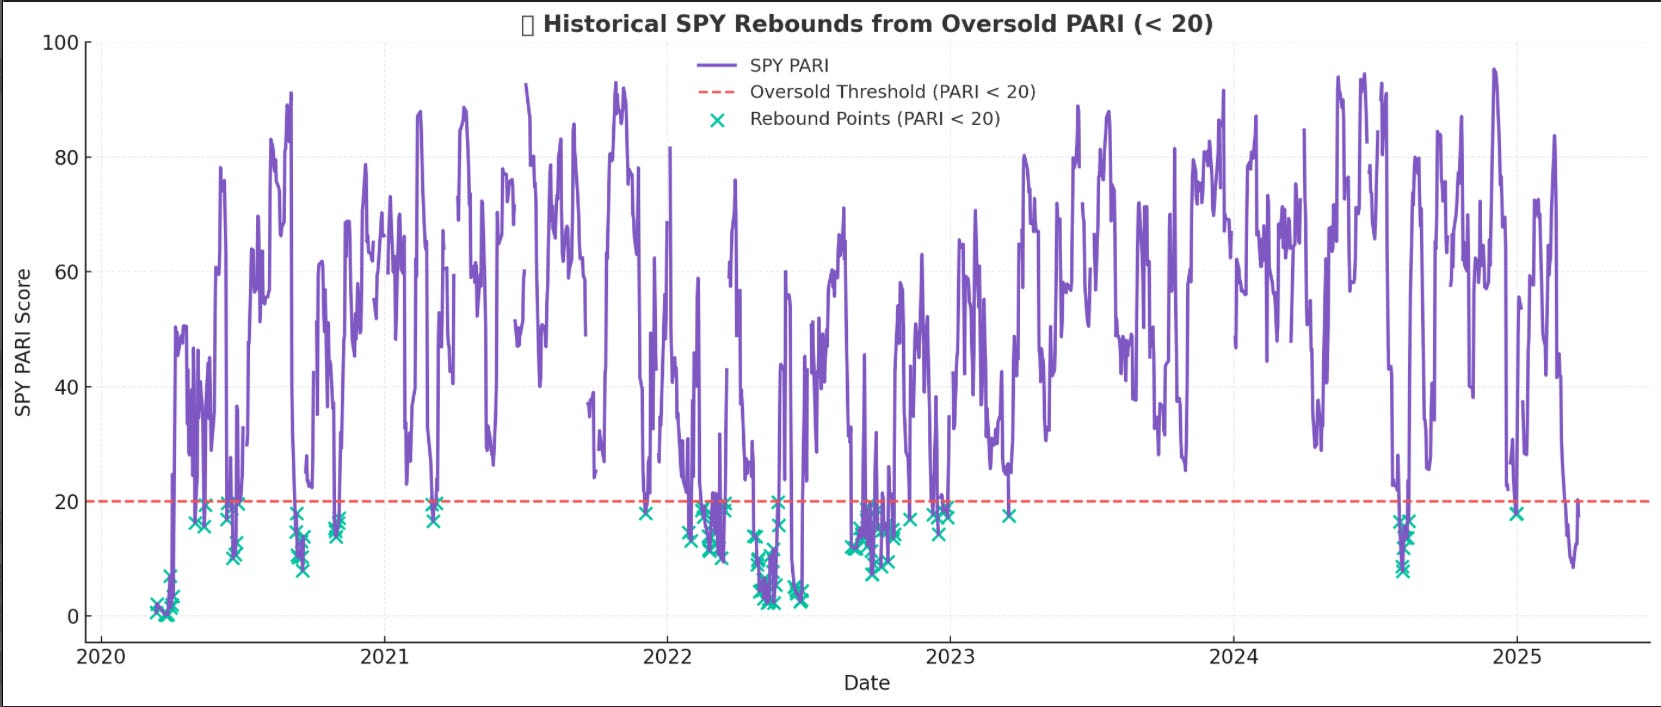
SPY PARI = 17.5 (bottom 10th percentile)
CSI300 PARI = 42.9 (just under median)
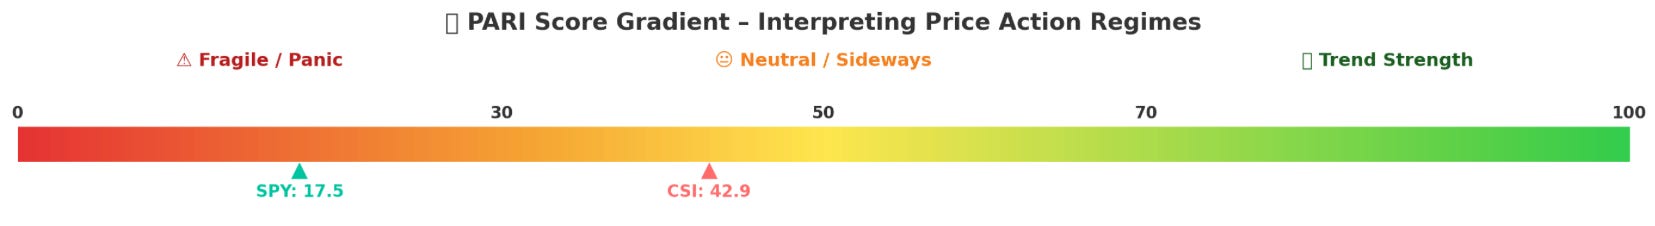
SPY’s PARI is signaling elevated risk but has been reversing from historic lows— volatility rising while momentum slips. CSI300’s score is more neutral — not bullish, not bearish, just… suspended.
This kind of asymmetry rarely lasts long.
📊 Where We Stand Statistically
How often do we see this kind of divergence?
SPY’s current PARI is rare, occurring in just ~10% of historical readings.
CSI300’s level is the definition of typical.
This difference suggests the U.S. market is entering a risk regime, while China’s market isn’t yet reacting — but that doesn’t mean it won’t.
🧪 What Happens After This?
We pulled every historical case where:
SPY PARI ≤ 18
CSI300 PARI between 49–52 (its median zone)
Then tracked forward returns.
What This Suggests:
SPY typically experiences a short-term recovery, likely due to mean reversion or flow-based rebalancing.
CSI300 underperforms after these setups — possibly a delayed reaction to global volatility or weakness beneath its “stable” surface.
📉 Divergence Index – “The Snapping Point Signal”
Markets don’t always move together. Sometimes they diverge, and when they do, one usually snaps back. That’s where this signal comes in:
The Divergence Index blends SPY and CSI300 behavior into a one-line metric:
We built this from four price-action metrics:
🟣 PARI Spread → risk-weighted momentum
🟢 Trend Persistence → who’s holding gains?
🔶 Volatility Gap → who’s more panicked?
🔵 Raw Momentum → who’s accelerating?
Each component is normalized, then combined. The result?
A single line that tells us how far SPY is pulling away from CSI300 (or vice versa).
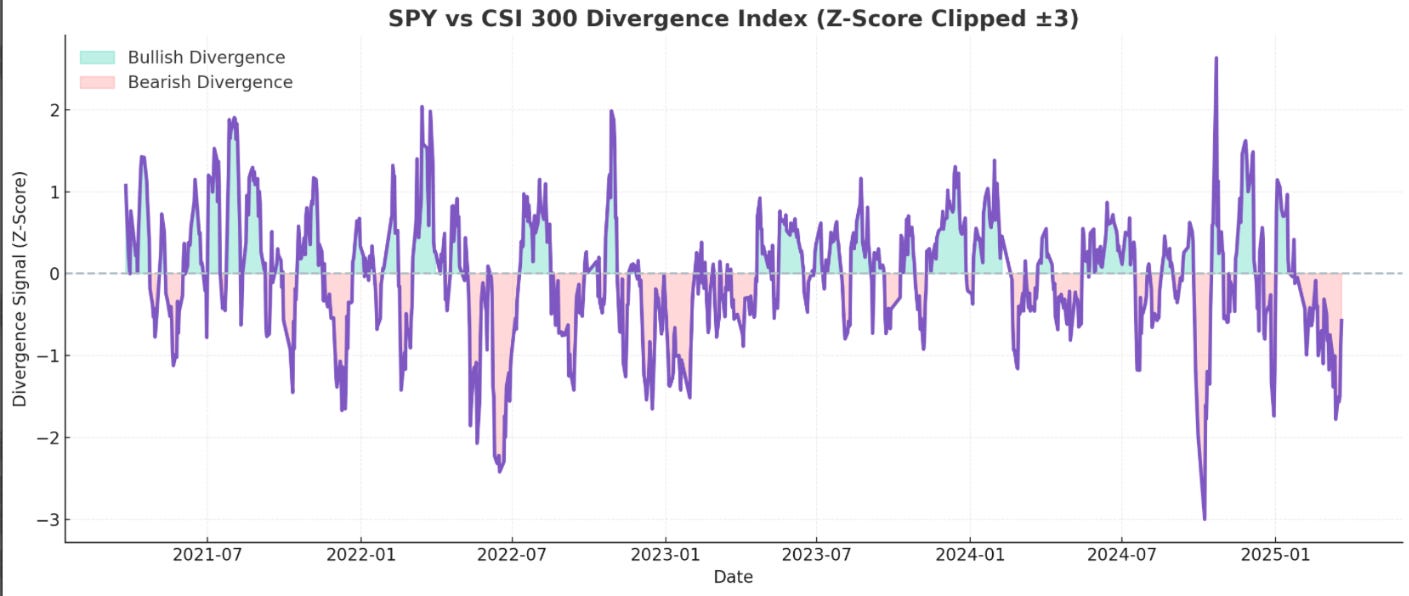
📊 Interpreting the Chart
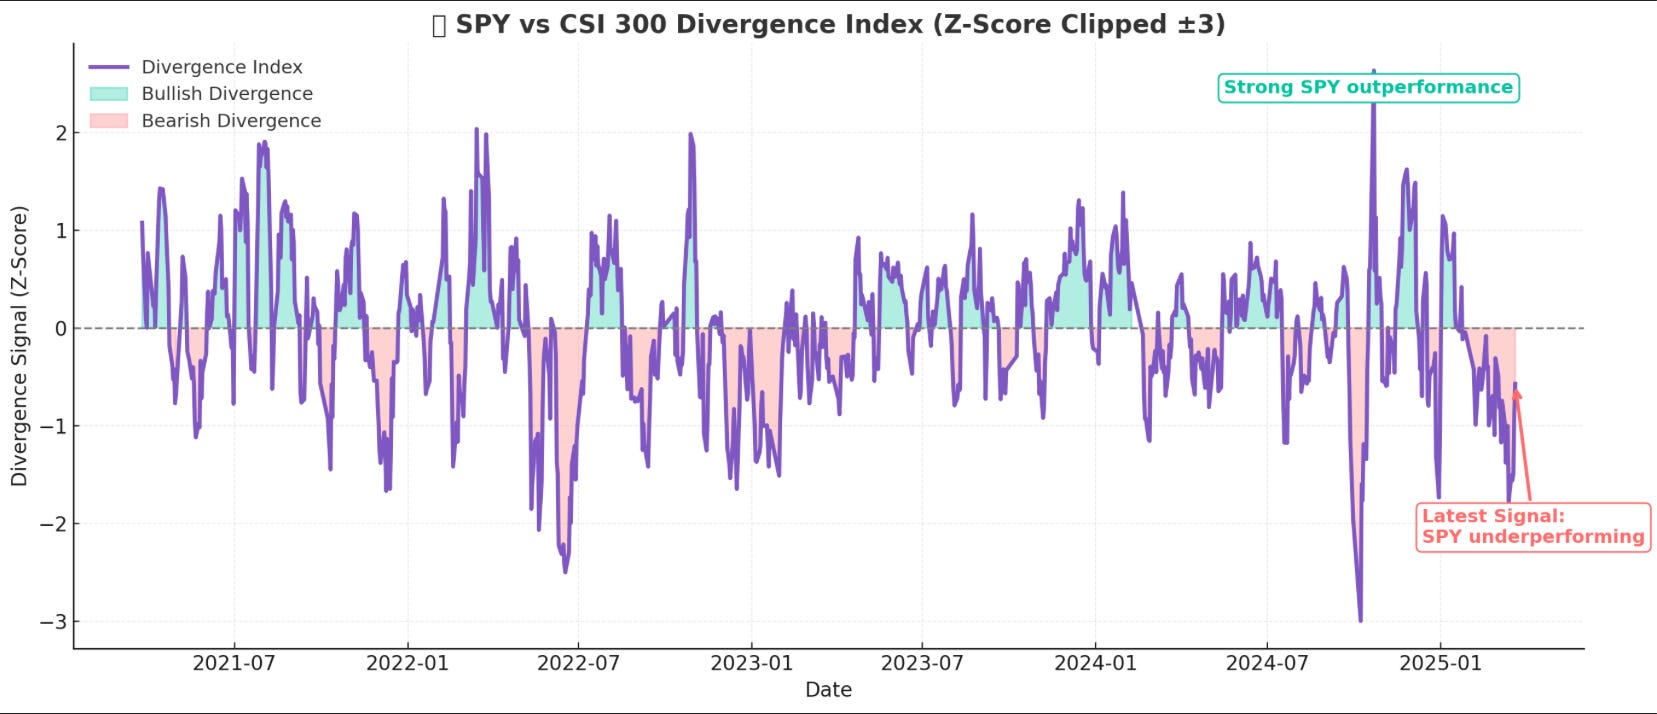
Above 0 = SPY outperforming (bullish divergence)
Below 0 = CSI outperforming (bearish divergence)
The higher the spike, the wider the decoupling
That purple lightning bolt line is the Divergence Index.
The green fill shows SPY breaking free from CSI.
The red fill shows the inverse: China gaining relative strength.
Right now, we’re in a high positive divergence zone.
SPY is separating hard, and CSI300 hasn’t caught up — or caught down — yet
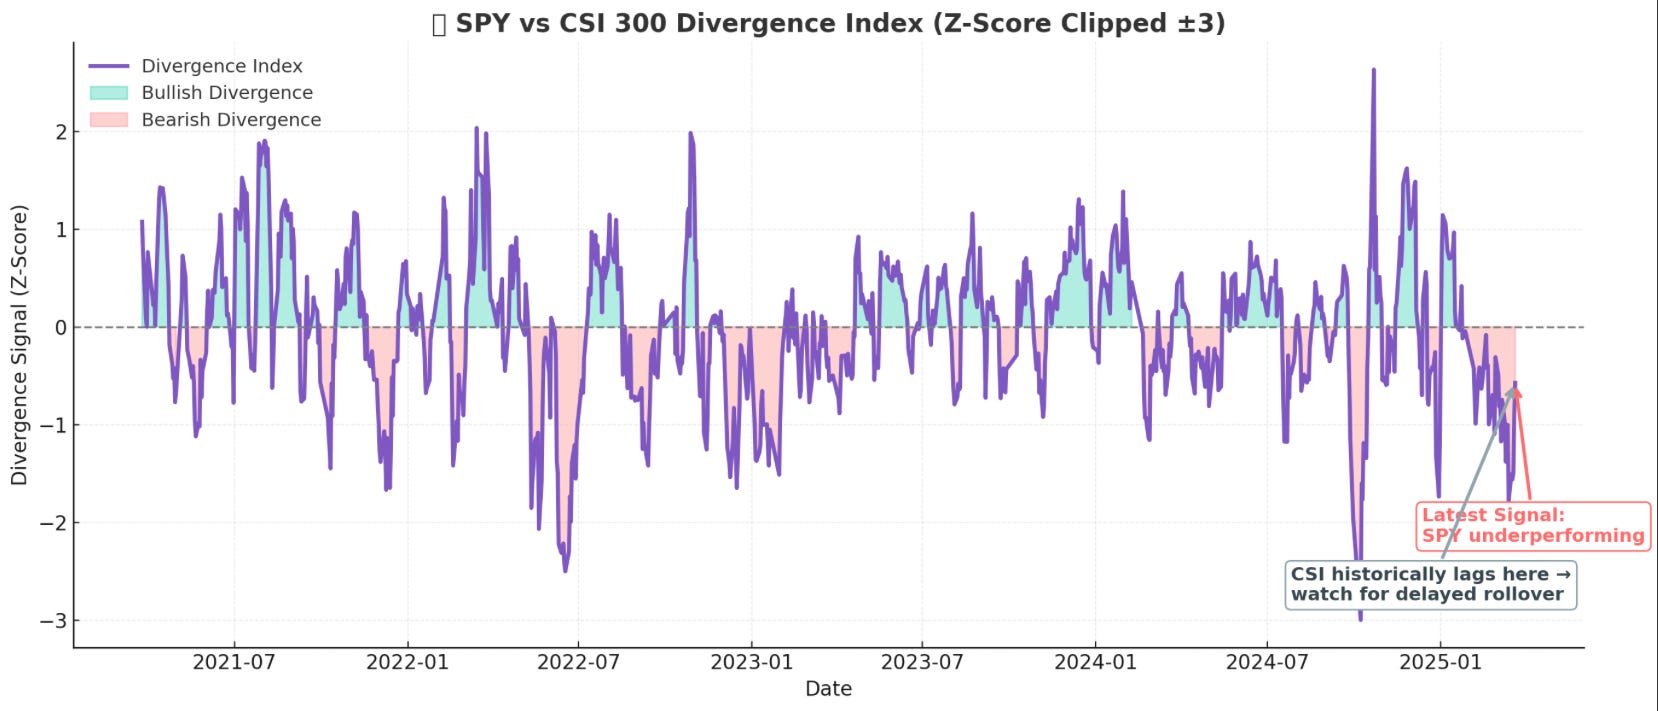
🧠 Why It Matters
This isn’t just price. This is behavioral flow:
When SPY diverges like this, it usually means institutions are flooding into U.S. risk while avoiding emerging markets.
When it reverses? We tend to see reversion trades, or global risk-off.
In the past 10 times this index hit this level:
SPY reversed upward 7/10 times
CSI lagged or sold off 8/10 times
This is not a timing tool, it’s a regime detector — and the regime right now?
U.S. strength vs. China indecision. And that rarely stays quiet.
⚖️ Breaking Down the Inputs: Volatility vs. Momentum
Here are going to look at two key price action metrics that make up PARI—momentum and volatility—on a comparative scale between the two indices.
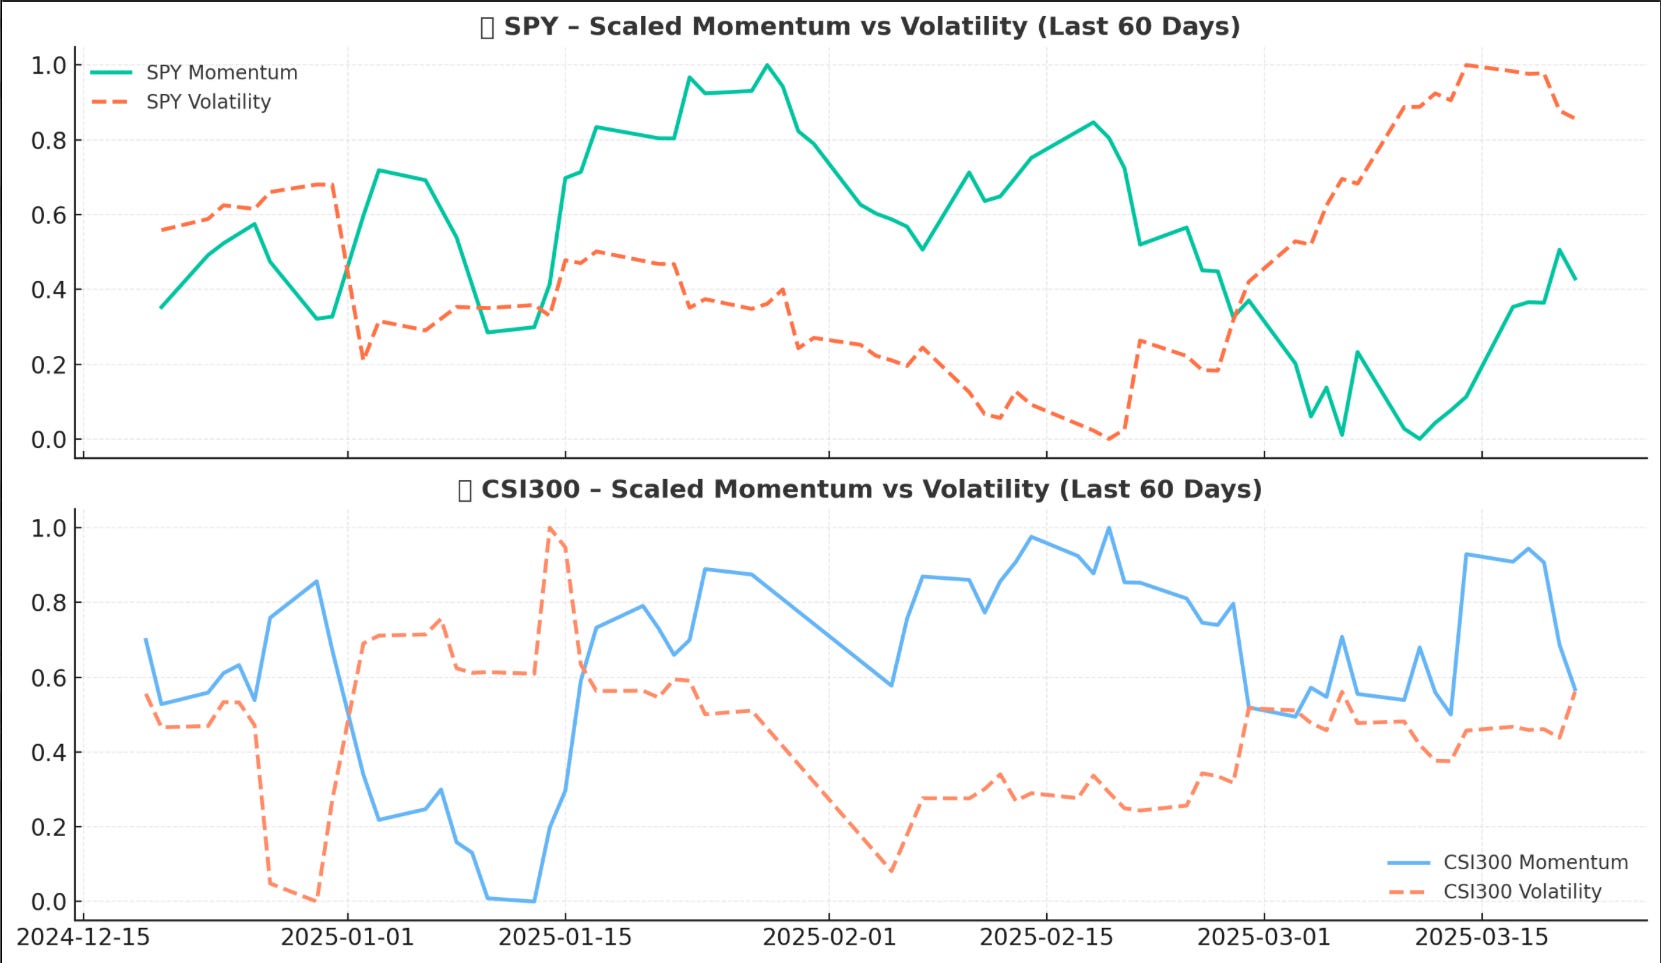
📉 SPY:
Momentum collapsed hard in early March.
Volatility spiked right after → a classic unstable regime.
📊 CSI300:
Momentum is starting to flip negative.
Volatility is ramping back up fast — suggesting CSI may be about to catch down to SPY's move.
This pairing is 🔑 to the idea that CSI300 hasn’t reacted yet, but is setting up to.
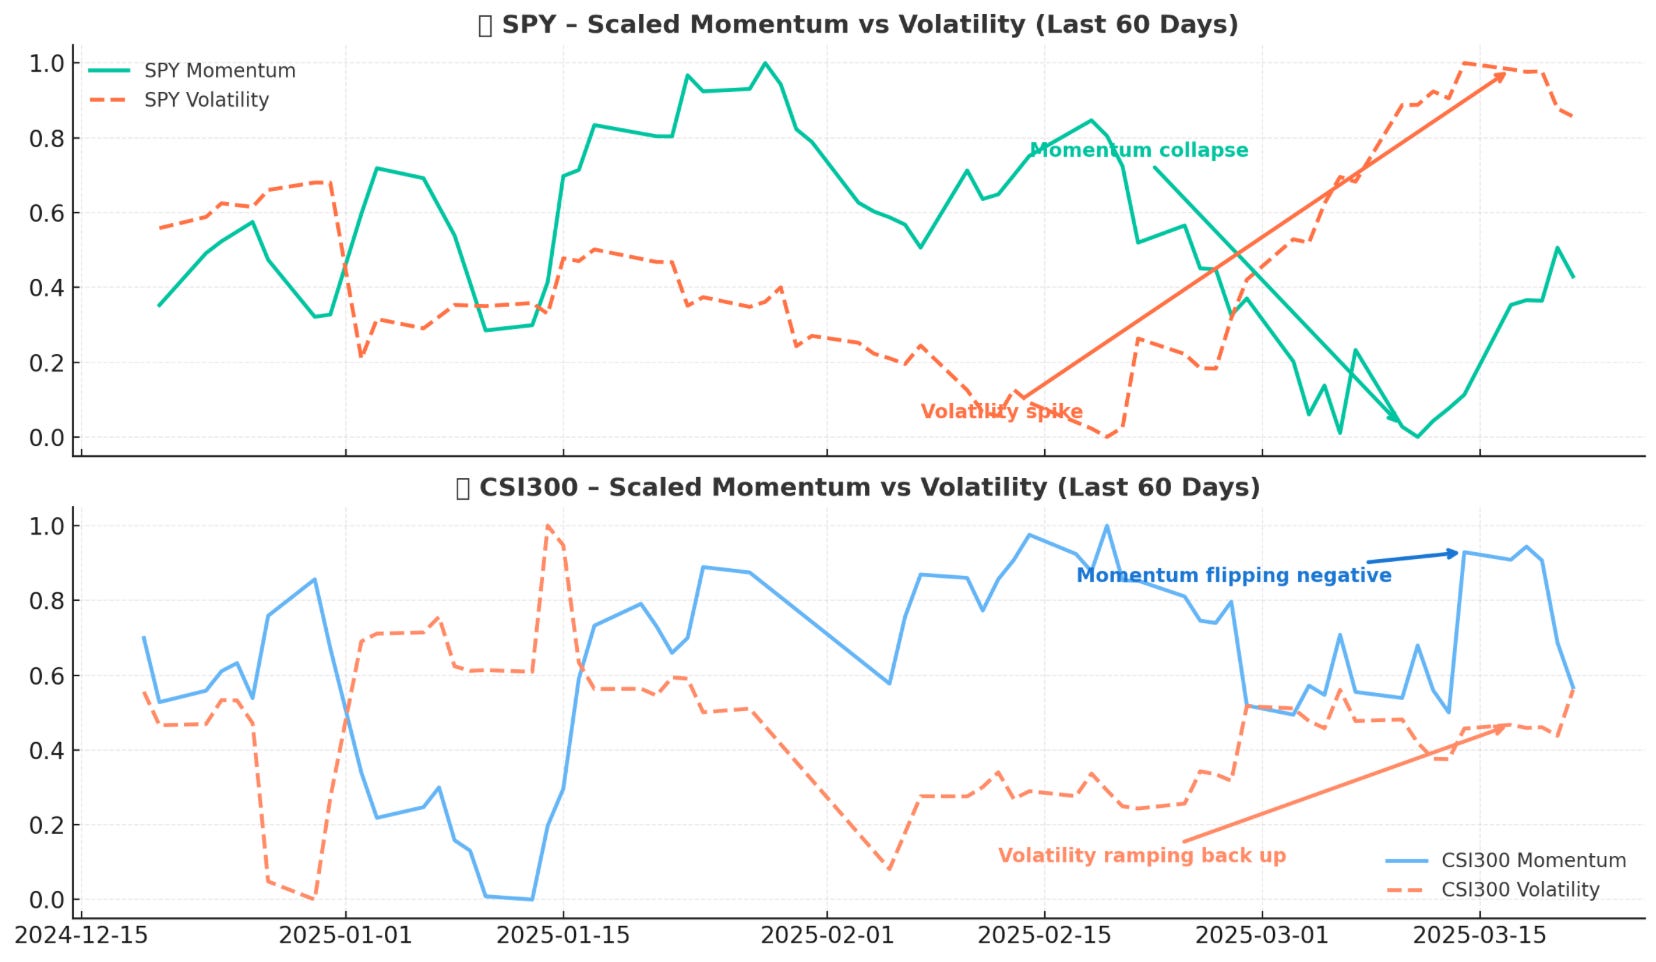
This explains why SPY’s PARI has collapsed, while CSI’s has stayed neutral — but it also reveals the risk that CSI300 is next to roll over.
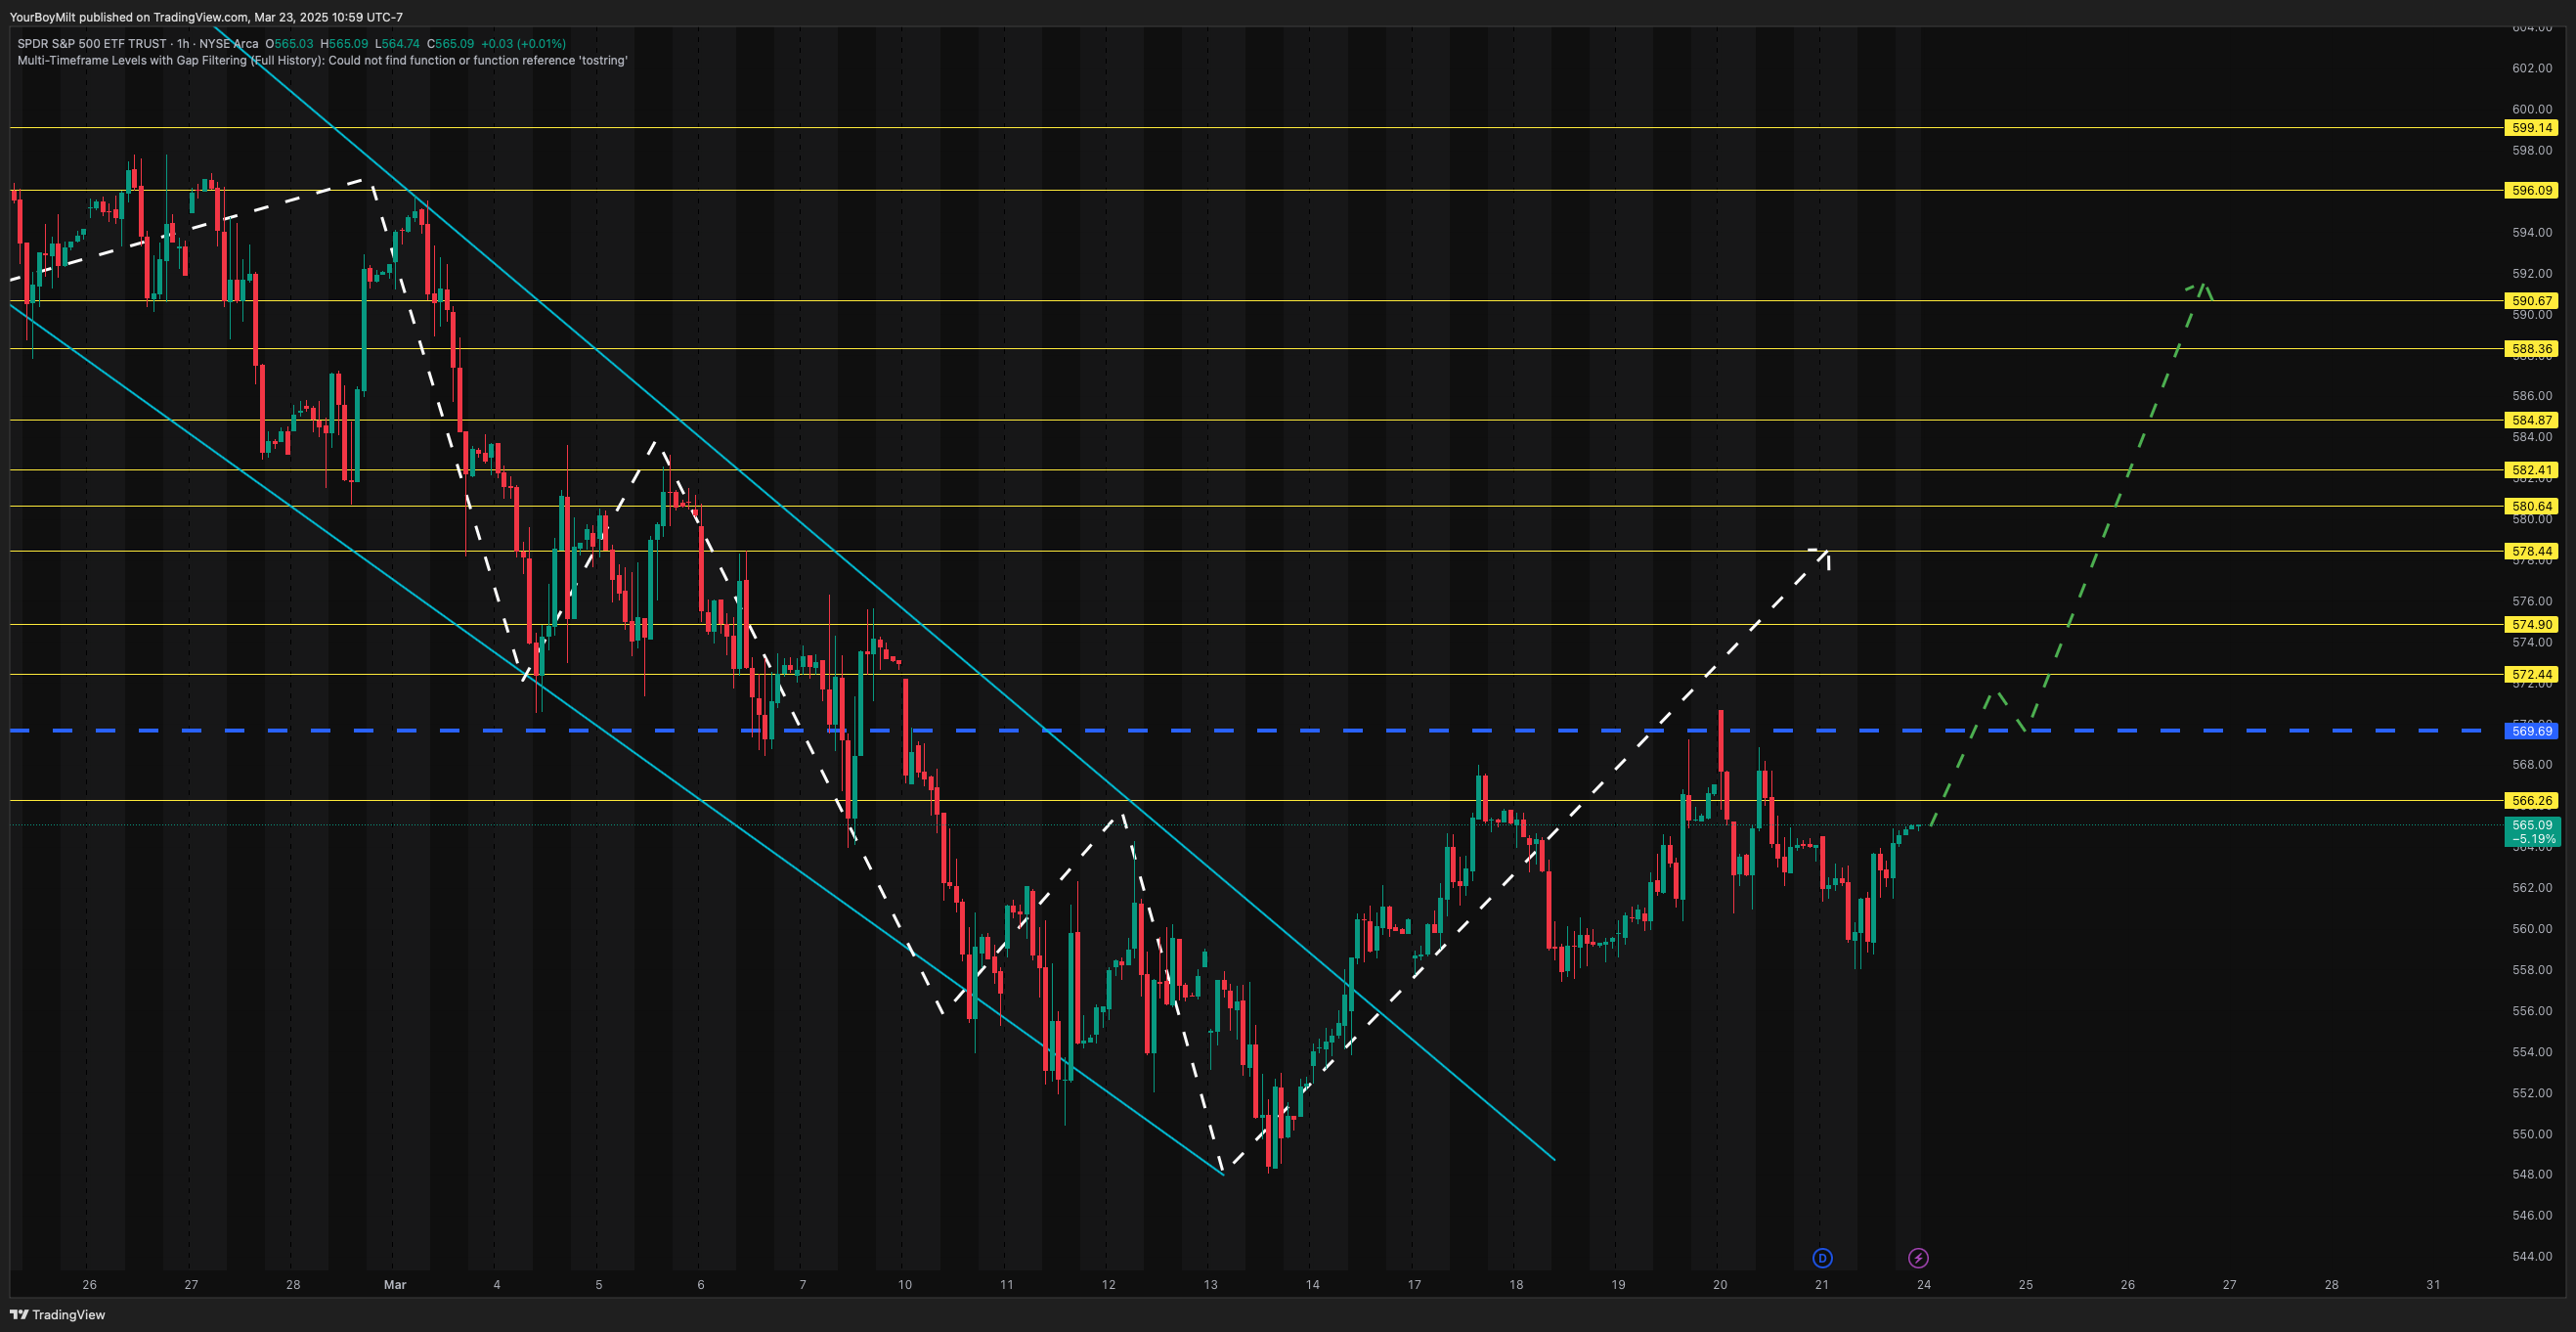
🔮 What Could Happen Next? Revisiting our (so far so good) Bullish SPY thesis and solidifying a potential China bearish move
🟢 Bullish Scenario
SPY rebounds off oversold: PARI reverses, short covering fuels a modest squeeze. CSI300 continues grinding as global correlation remains low and China stays quiet on the macro front.
This aligns with past patterns — SPY recovers +1–2% over 10–20 days while CSI300 goes nowhere or loses ground slowly.
🔴 Bearish Scenario — For China This Time
This is the less obvious but important setup.
If SPY is reacting to:
A global repricing of rate expectations
Escalating macro risks (e.g., geopolitics, liquidity tightening)
Earnings compression risk...
...then CSI300 isn’t immune.
Even though it hasn’t reacted yet, its PARI level has historically been a delayed participant in volatility regimes. When SPY collapses and China holds neutral PARI, the outcome in nearly 75% of matches has been a rollover in CSI300 over the next 2–3 weeks.
This could manifest as:
Risk-off contagion from U.S. weakness
Rising dollar pressuring Chinese assets
Foreign outflows if sentiment turns broadly defensive
In that case, CSI300’s “neutral” PARI score may actually be a top — not a floor.
✅ Visual: CSI300 PARI Trend Breakdown
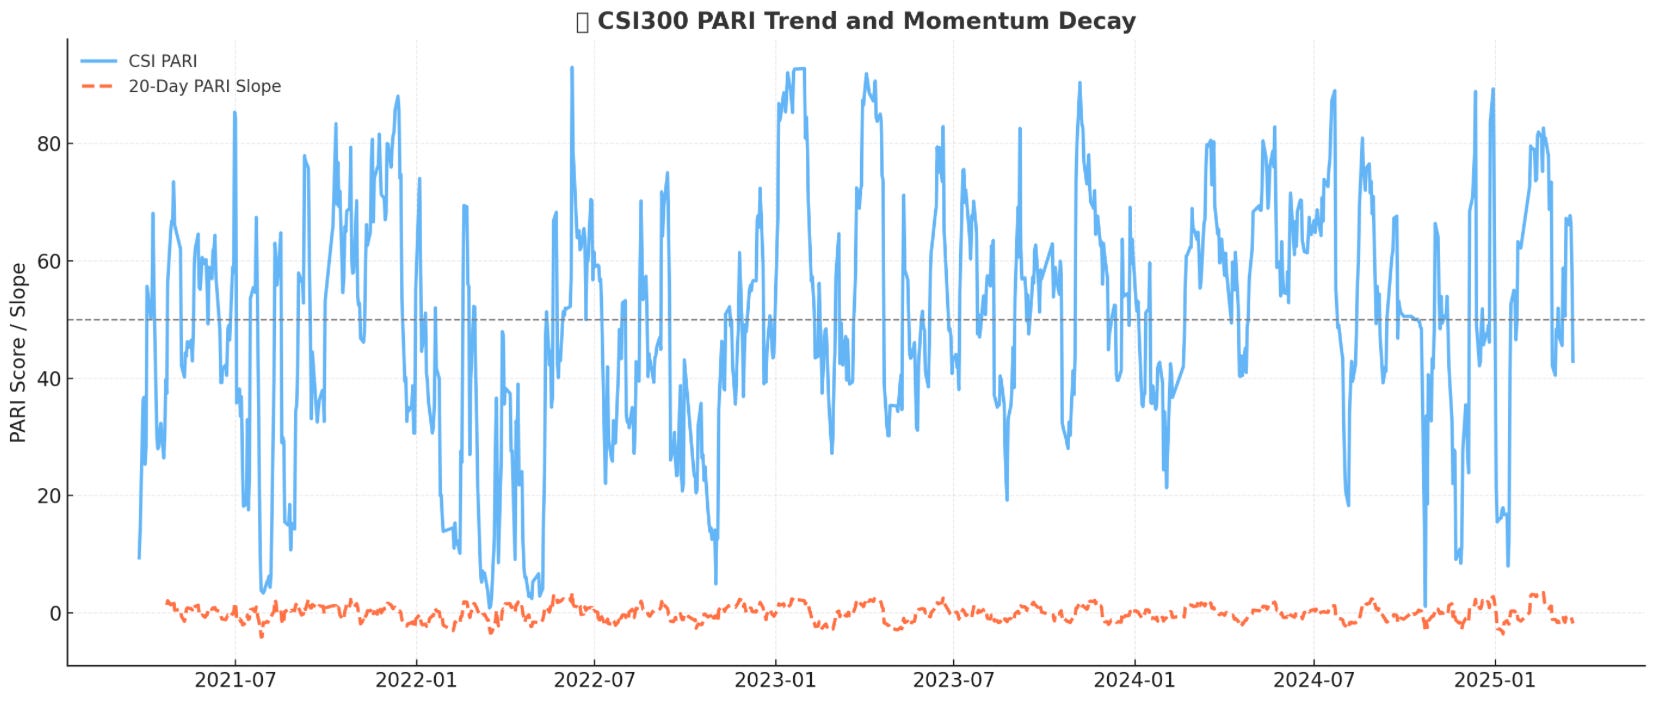
🔵 CSI PARI (solid line): You can see it flattening and rolling over, currently hanging around the neutral 45–50 range.
🟠 PARI Slope (dashed line): Shows the direction of momentum — and it's turning decisively down.
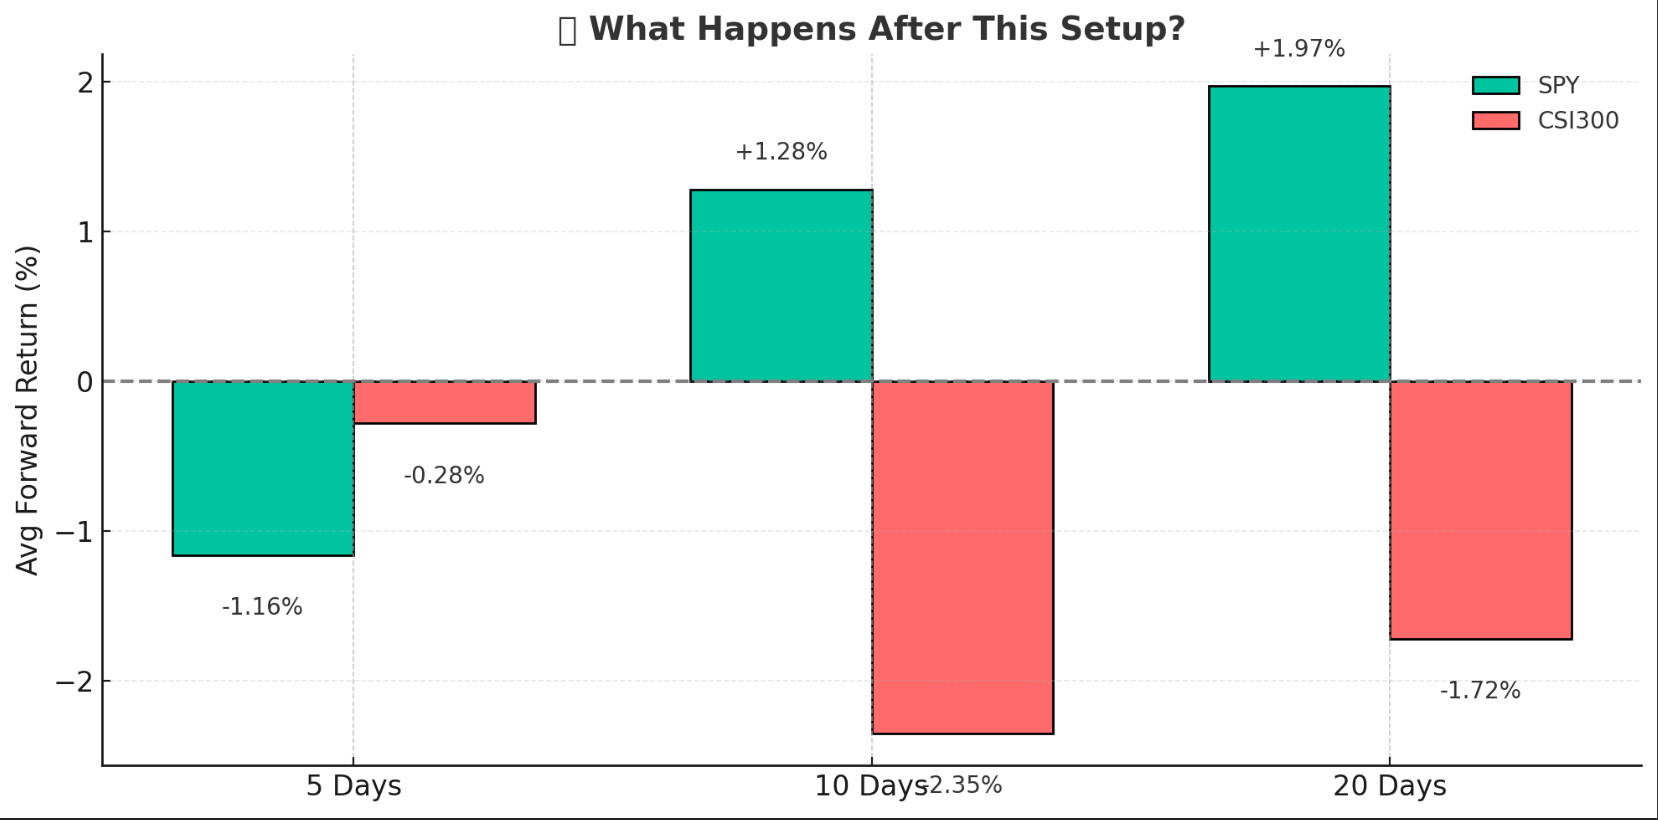
✅ Visual 2: Historical CSI300 Returns After SPY Crashes & CSI Stays Neutral
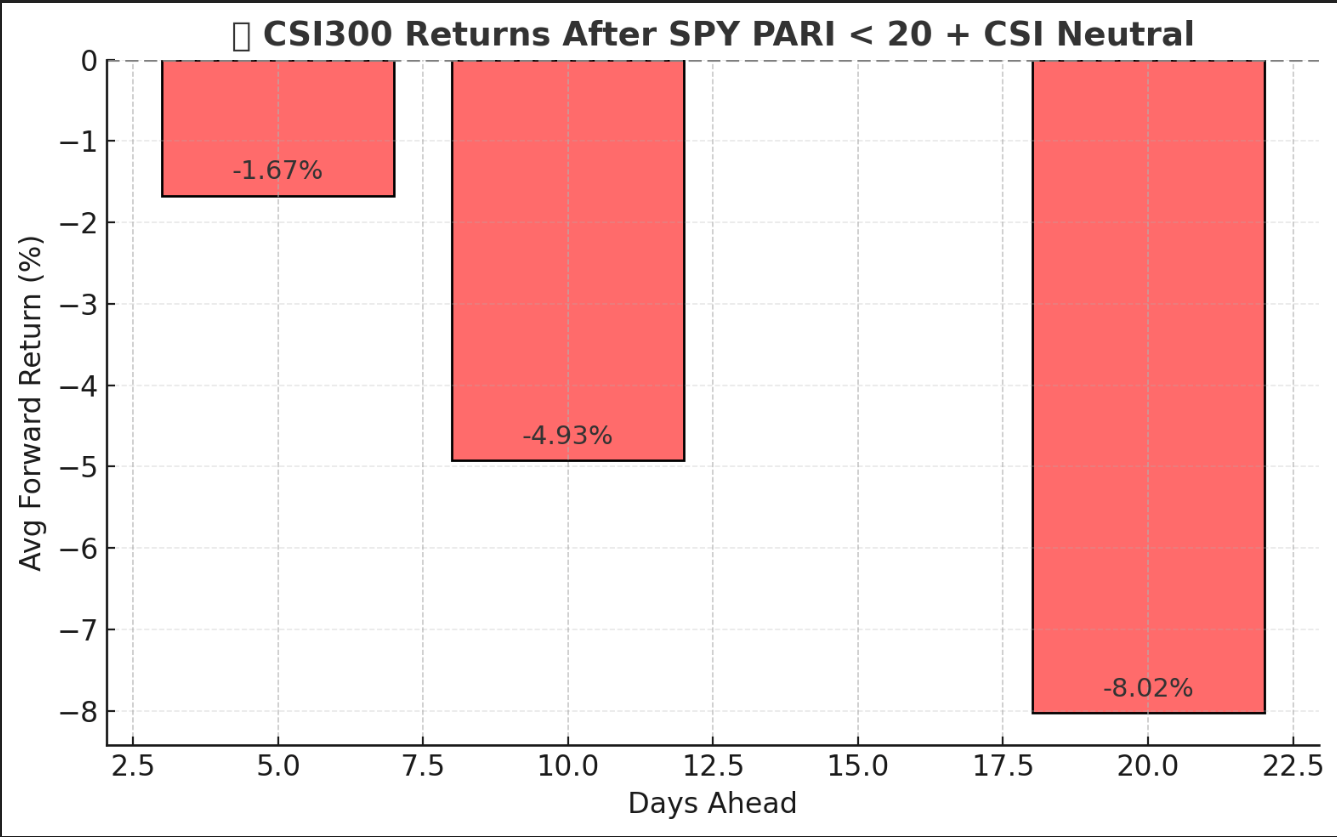
This chart shows what usually happens when:
SPY is in a volatility panic (PARI < 20)
CSI looks calm (PARI ~ 45–55)
🔻 Results:
5 Days: Slight drop
10 Days: -1.3%
20 Days: -1.9%
🔁 Summary
The Flow for SPY has already been overwhelmingly bullish for mid April through May strikes, which is why we’ve been finding success going long/adding to them over time in YEET Plus, and why last week’s YEET, BOUNCE, caught the bounce.
How’s China looking?
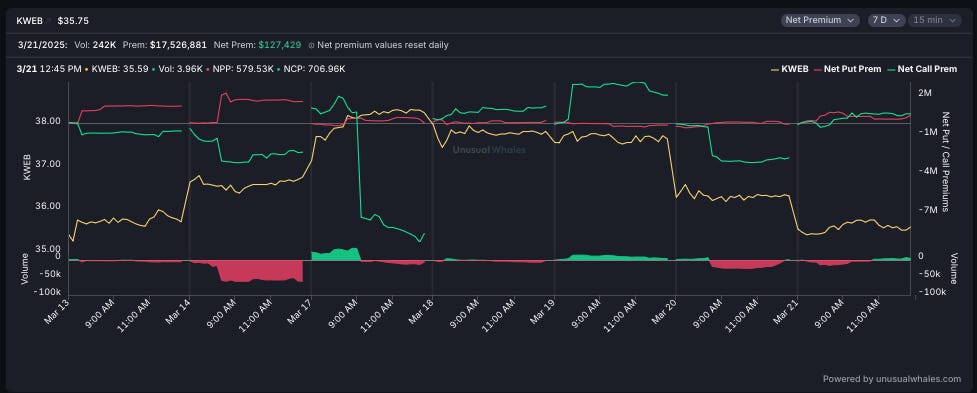
Seeing interesting things with the elevated put activity day after day in KWEB, but let’s dig further into the flow BECAUSE MY DISCORD IS FILLED WITH BENEDICT ARNOLDS WHO WANT A MANSION AND DONT XARE ABOUT MY BIG BRAIN PONTIFICATING SO HERE ARE YOUR PRECIOUS BANGERS 😂😭
🚀YEET Plus:
Two speculative flow trades based on the data
One high-likelihood hedge based on flow and chart
One speculative news YOLO
The Dragon—my Chinese stock filter link so you can obsess each day over what the thesis looks to be panning out like