♟️🎇YOLO 0DTE #2: THE INTERGALACTIC 4D VOLATILITY TRADING CHESS TOURNAMENT
CPI week trade reviews, flow tutorial, what comes next

CPI TRADE AND FLOW REVIEWS AND TUTORIALS YEET STYLE: How we went 500% and 250% the day before CPI on SOY, 110% the Day of, 300% on HOOD Flow Overnight, and a look at some plays currently in our universe for cheers and prayers. This is..
YOLO: 0 DAYS TIL EXTINCTION PART TWO


First you must understand that every Price Action board we use—from ES to CVNA—is an instrument designed to respond to the weekly and monthly levels of its own creation.
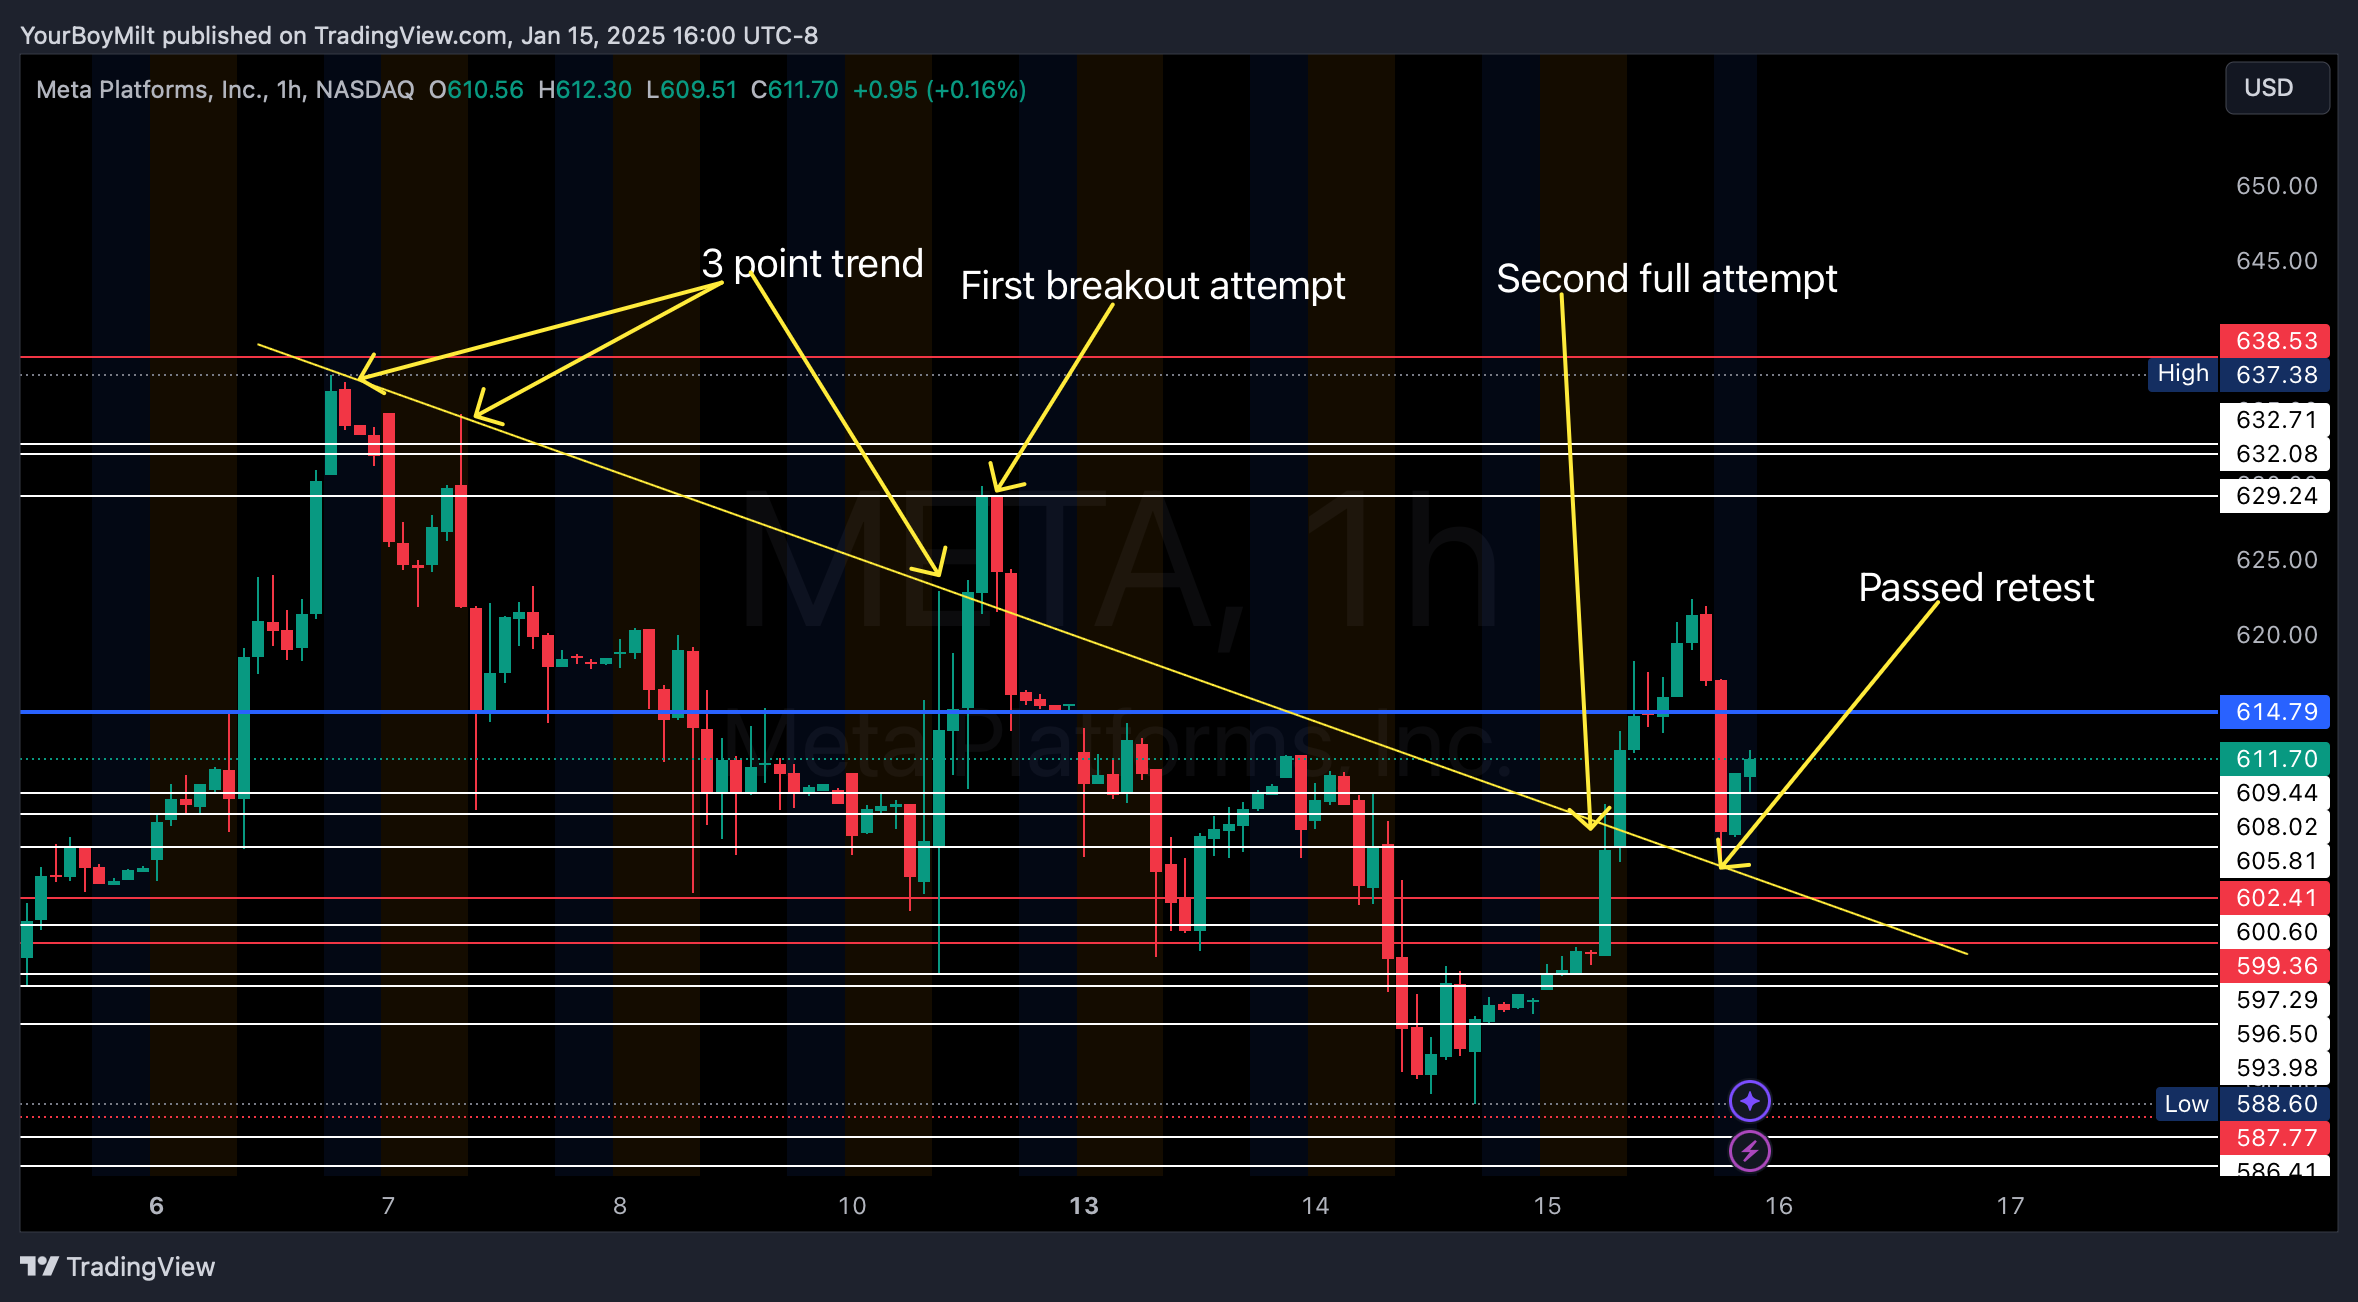
For example—here is META on the monthly chart, with monthly levels marked RED.
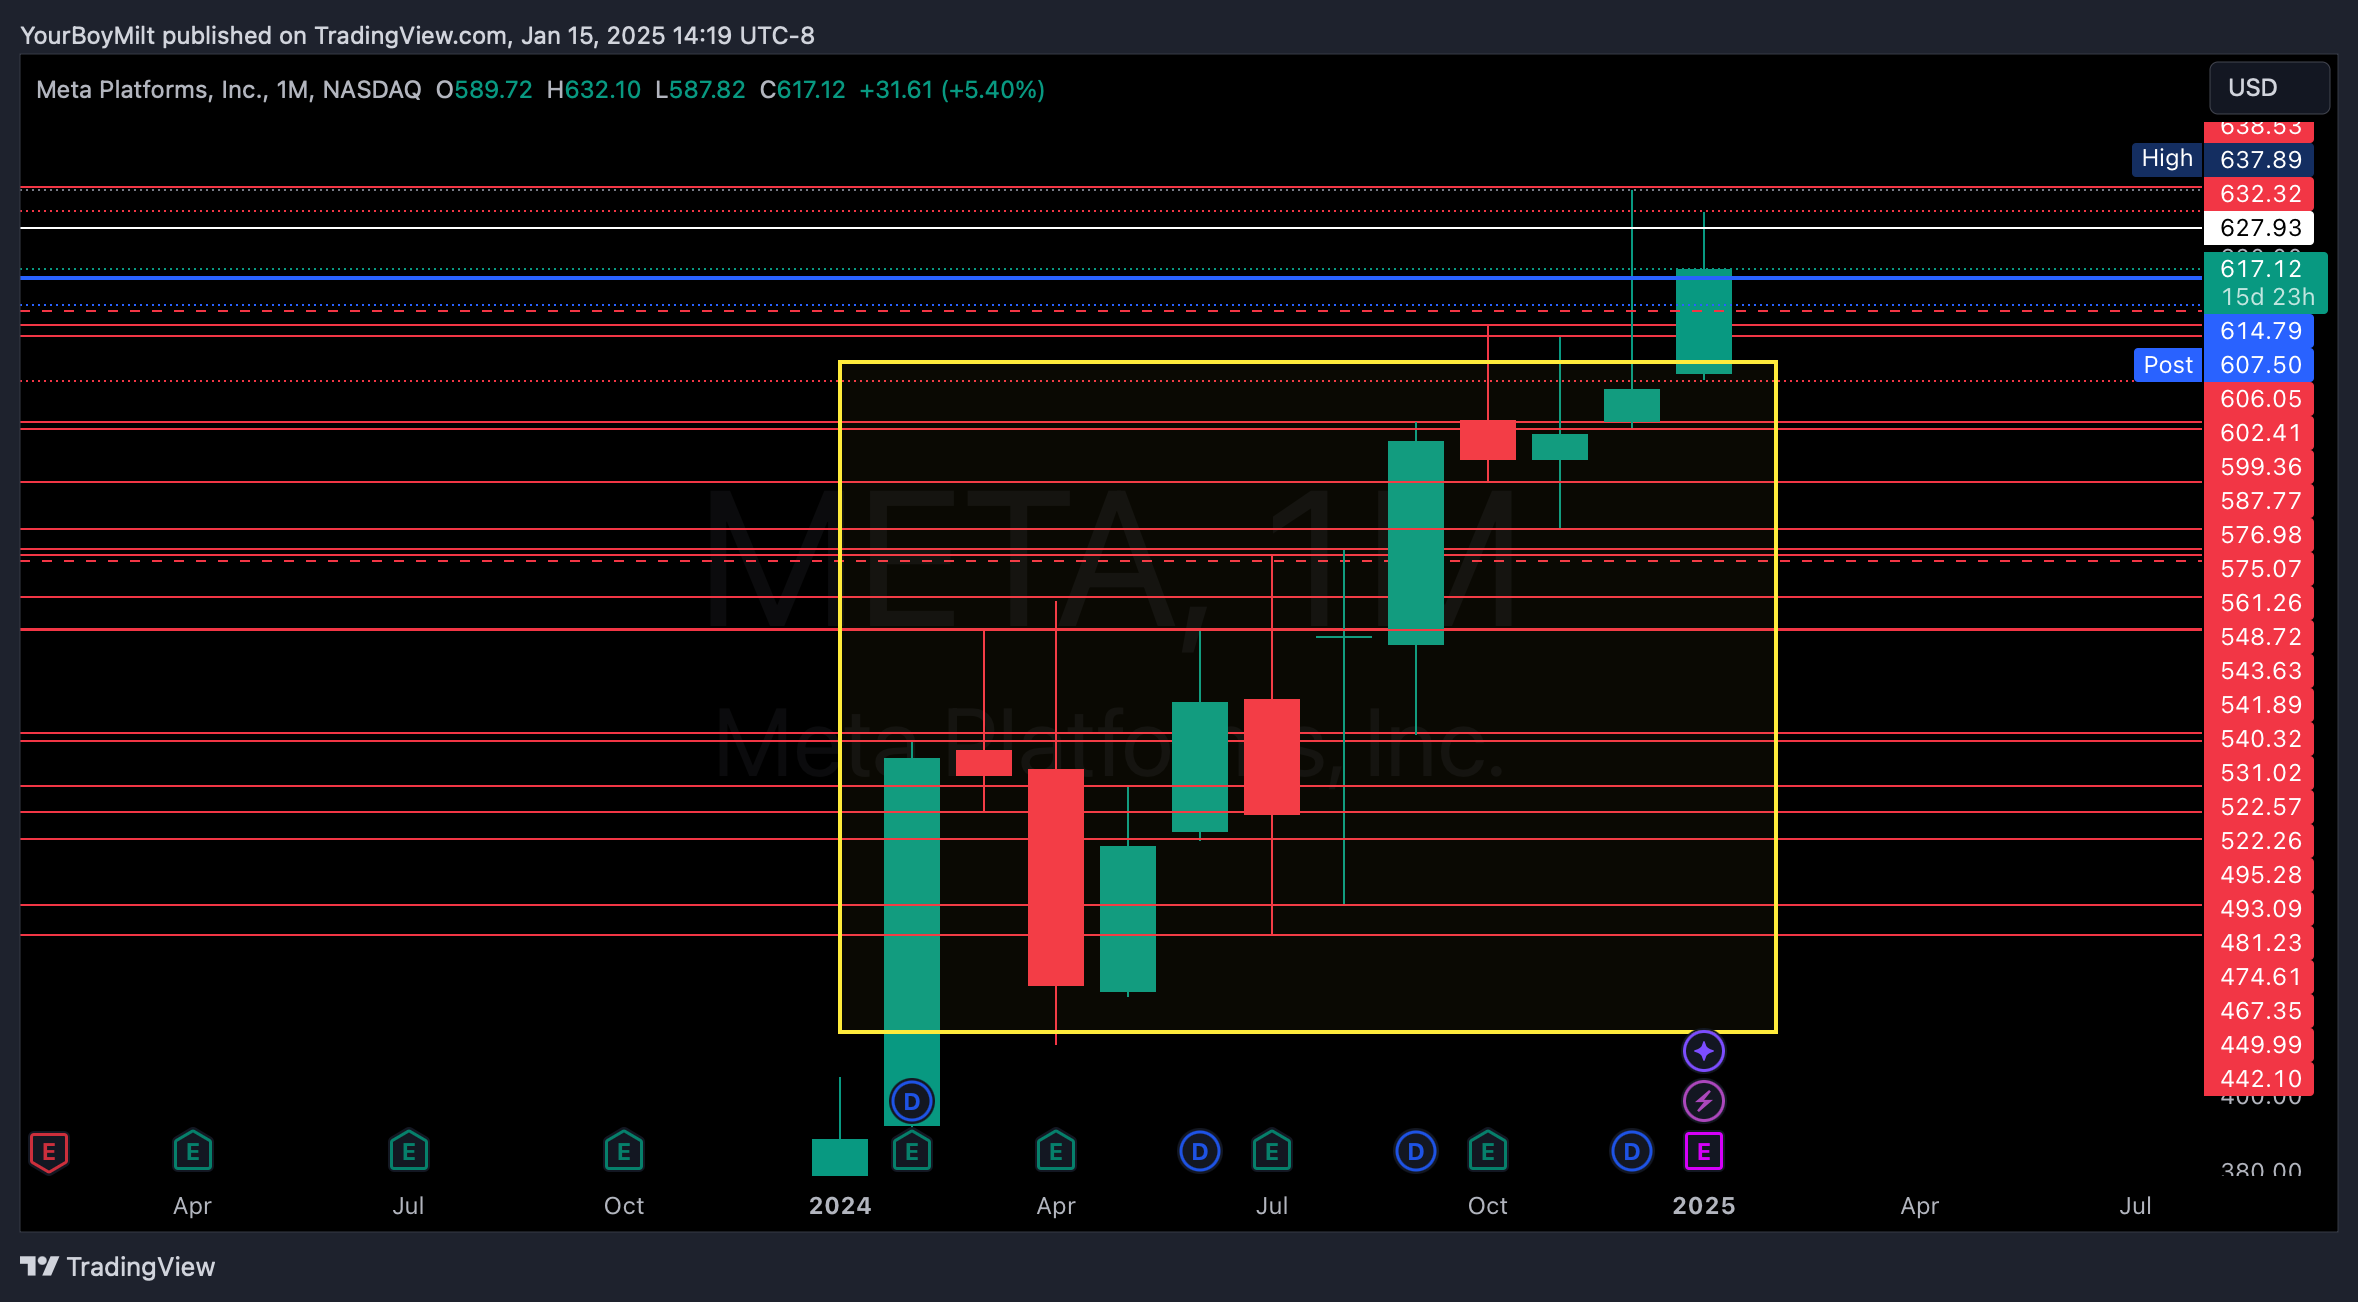
Let’s focus on the heart of the Price Action in the yellow square the area between 450 and 600. Watch what happens when I switch to the hourly time frame.
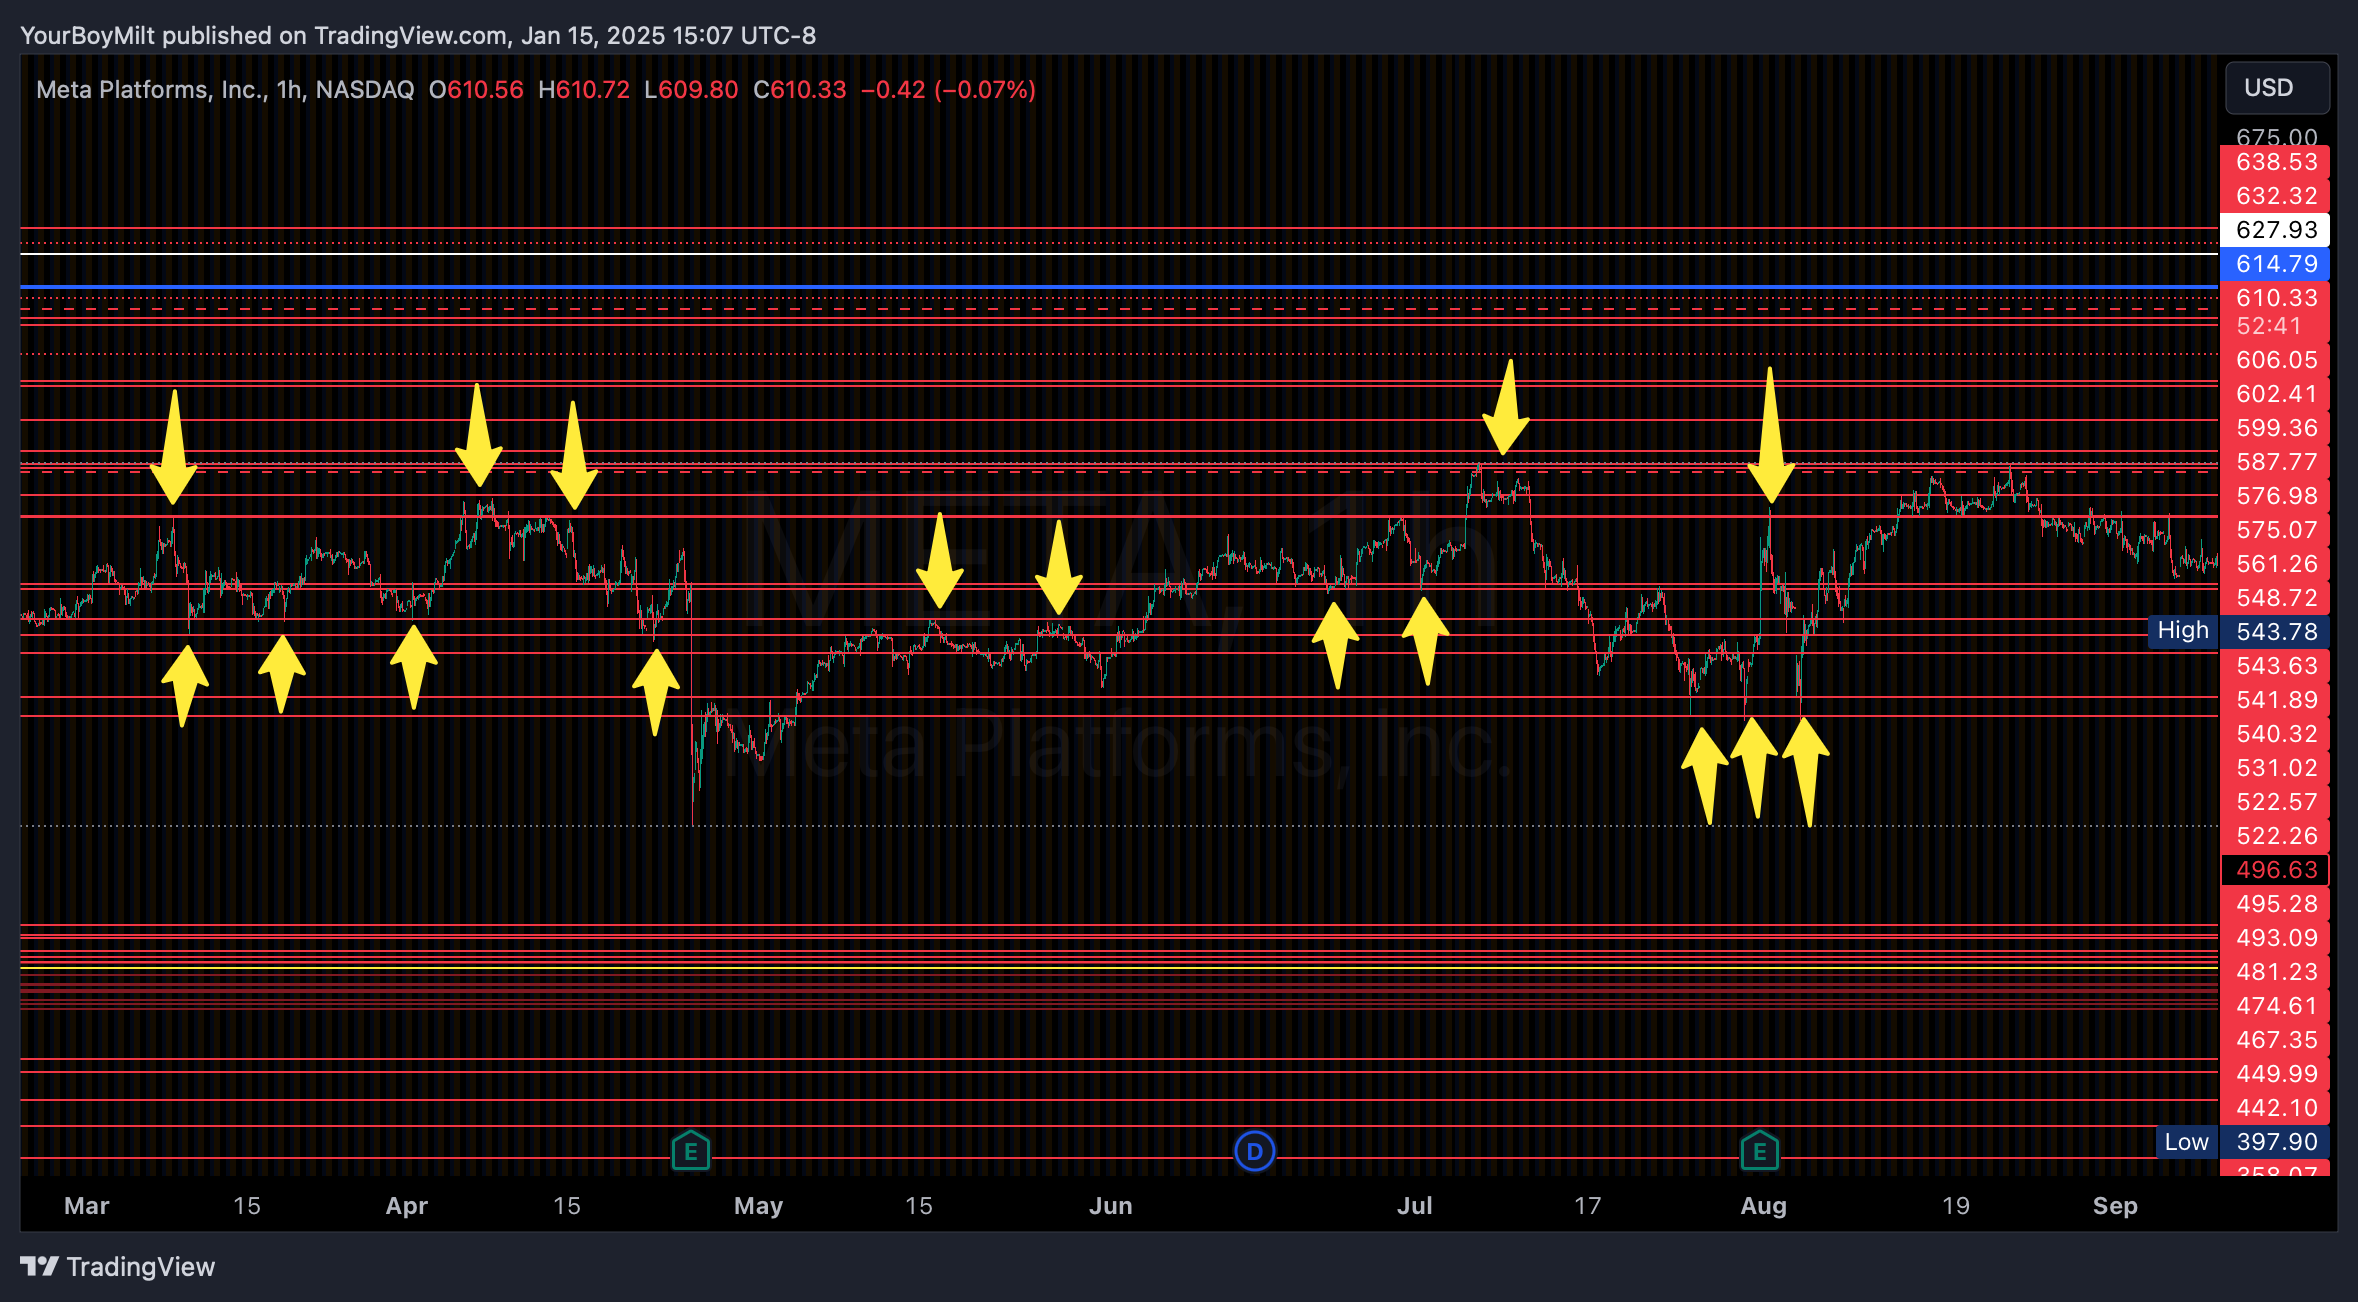
Those are now the key points of support and resistance. As we to higher levels the weekly levels come into play and provide us with the same action within the monthly framework—
[the game within the game? yeah sure whatever]
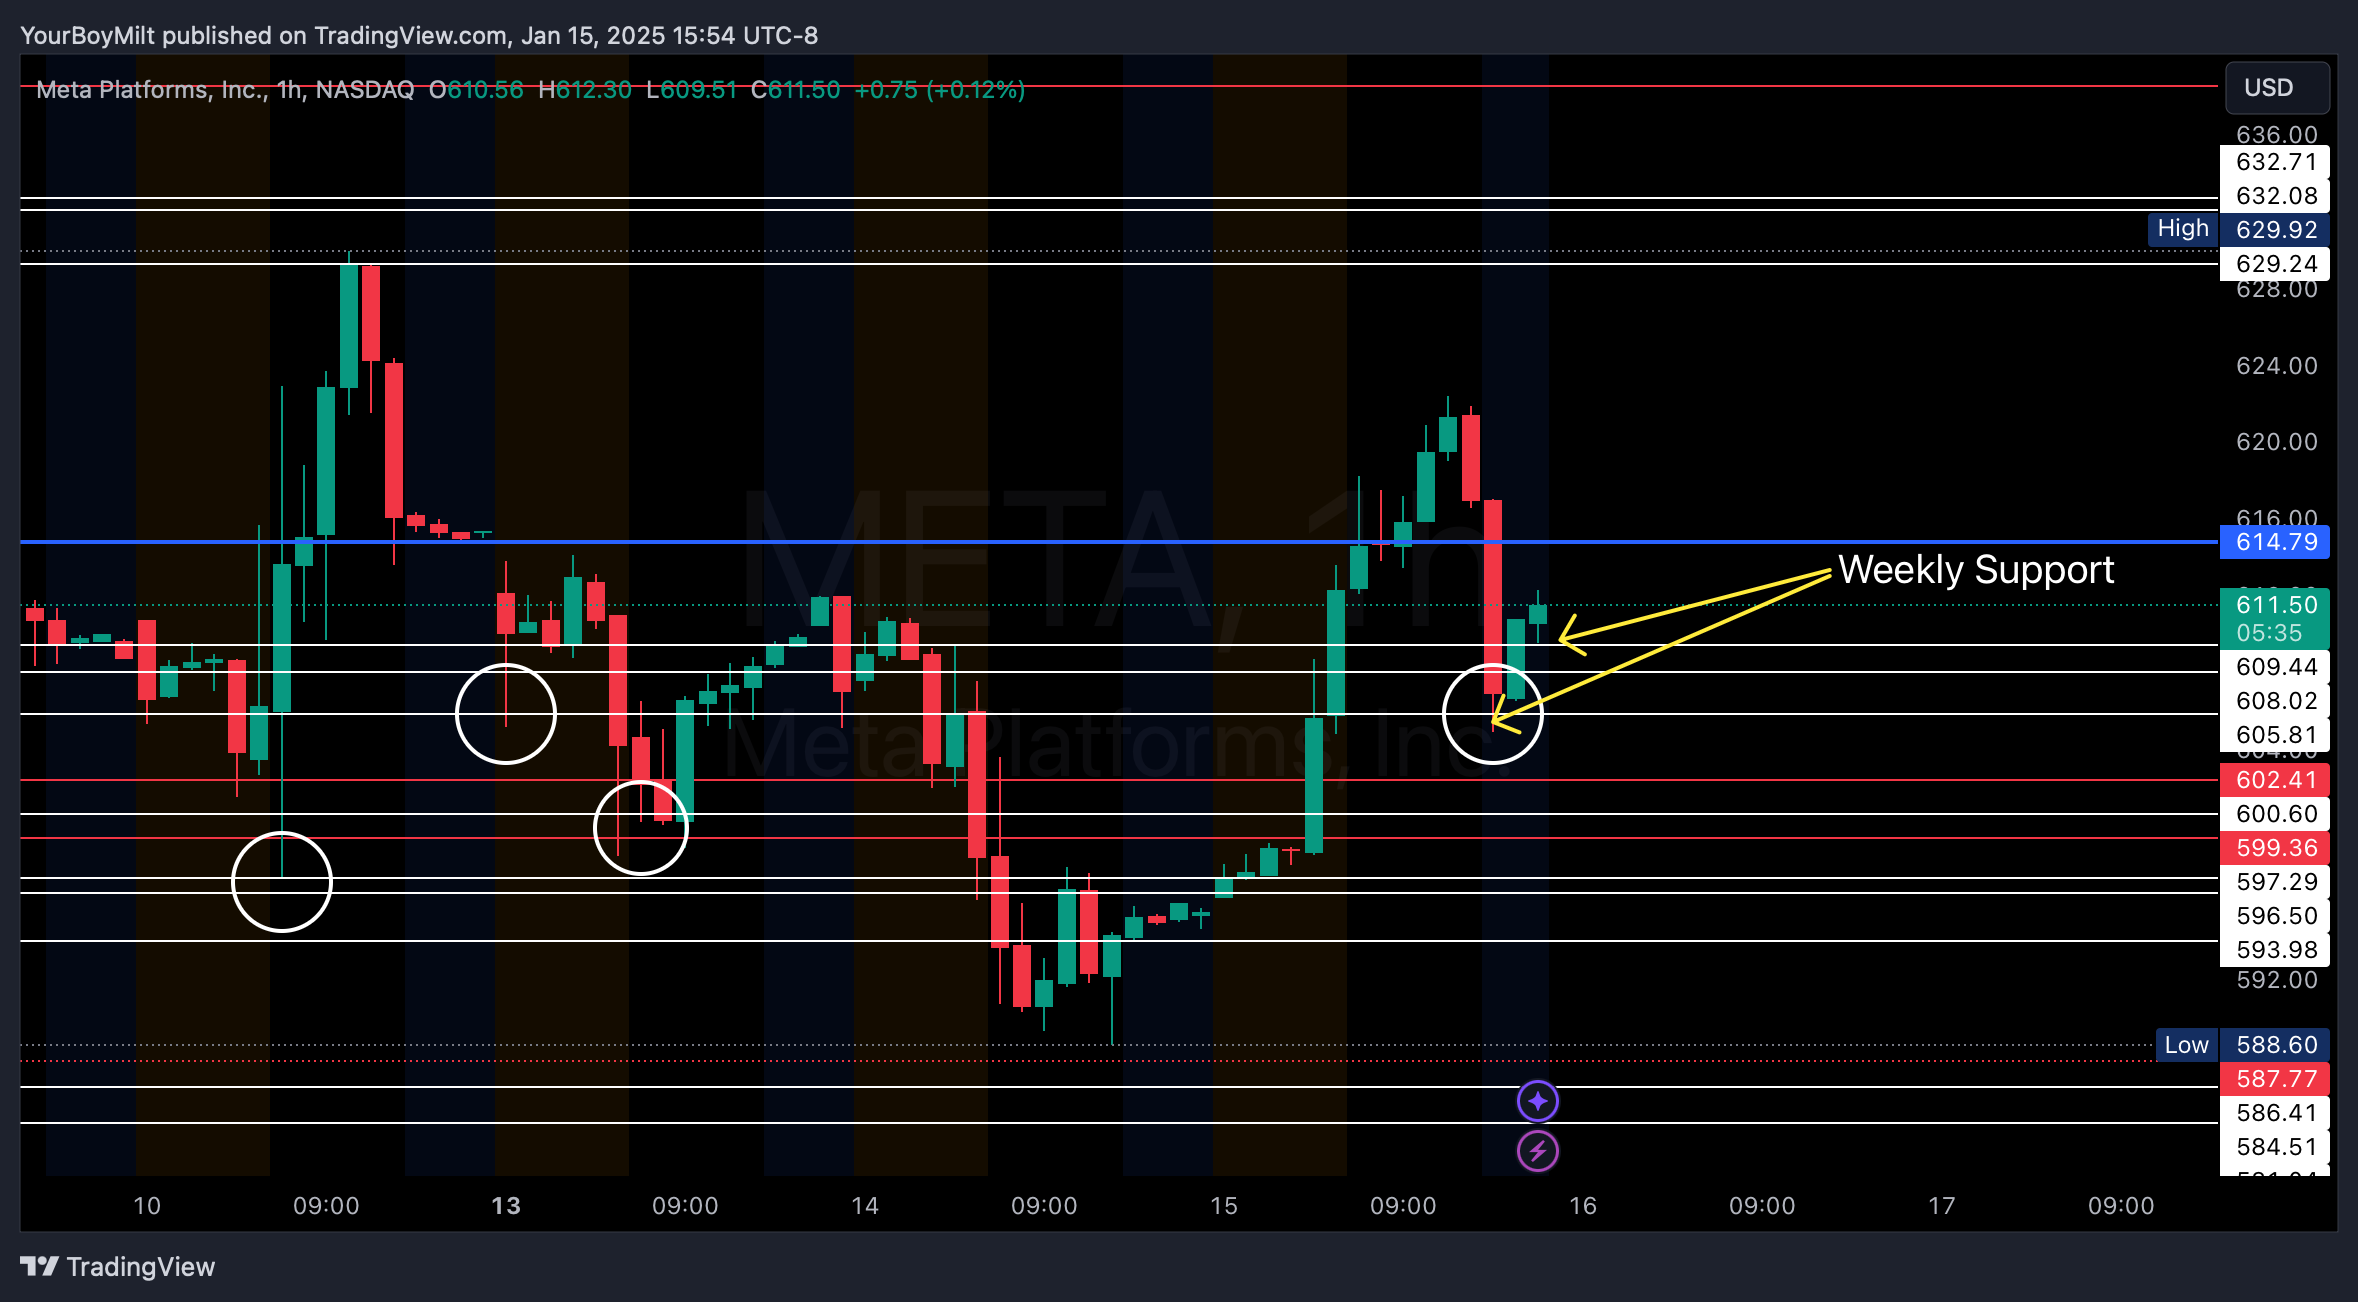
You can see currently that META is progressively holding weekly support and—

and it’s breaking up out of a trend line! I remember—the first time it tries to break out and falls back in…but if it goes for it a SECOND time, they almost always complete the move!

♟️The Volatility Chess Semi-Final Tuesday and Wednesday: Core Price Inflation: tips and reviews on how to trade volatility

Now I want you to see what the pure volatility price action sees; I’m going to show you a little trick to help you see things more clearly on these high volatility days. It’s one of the reasons we make our weekly levels always white, my boy…
On normal trading days the weekly AND monthly levels are key. On volatility days like these (CPI FOMC NVDA)—markets only care about responding to monthly levels. It’s the reason why the swings are so wide those days.
📼 How We Went 550%, 250% and 108% for a clean 3/3 Sweep on Day Before/CPI Day SPY and SPX trades
💡So, to review:
Have a clear understanding into the event of where the open backtests are on the weekly and monthly levels
Follow the Price Action day before; if they ratchet it high/dump it low in one direction, wait until you see the sign of a reversal to play the backtest left open furthest in the opposite direction of that preceding Price Action
If the reversal shows for that day, then note if they left any backtests open the other direction—that’s where we’re heading the next day
If they don’t show reversal signs that day before, let them conclude their movement and end of day your likely best move is to play the backtests they left open the opposite of that. Buy a couple of days—they can fake out the other way to start the day before crashing the other way—excellent opportunity to add to your position on that reversal.
🌊Free Flow Exercise: Price Action and Flow Interconnected Thinking
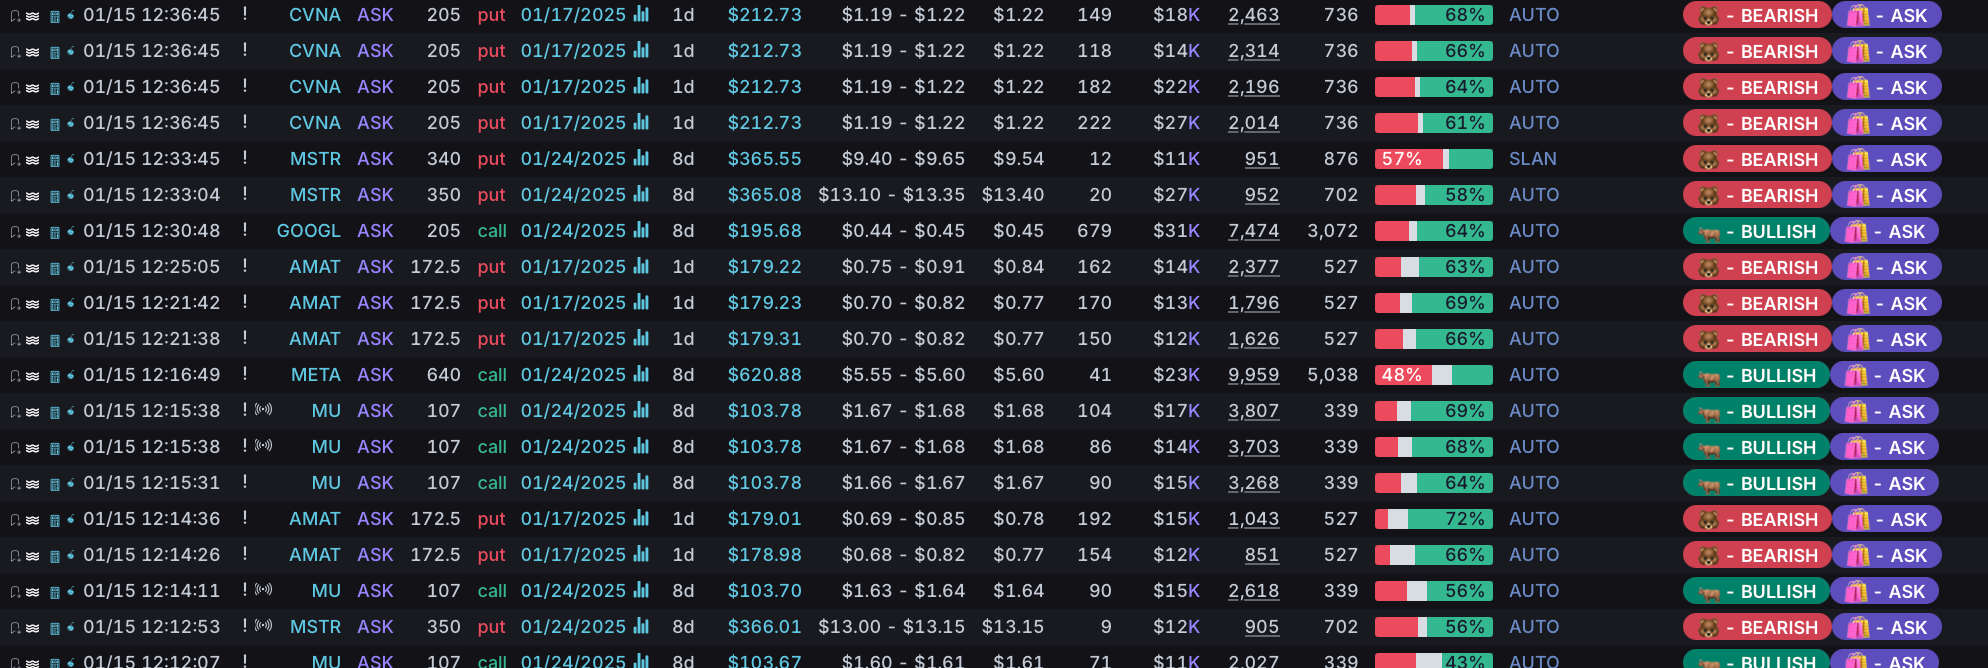
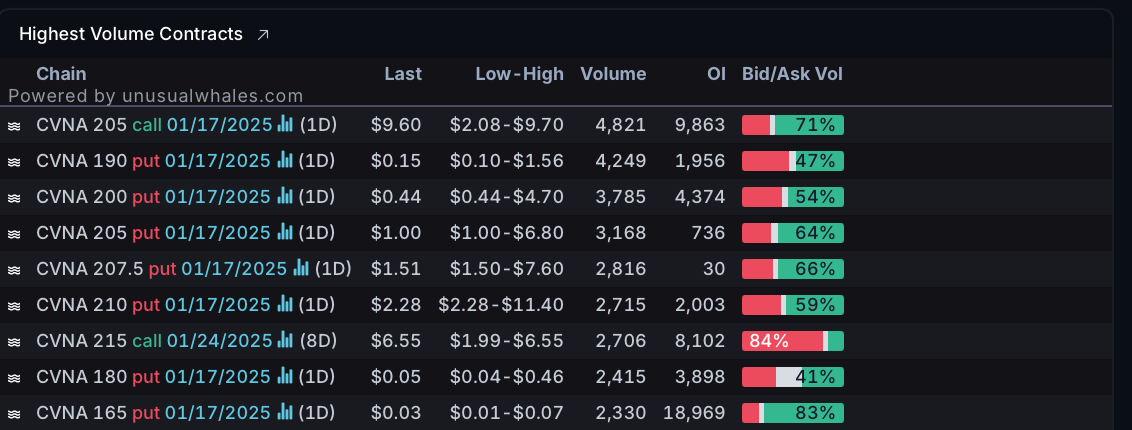
Grandpa, one thing I don’t understand is why Rowdy Rebel followed those CVNA Put whales. Can you put me on game right quick?
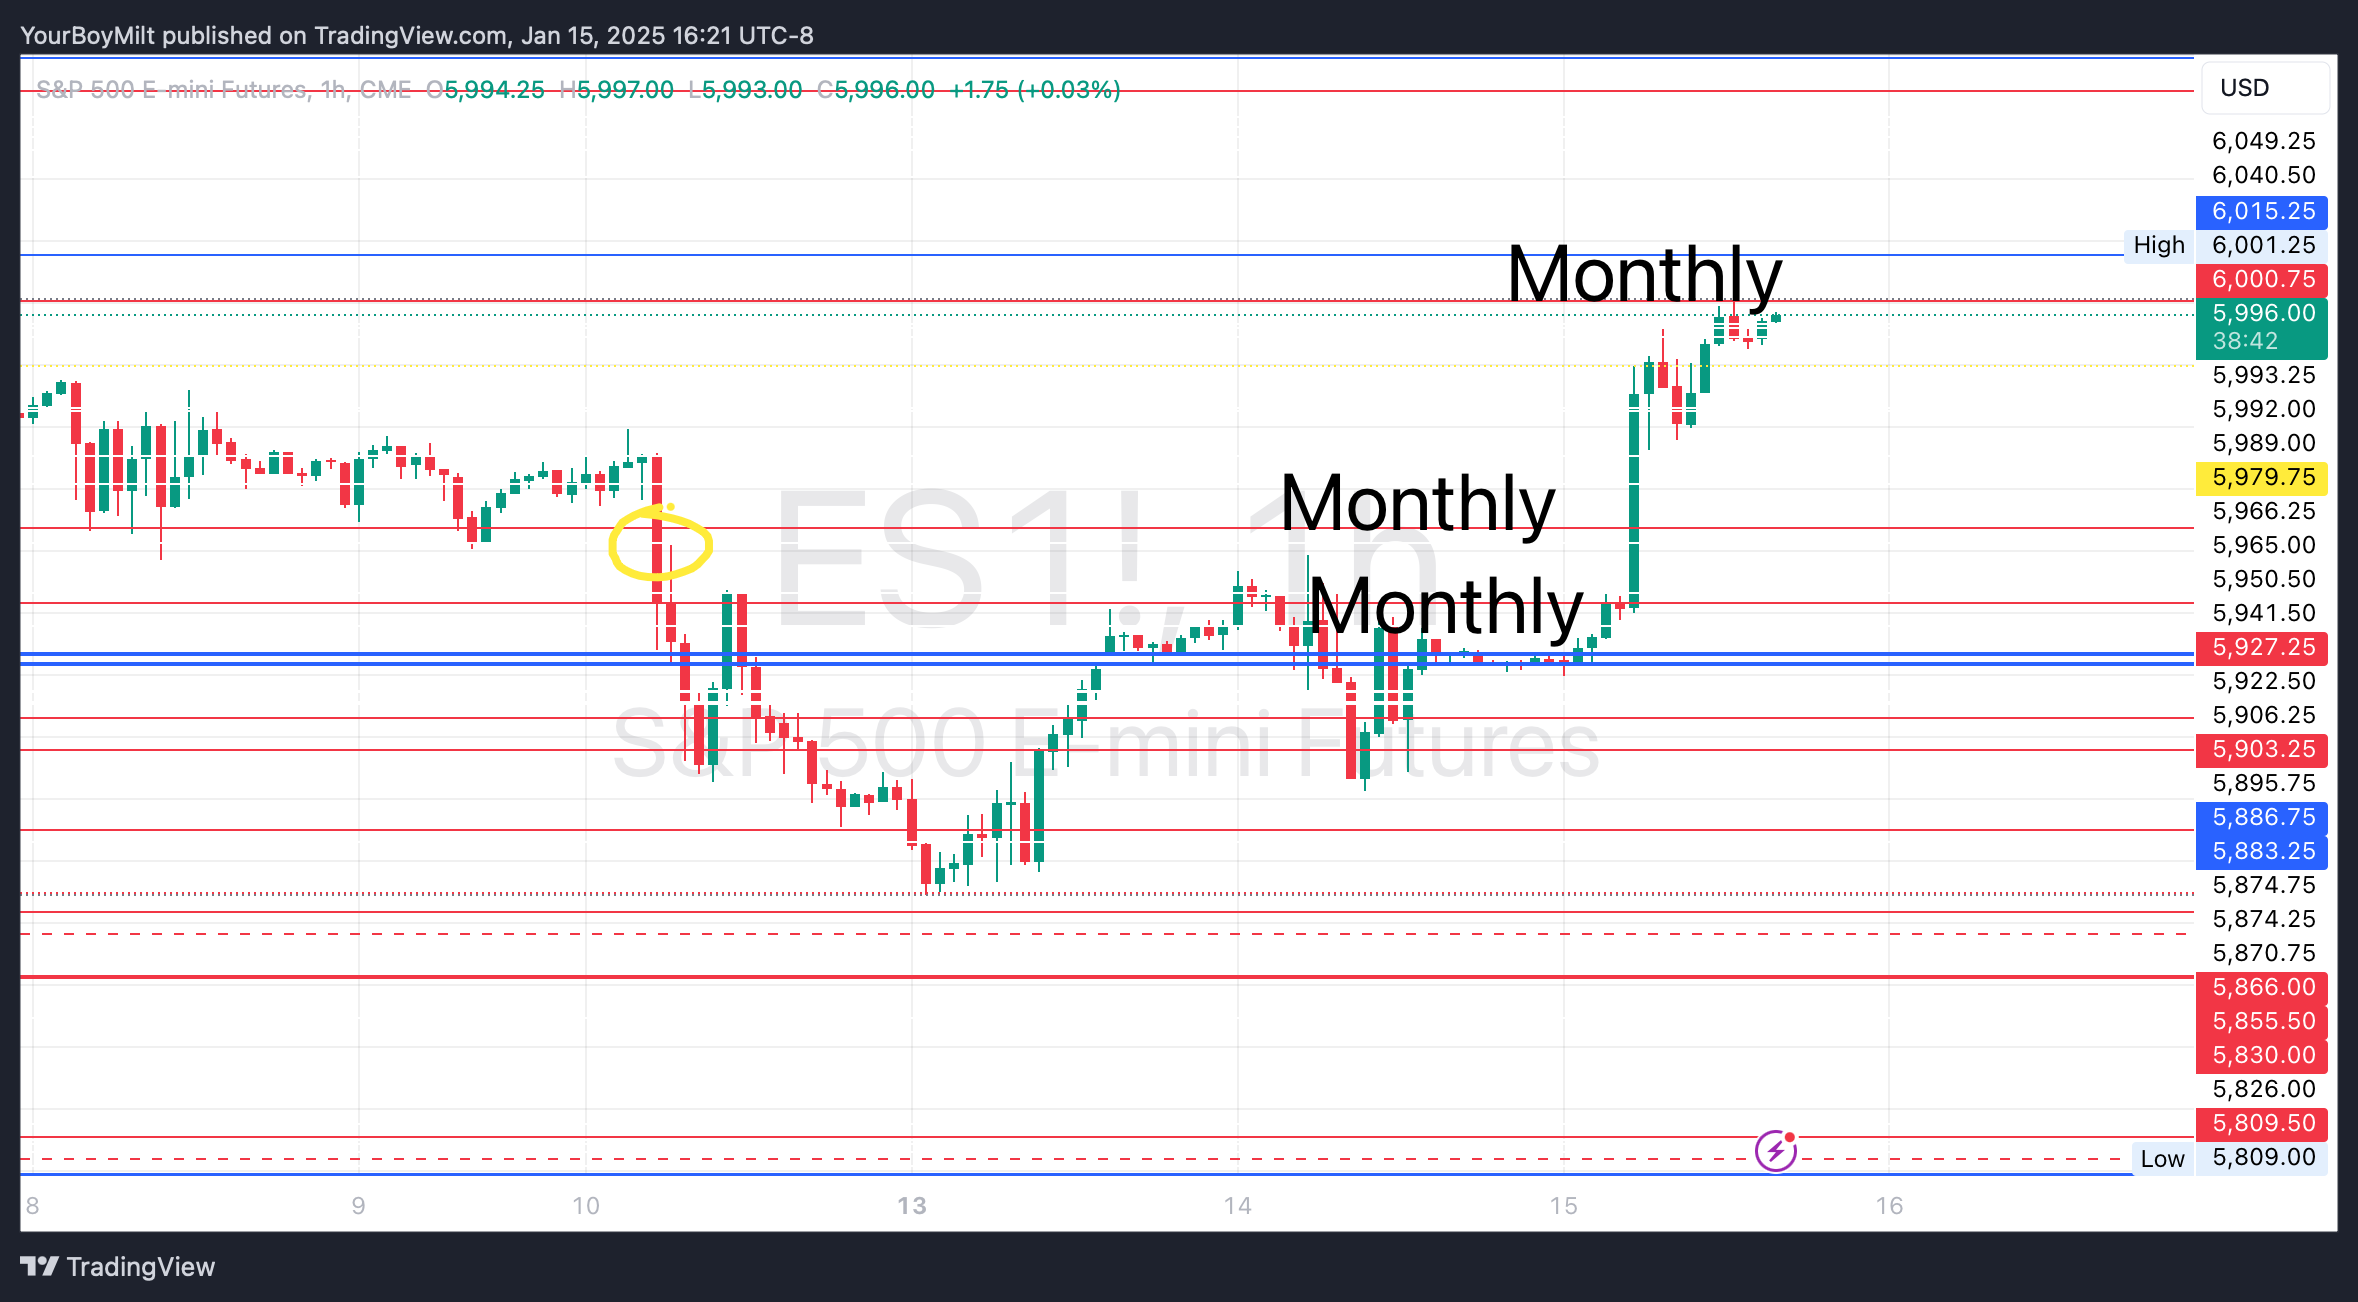
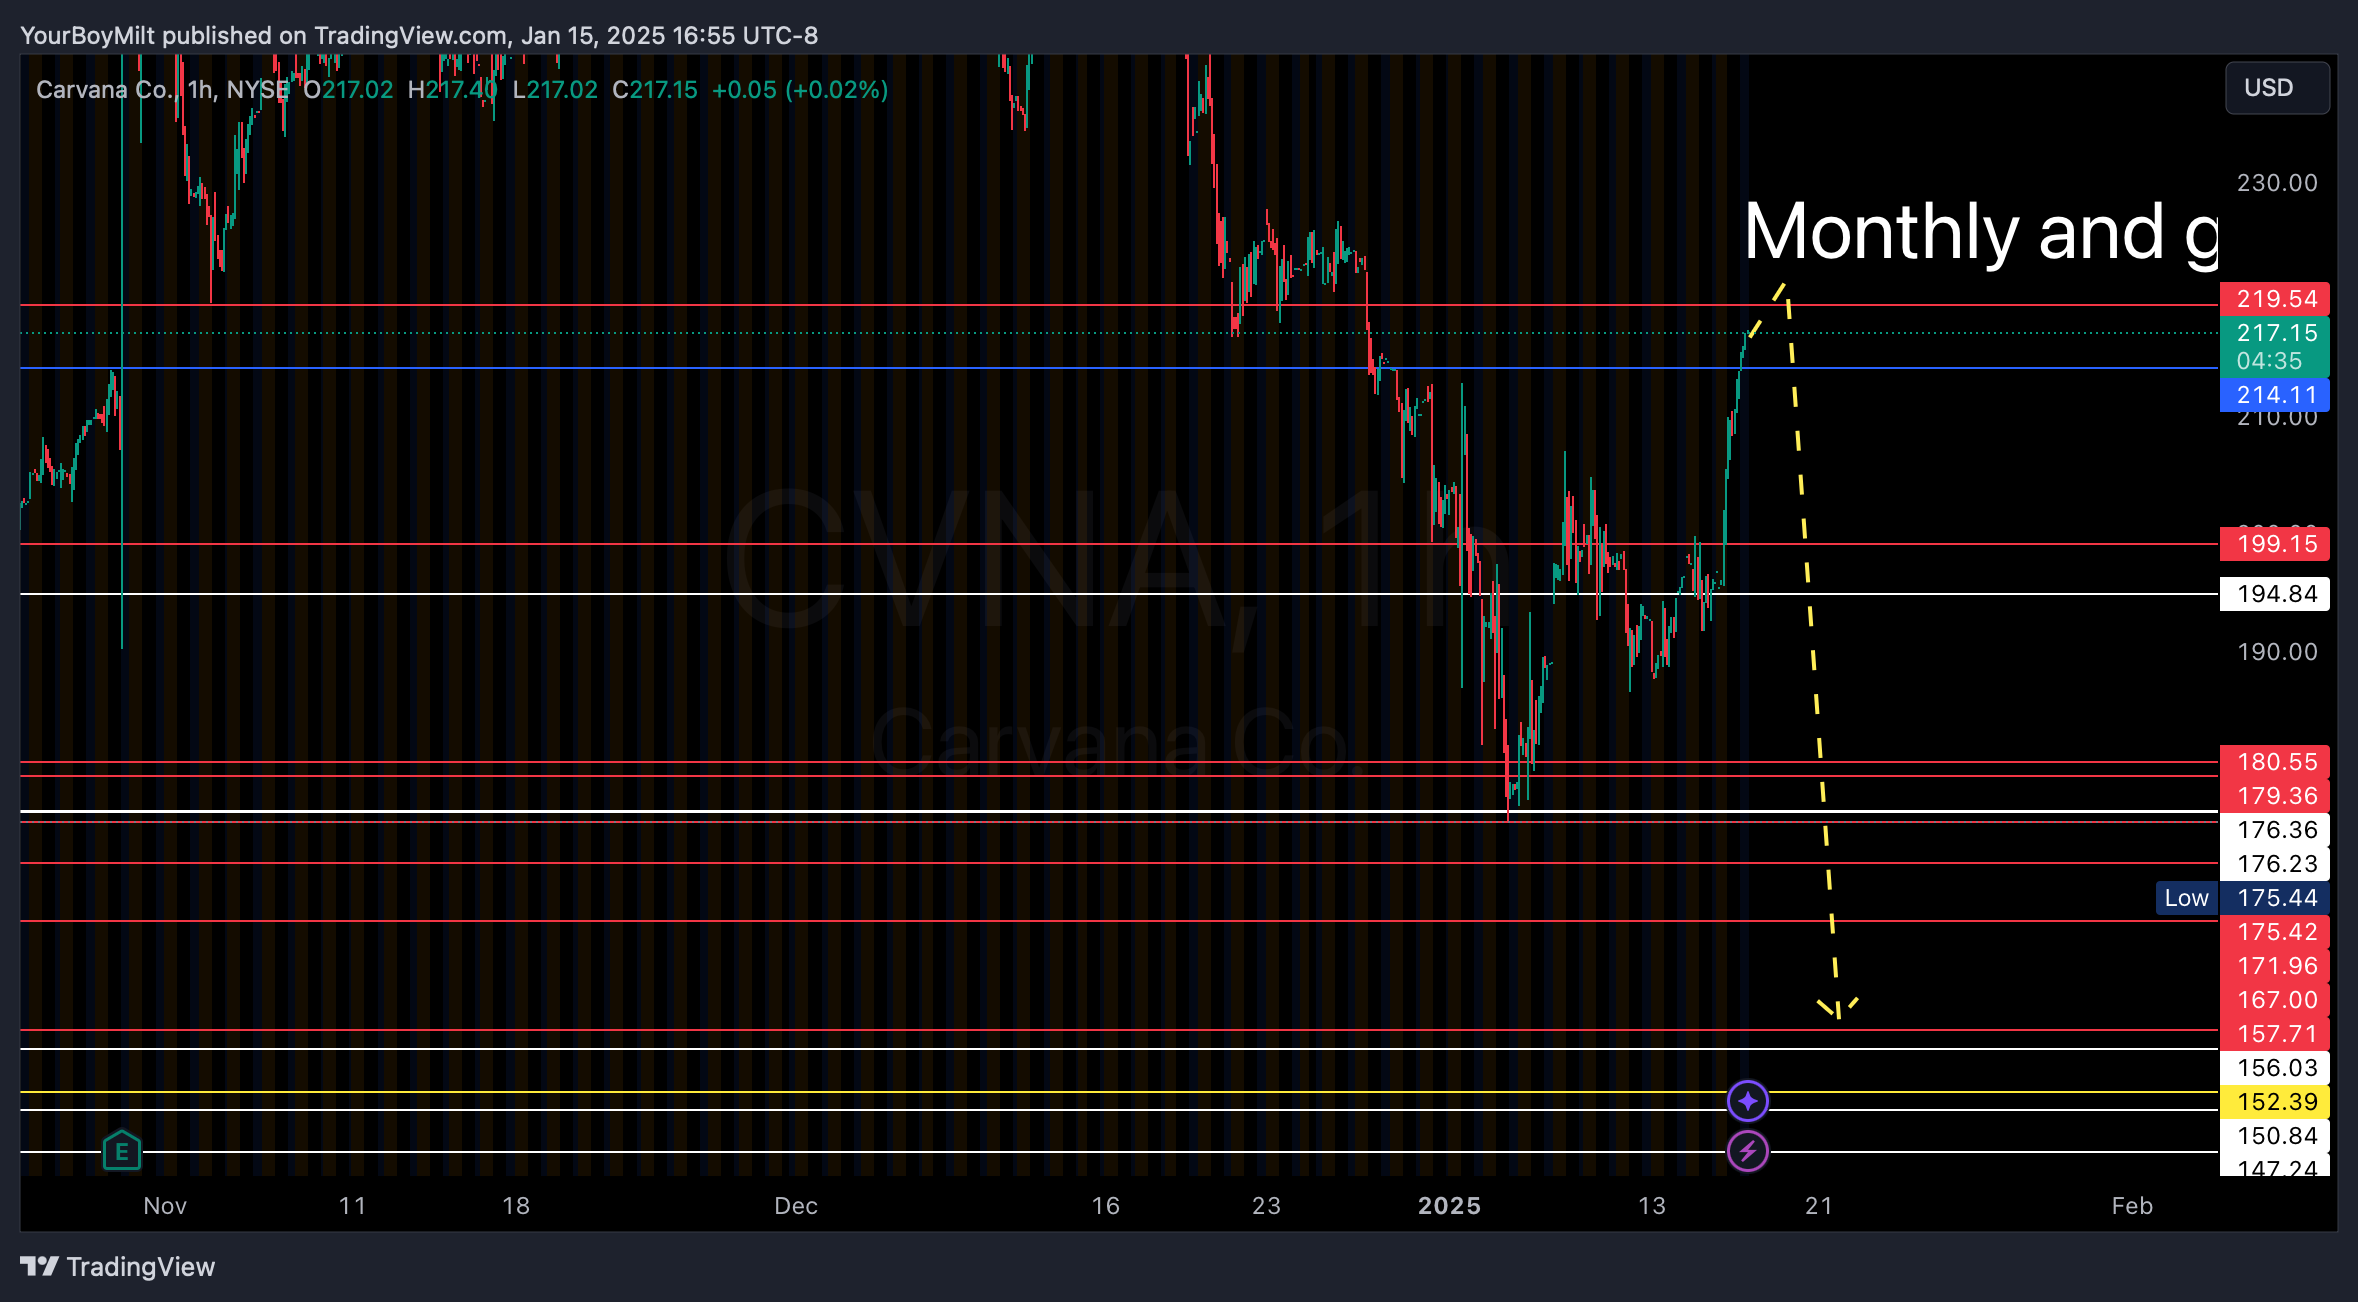
CVNA was a flow pick which also has something that I call a safety valve—a wrinkle in the Price Action that lends itself to breaking the trade our way though it’s not visible to most people immediately. Let’s reflect on what we just said about volatility and levels using our volatility chart…
ES closed up but not many noticed that we were incredibly close to a monthly level. Statistically, it;s likely to bring some sort of backtesting reversal. After today, when it happens it’s likely to be a screamer. Why?
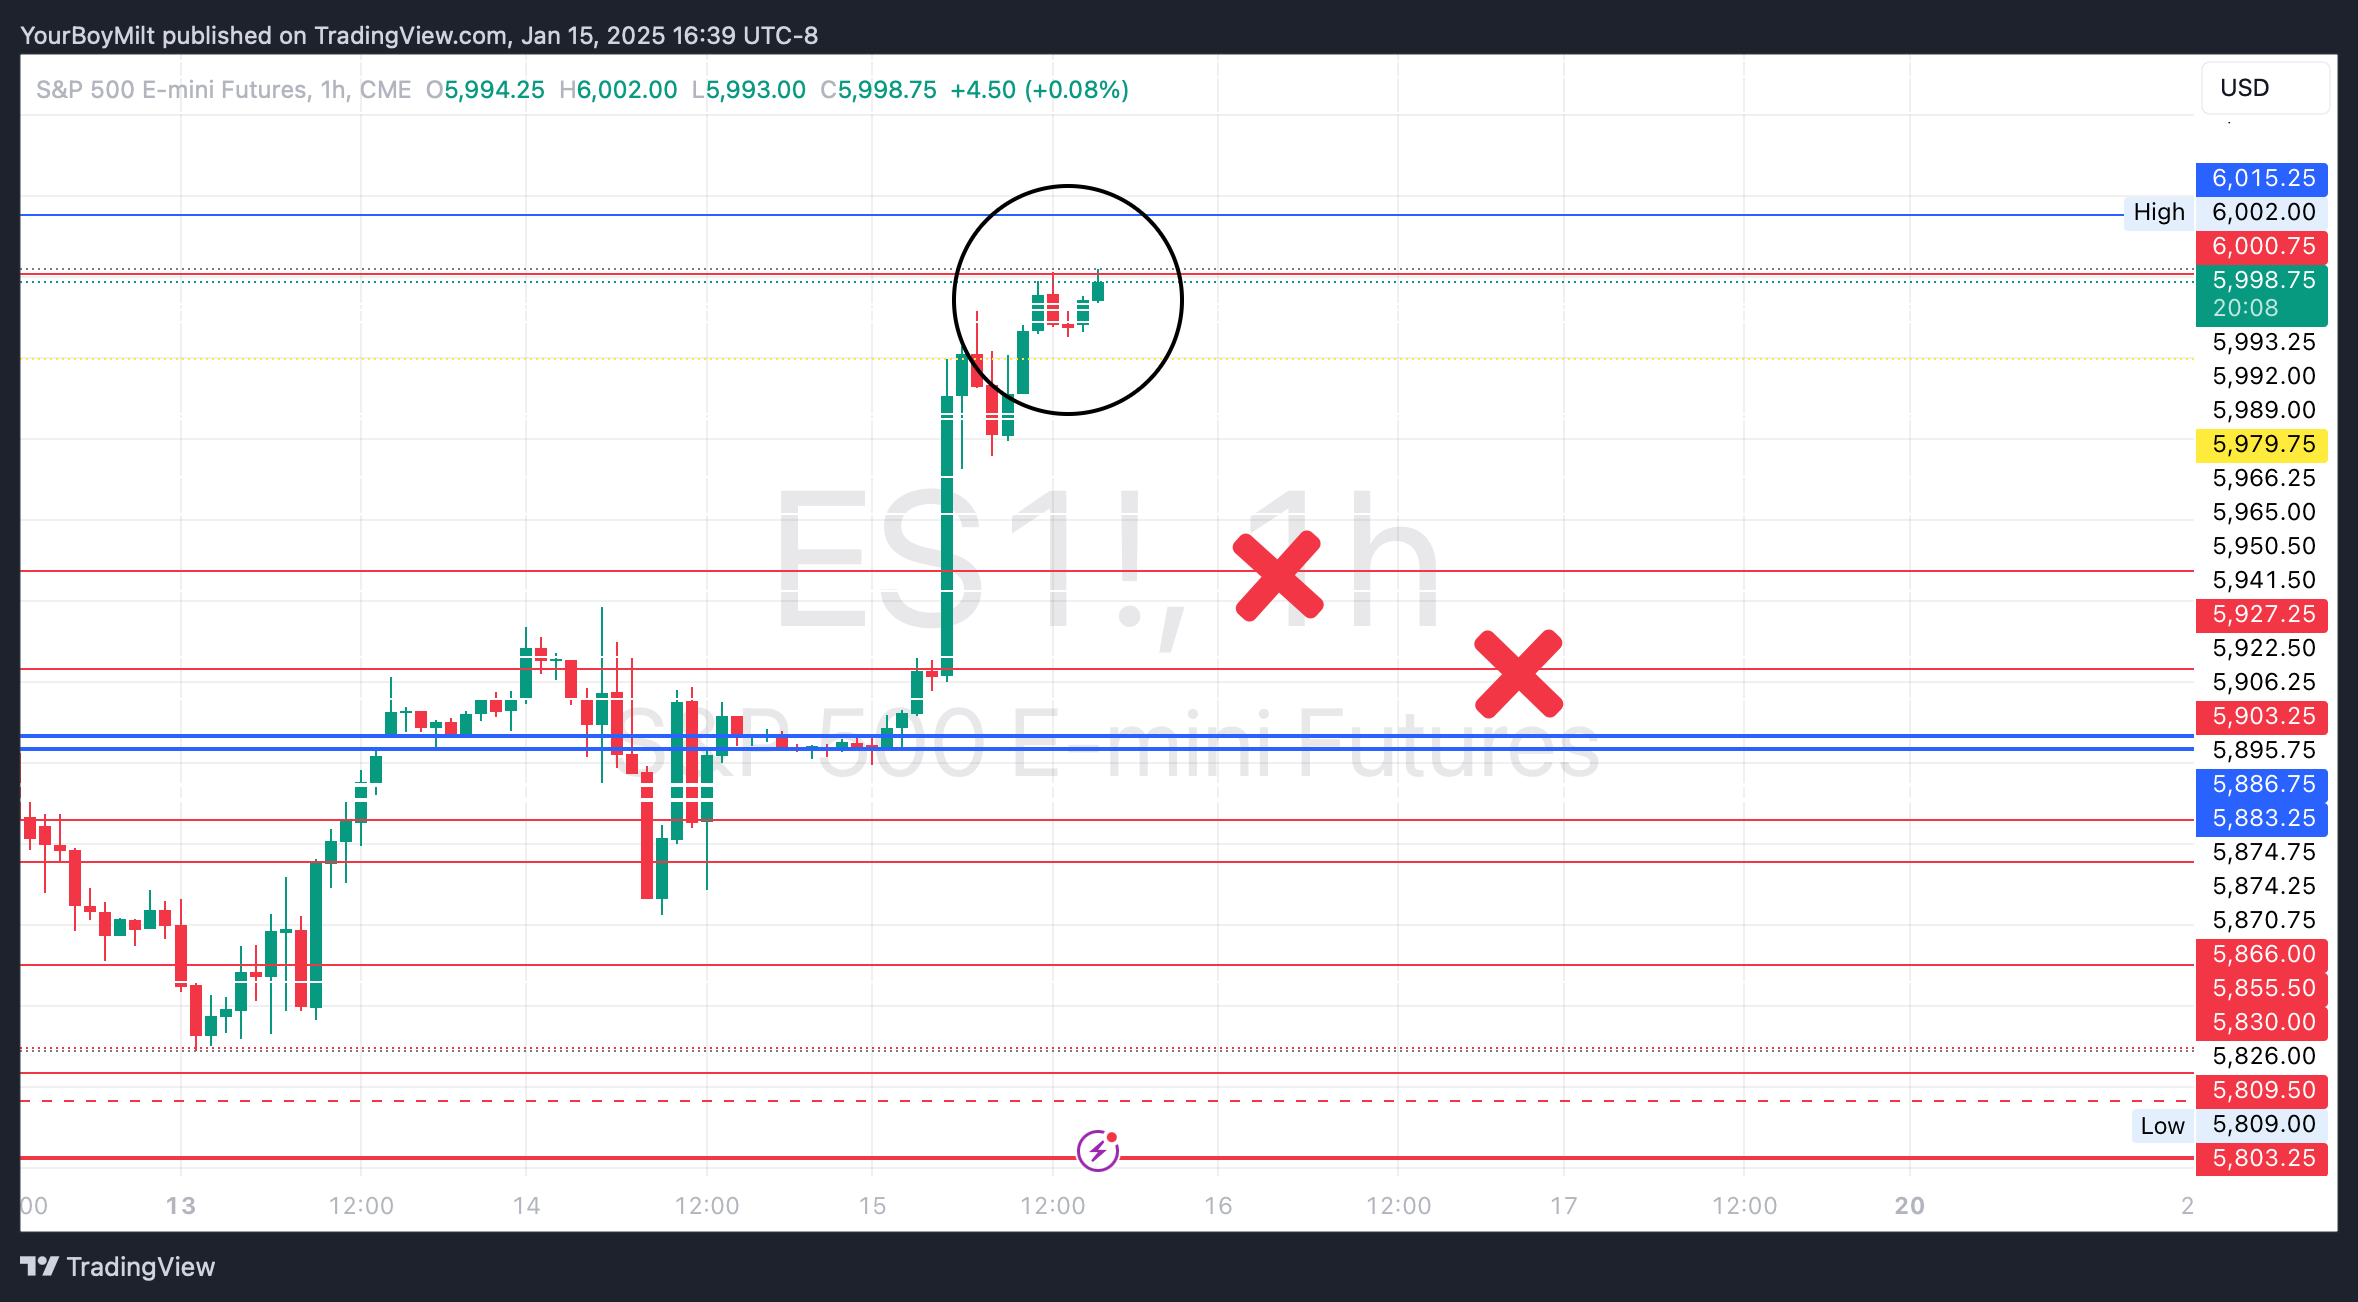
Because of the backtest levels we skipped along the way. Great Intergalactic 4D Chess (trading) is about weighing multiple probabilities at once, and playing those statistics in your favor. Therefore the odds are that—if those CVNA put whales are right—
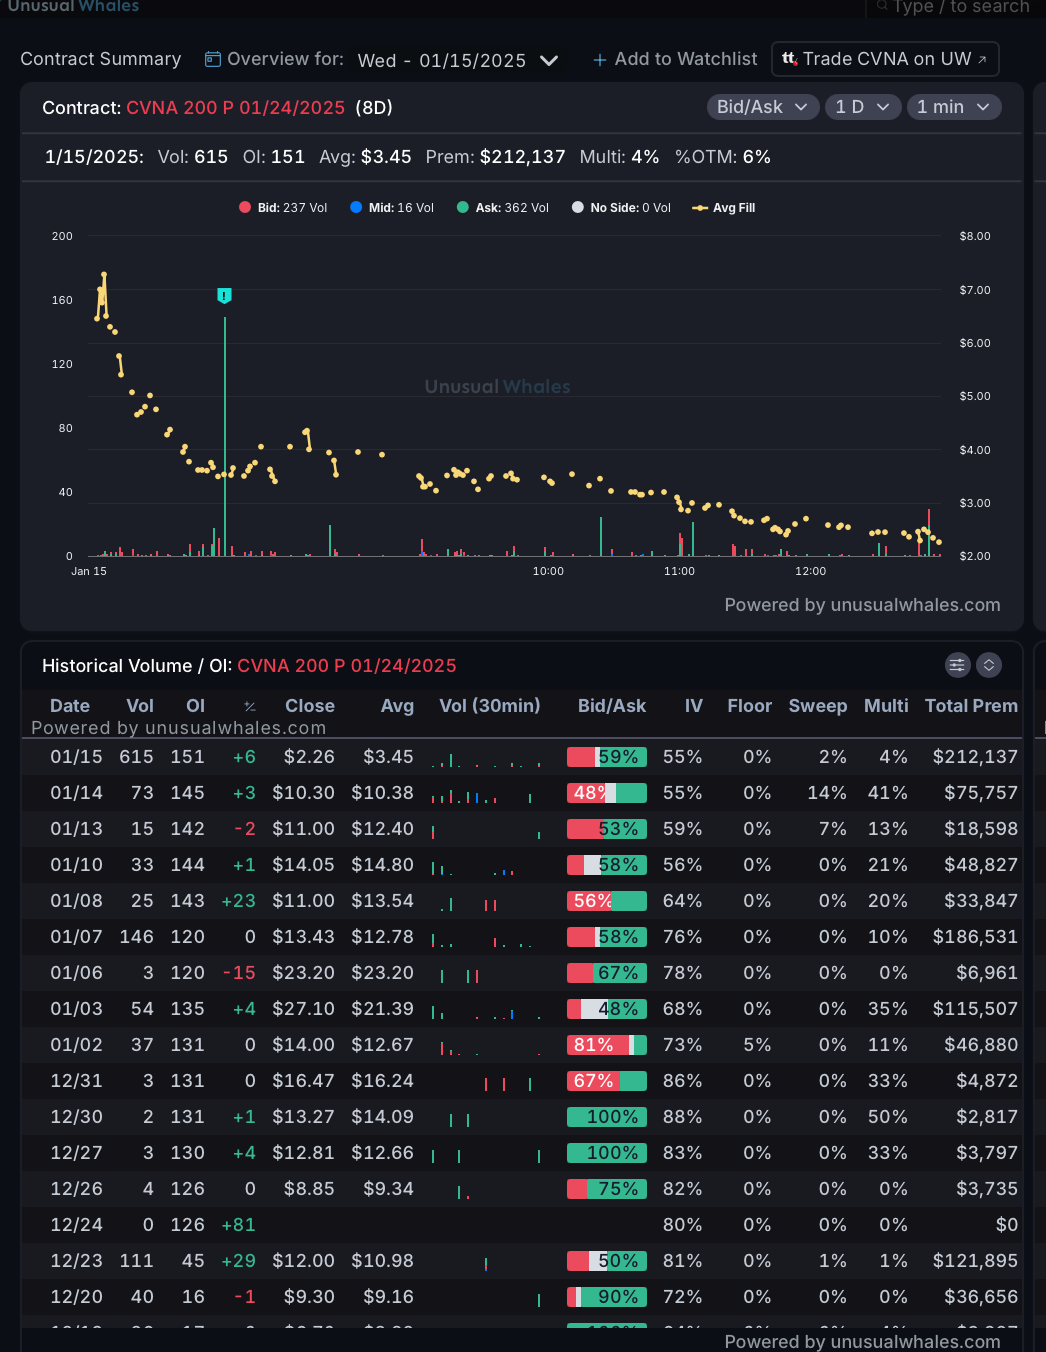
Price Action will back up their move overnight or early session tomorrow with a reversal at 6,000 that brings a backtest down to 5903 (marked with X’s in the above images.
This would also almost directly coincide with CVNA approaching a a daily gap level, a monthly, and that monthly which also doubles as a closure of the daily gap level. In other words.
PS more CVNA puts on the 205p came in at 12:36, just before the close:

🐂This doesn’t necessarily contradict our current bullish trades, and these are things you always have to weigh when you’re rounding out your positions:
META recently has been decoupled from market movement on multiple bullish pumps—it can move independently, which is one of the reasons I like them all the time
MRVL is not a bullish market sentiment trade but rather a NEWS sentiment chase as well as a sector sentiment trade as semis see bullishness across the board
For example, here you can see on the Intraday Sniper Filter (all 6 YEET filters included with your YEET Plus Annual Subscription) that although end of day puts started rolling in, MU was getting hit with OTM flow expiring on weeklies