
🌕 YOLO: Trading Evolved // Ep. 1: Boot Camp / Mapping (Plus a flow play, duh)
Your journey begins tonight, Spartan.

Hey! I’m @yourboymilt, and welcome to the Daily Newsletter! I should probably let you know...This is not financial advice!
Brought to you by: Your Boy Milt and His Sensei Abu OmegaTrigga
Tomorrow: Maps Expansion Pack drops, plus usual Flow and SPY Reads
Maps Pt. 2: Wednesday Night/Thursday Morning
YEET Callouts the past two weeks:
15 Trades. 14 Wins. 1 Loss.
Wins under 100%: Three.
If you want to know how, part 1 is right here.

(In case you’re not a nerd this theme is a ripoff of this amazing game series called HALO that is the birth of the modern space-expanse shooter)
So, you wanna no-scope 10 point drops on the index with effortless devastation like you’re sniping with a pistol?
Maybe you want to eyeball the next whale 400% runner mid-session?
Take it from someone who had a couple of bloody weeks with an account testing life support for the first time in a long time—none of that shit matters if you aren’t grounded in the most basic skillset; Price Action fundamentals.
After having an uncharacteristically awful stretch over a couple weeks, I went back to the basics and did some soul searching. After hours looking through results, callouts, stops, strategies, multi-baggers, and total losses, I have something of a blueprint to keep you from reliving the same headaches. Because of that I’ll be helping you out along the way with trips as your assistant, MILTANA.

In every trade I analyzed I found all my wins had these three factors, and all my losses needed to have missing was one of them.
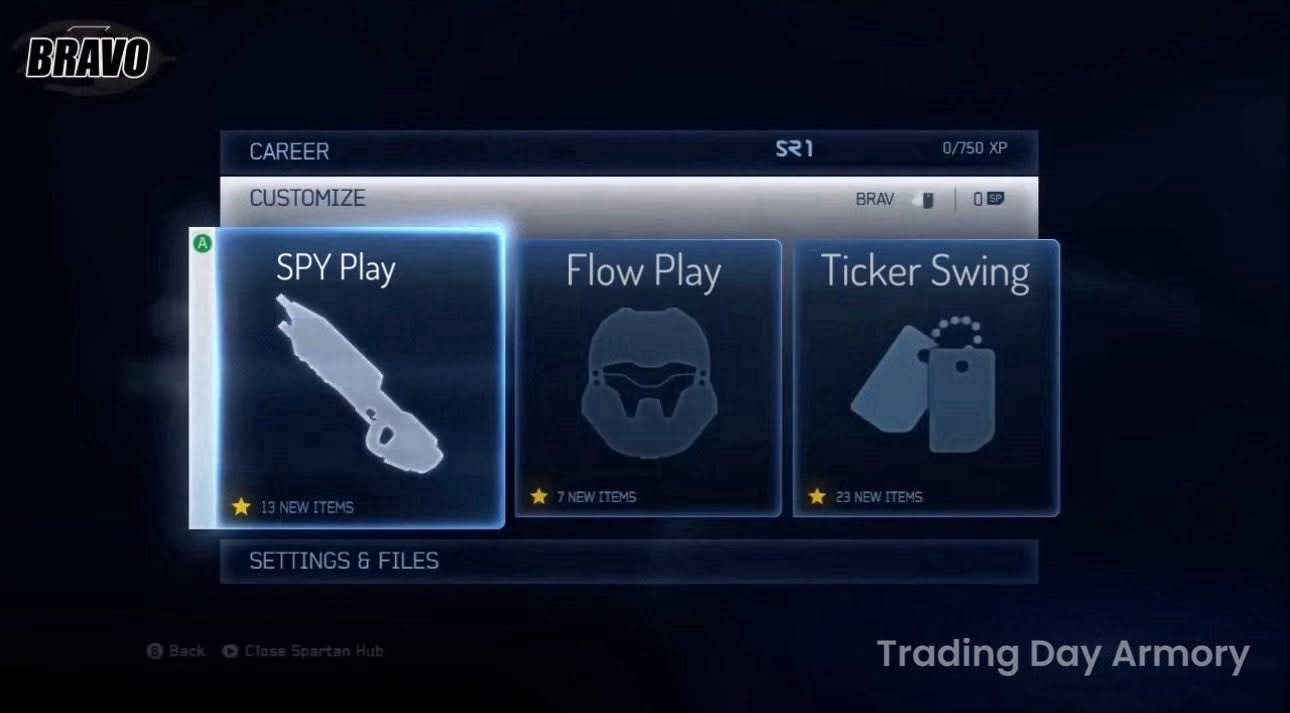
📍 Situational Awareness of Chart Placement (Map / Terrain Knowledge),
🔫Varied Set of Tickers to Choose from in Different Situations (Proper Weapons)
🎯Affective Contract Choice (Aim)
Every play I’ve run the past couple weeks has focused on these three factors and taking note of the nuances between them to create a library for guys to use. I have made sure to stick to this structure, and it’s been treating us very well.
Eventually it will become sequential second nature, as you become a Price Action/Flow Spartan Warrior, half man-child, half machine.
But for now it’s basic training, beginning with charts as simple maps.
🕵️ Pt. 1, Basic Interval Charting: A New Cartography
For the Price Action portion of this coming tutorial over however many days or weeks, you are going to be sticking to a Price Action method passed down to Milton from Abu, and to Abu from the Stock Gods themselves. I am leaving nothing untaught that I was taught.
This methodology is simple—it’s based on major levels of support and resistance. But like the Triangle Offense, over time we will reveal it’s deep intricacies.
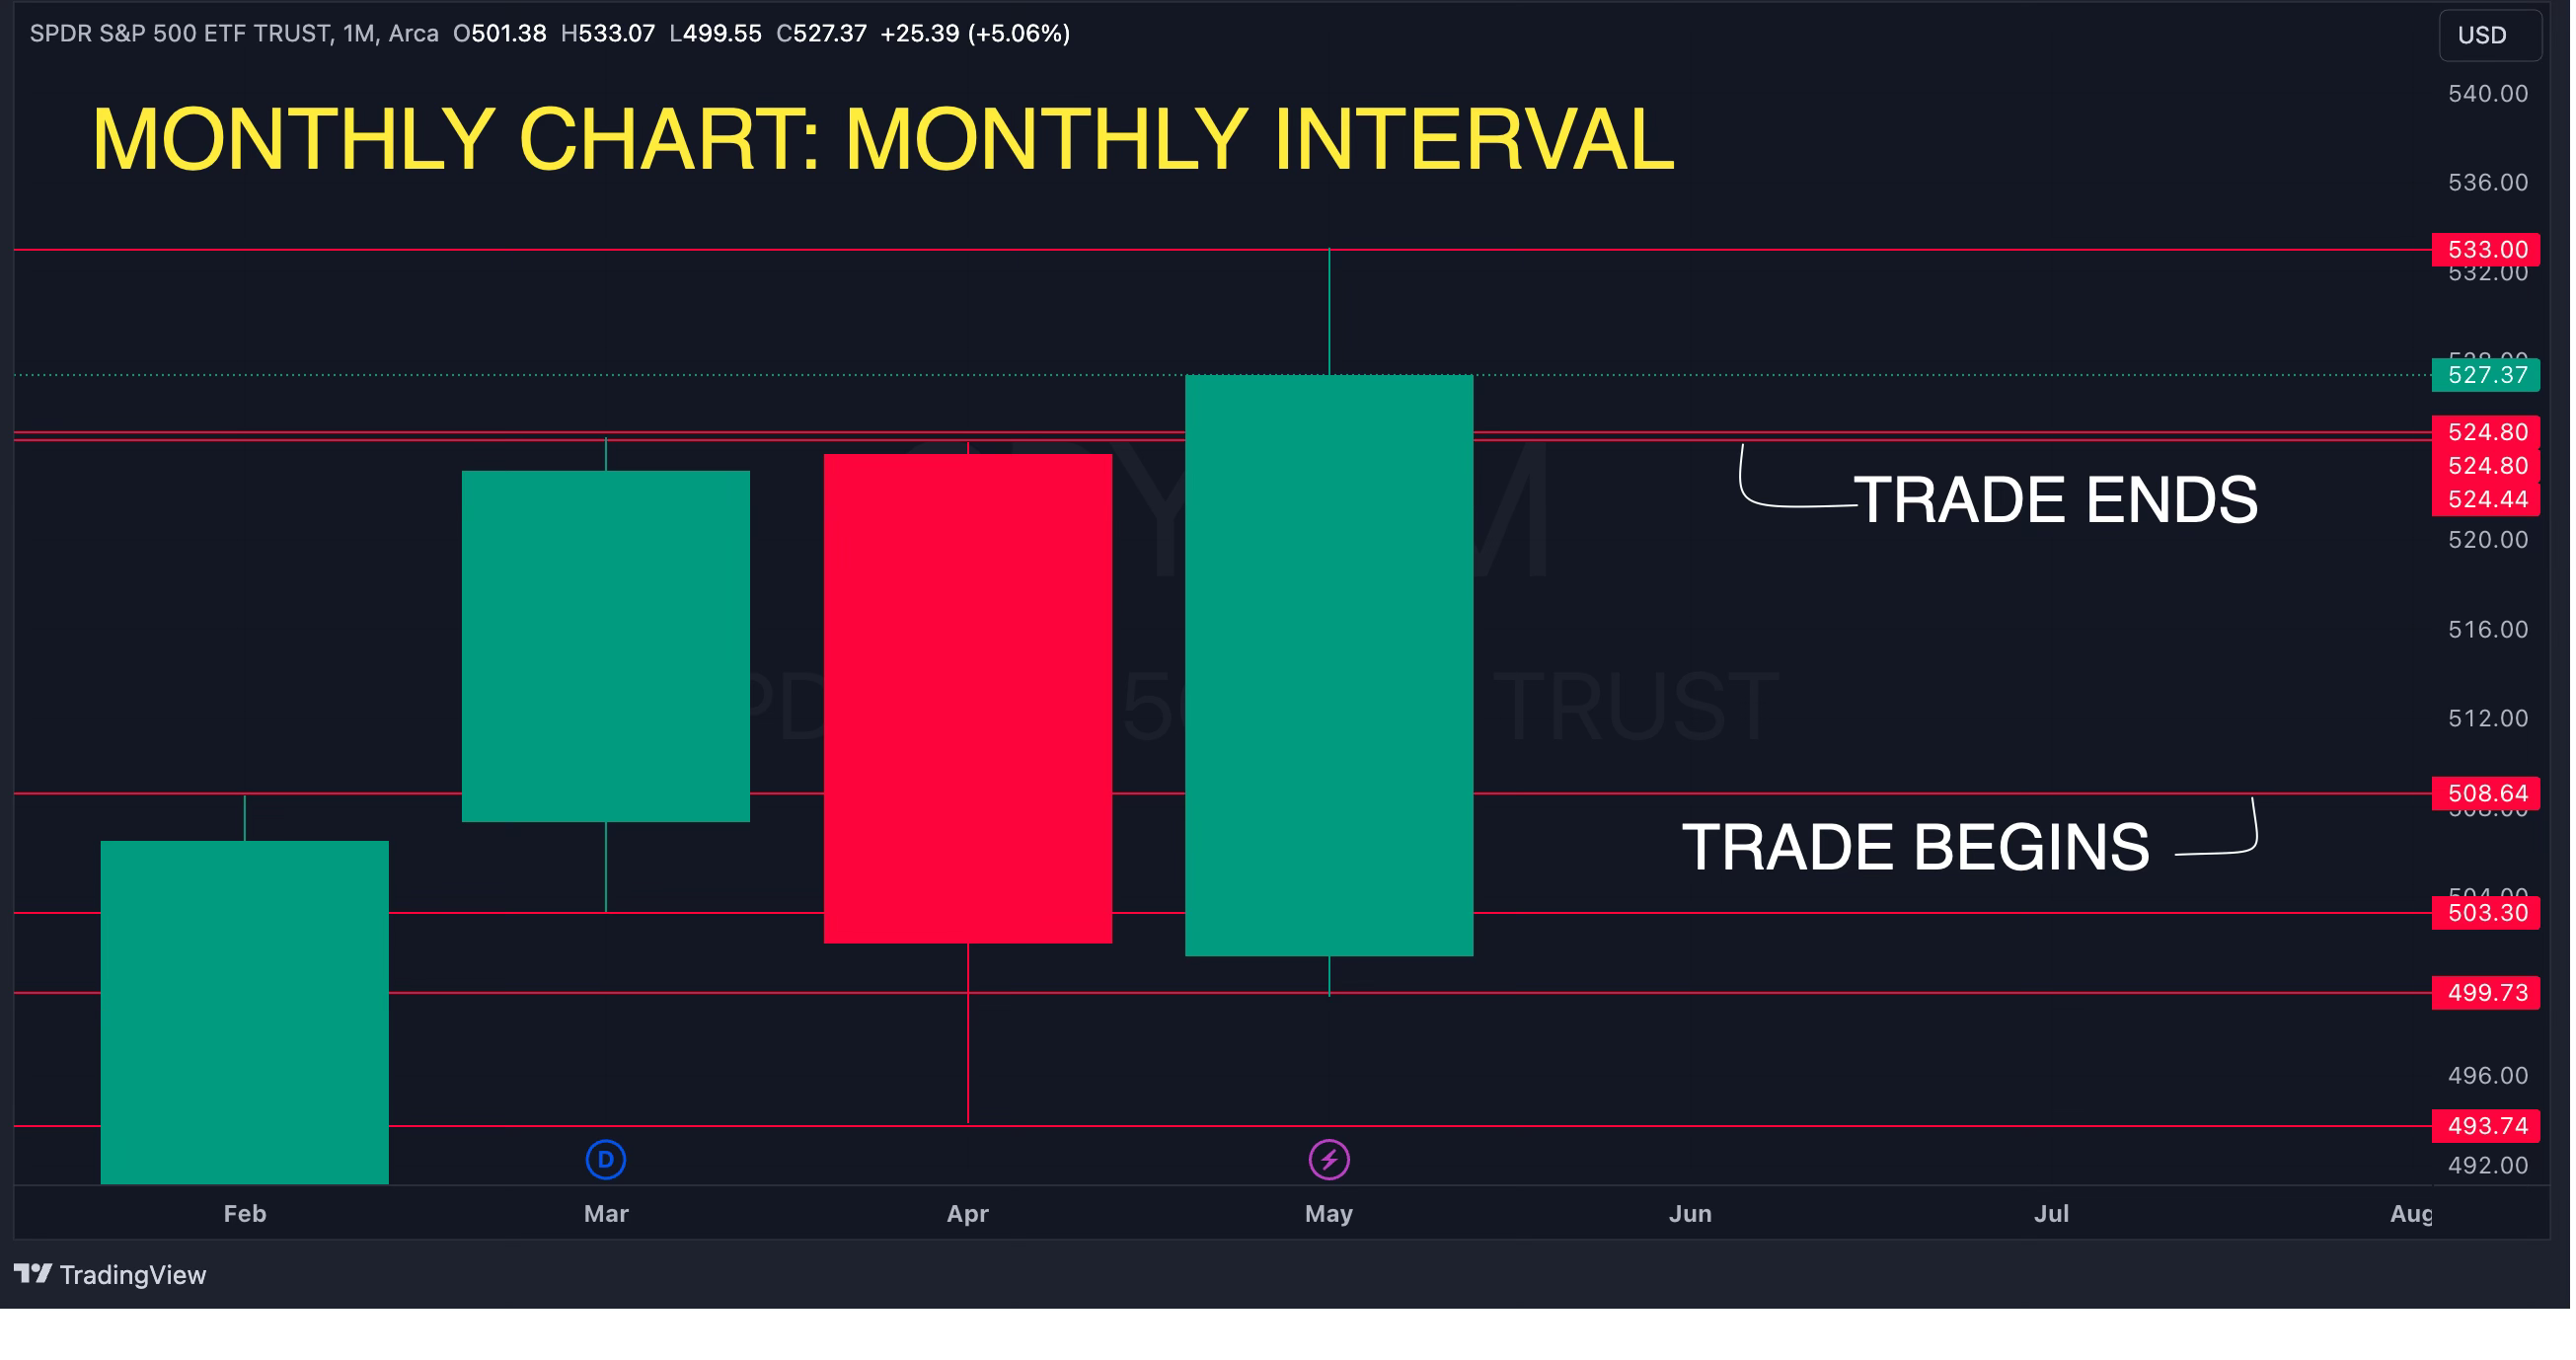
Monthly Levels: Your North and South, Your Start and Your End
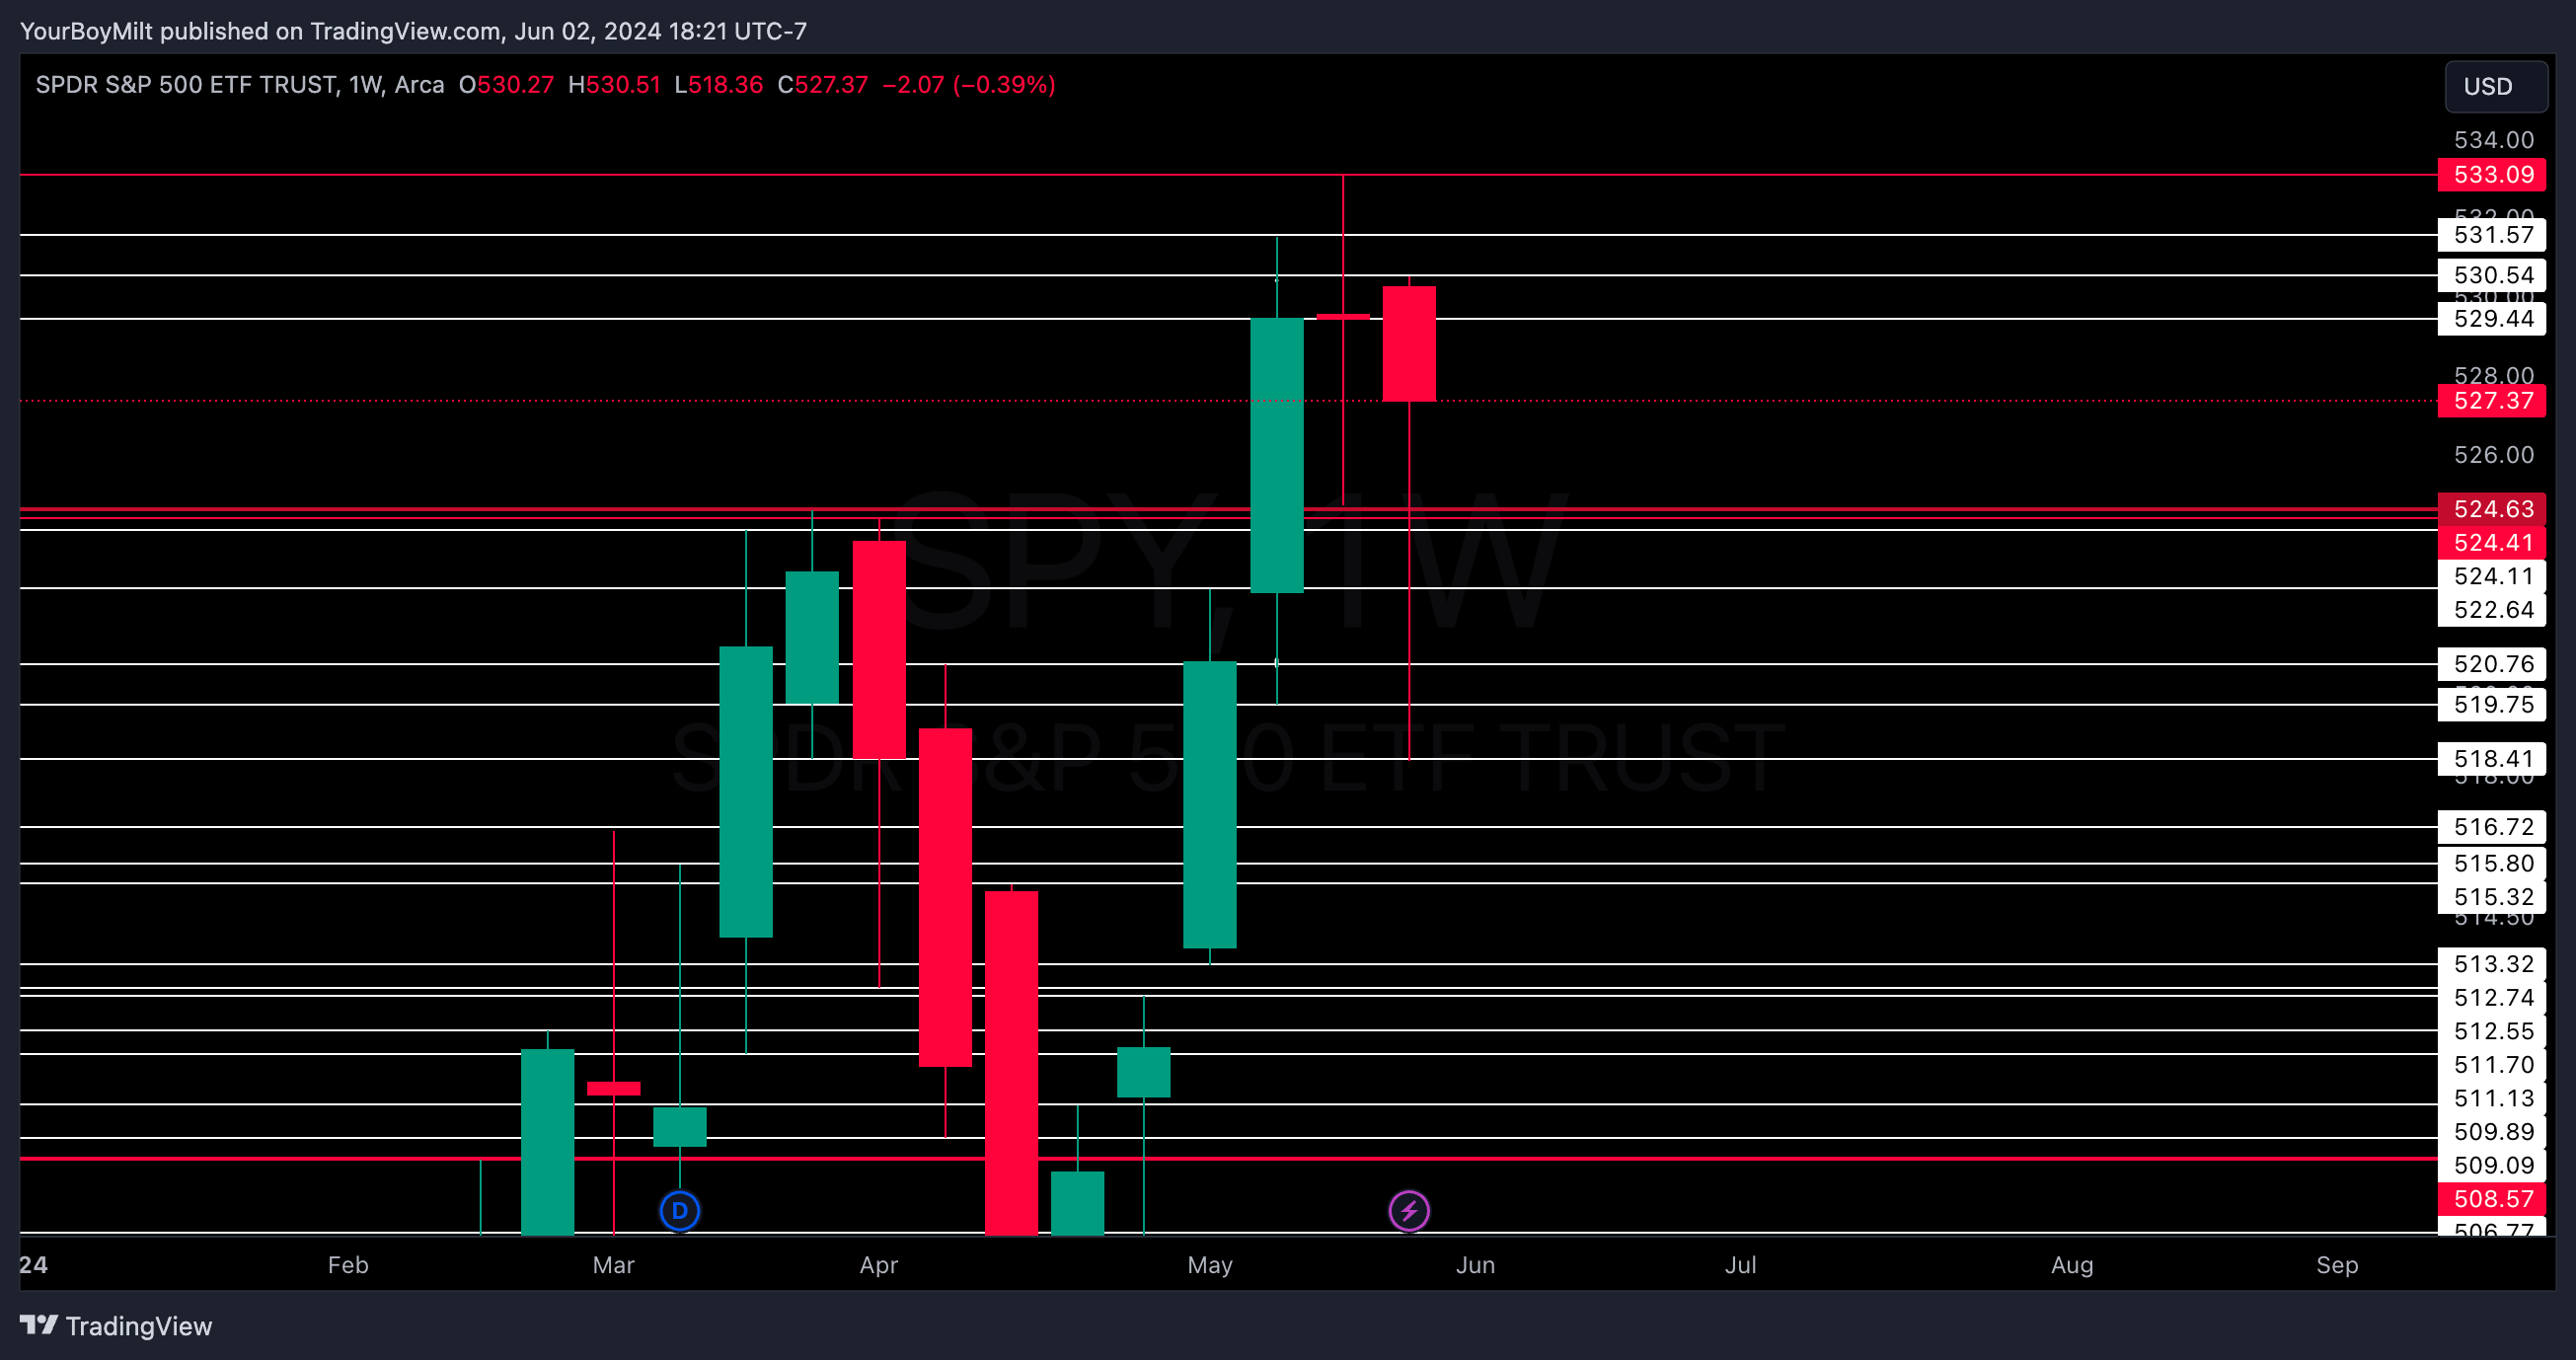
In it’s simplest form, all you want with each trade you enter is get from one monthly level to the next—whether that be downside with puts or the upside with calls. Let’s look at the most zoomed out version of our monthly chart to get a sense.
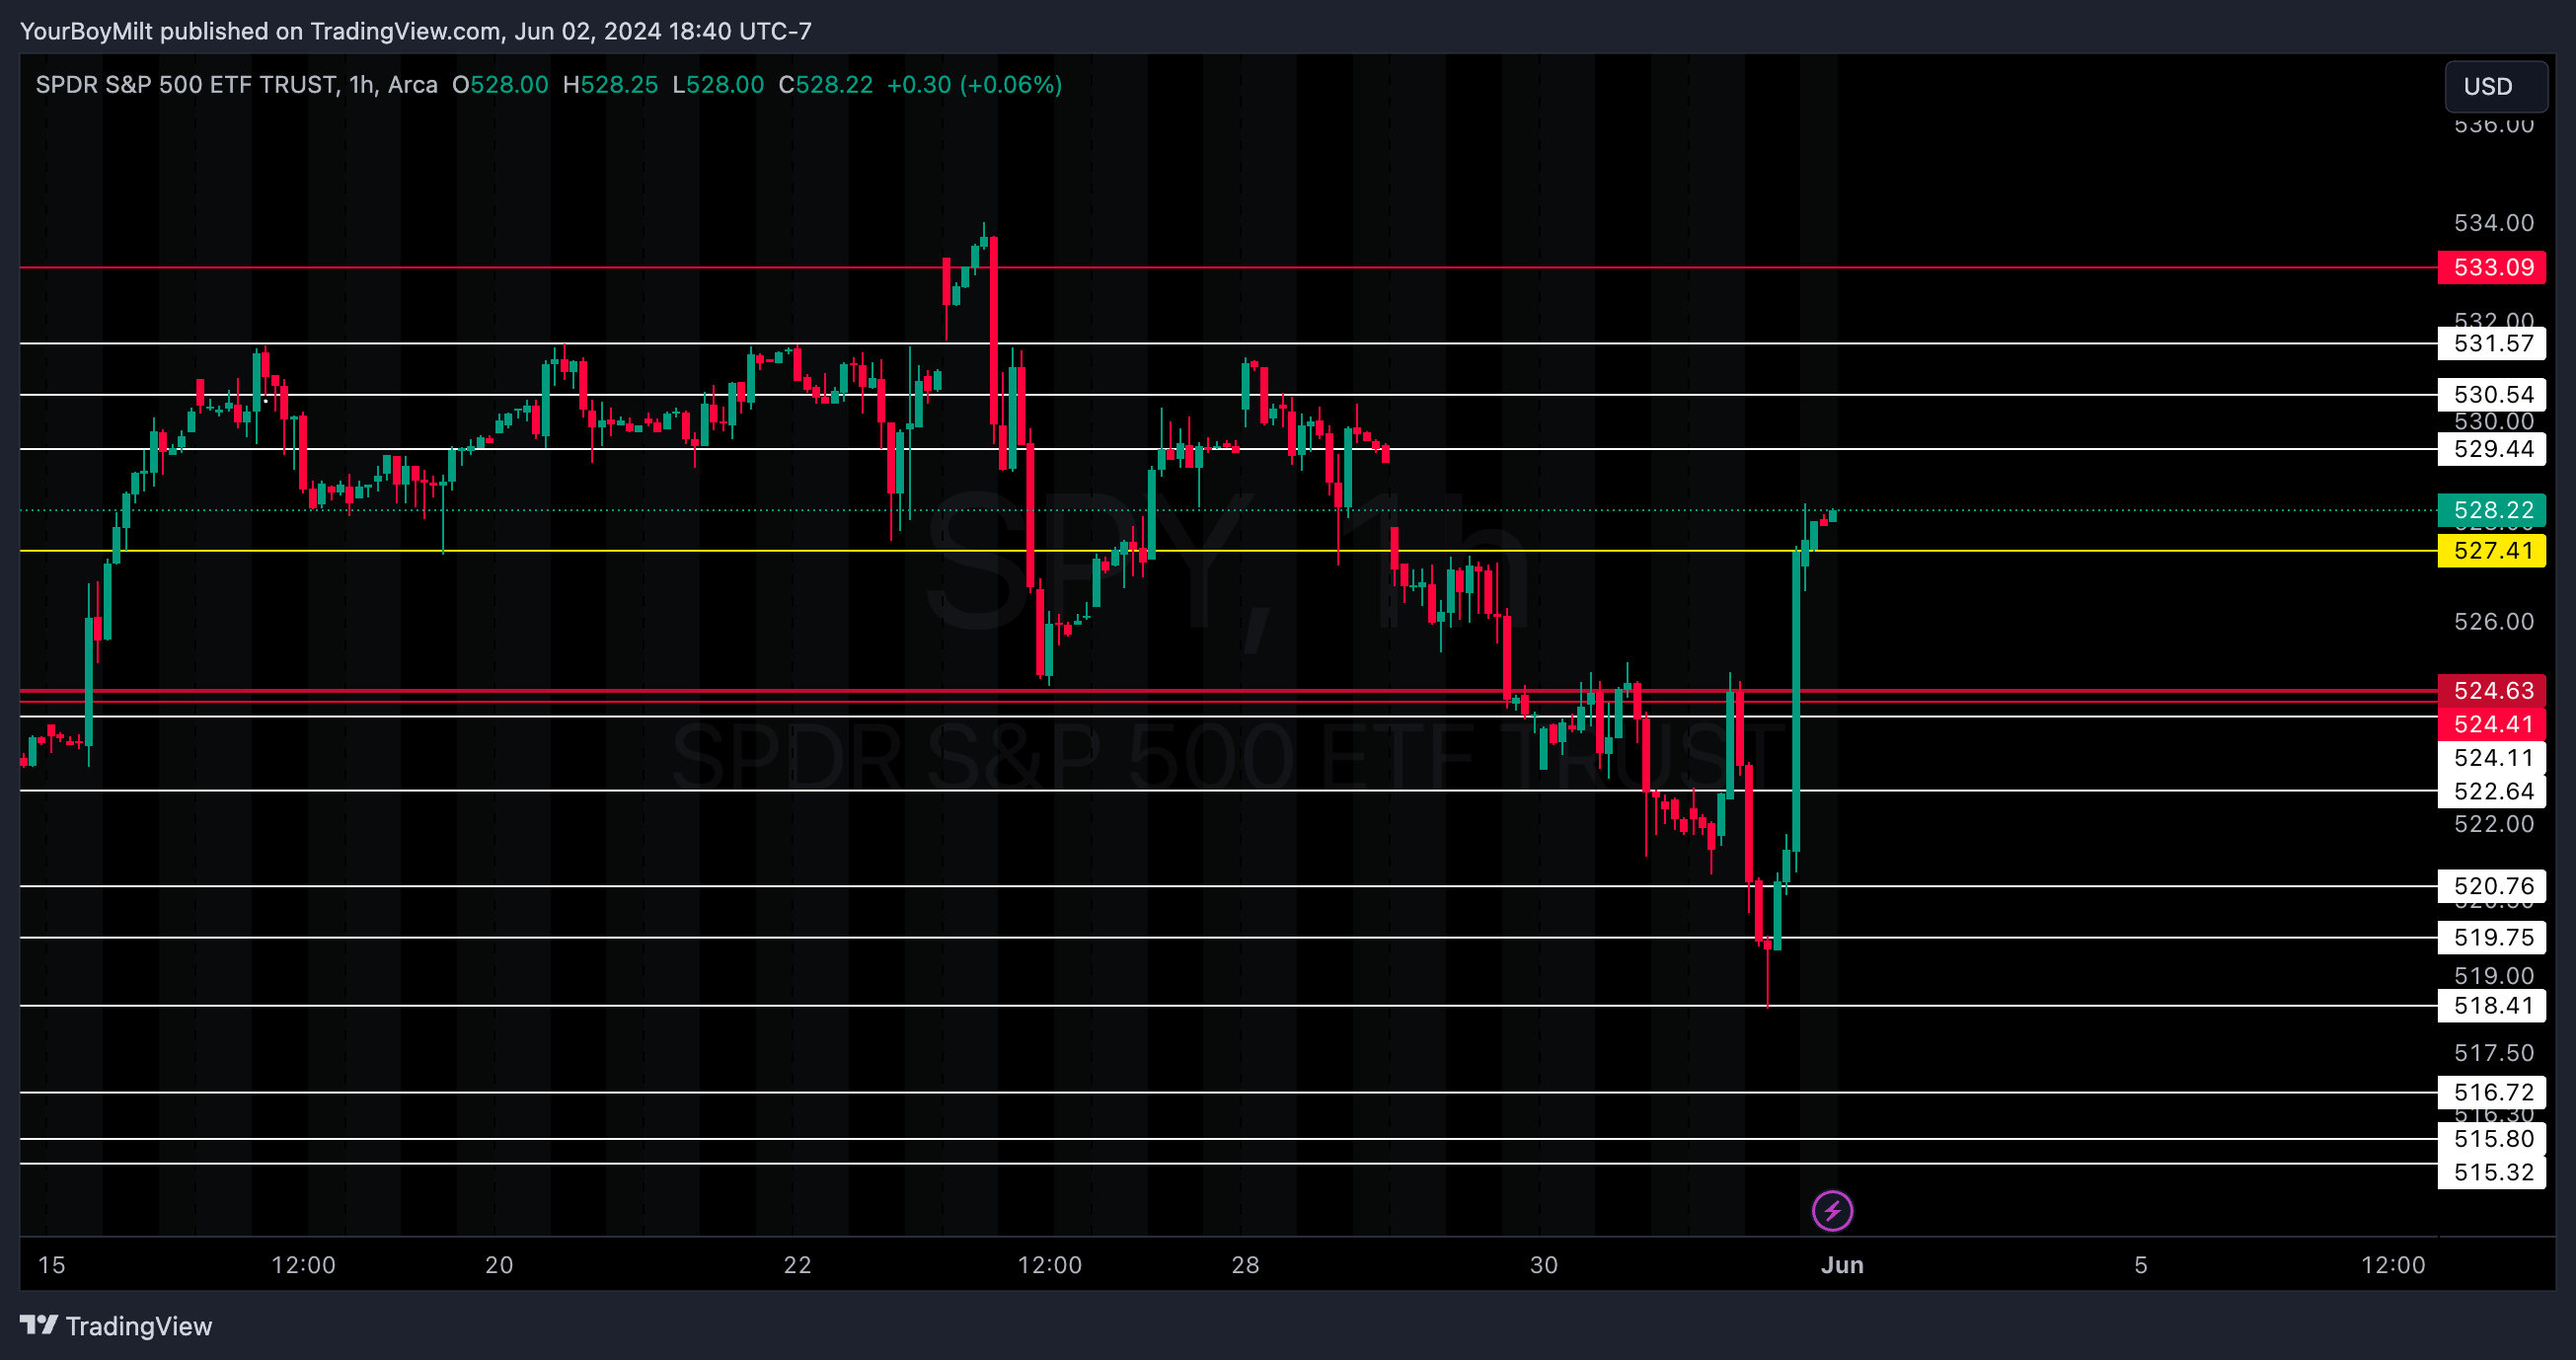
Now let’s narrow it in to the hourly. Why? Because we trade mostly on the hourly—I’m almost always referring to the hourly, lol. Your journey from flag to flag looks something like this—simple. Quick. Clean.
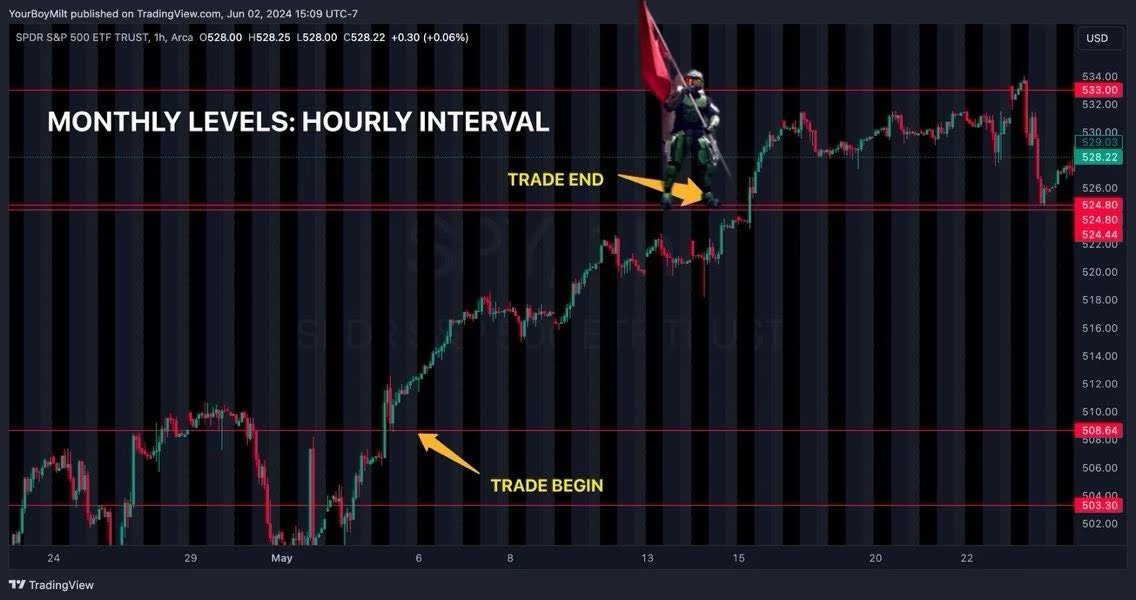
So then, why is it not that every trade goes from point A to point B the moment it crosses a monthly level? Because that would be too easy—much like an explorer must deal with the wind, we must deal with backtests.
🫠 Backtests for our purposes can be broken up into two distinct types:
Confirmation Backtests
Restests of the level
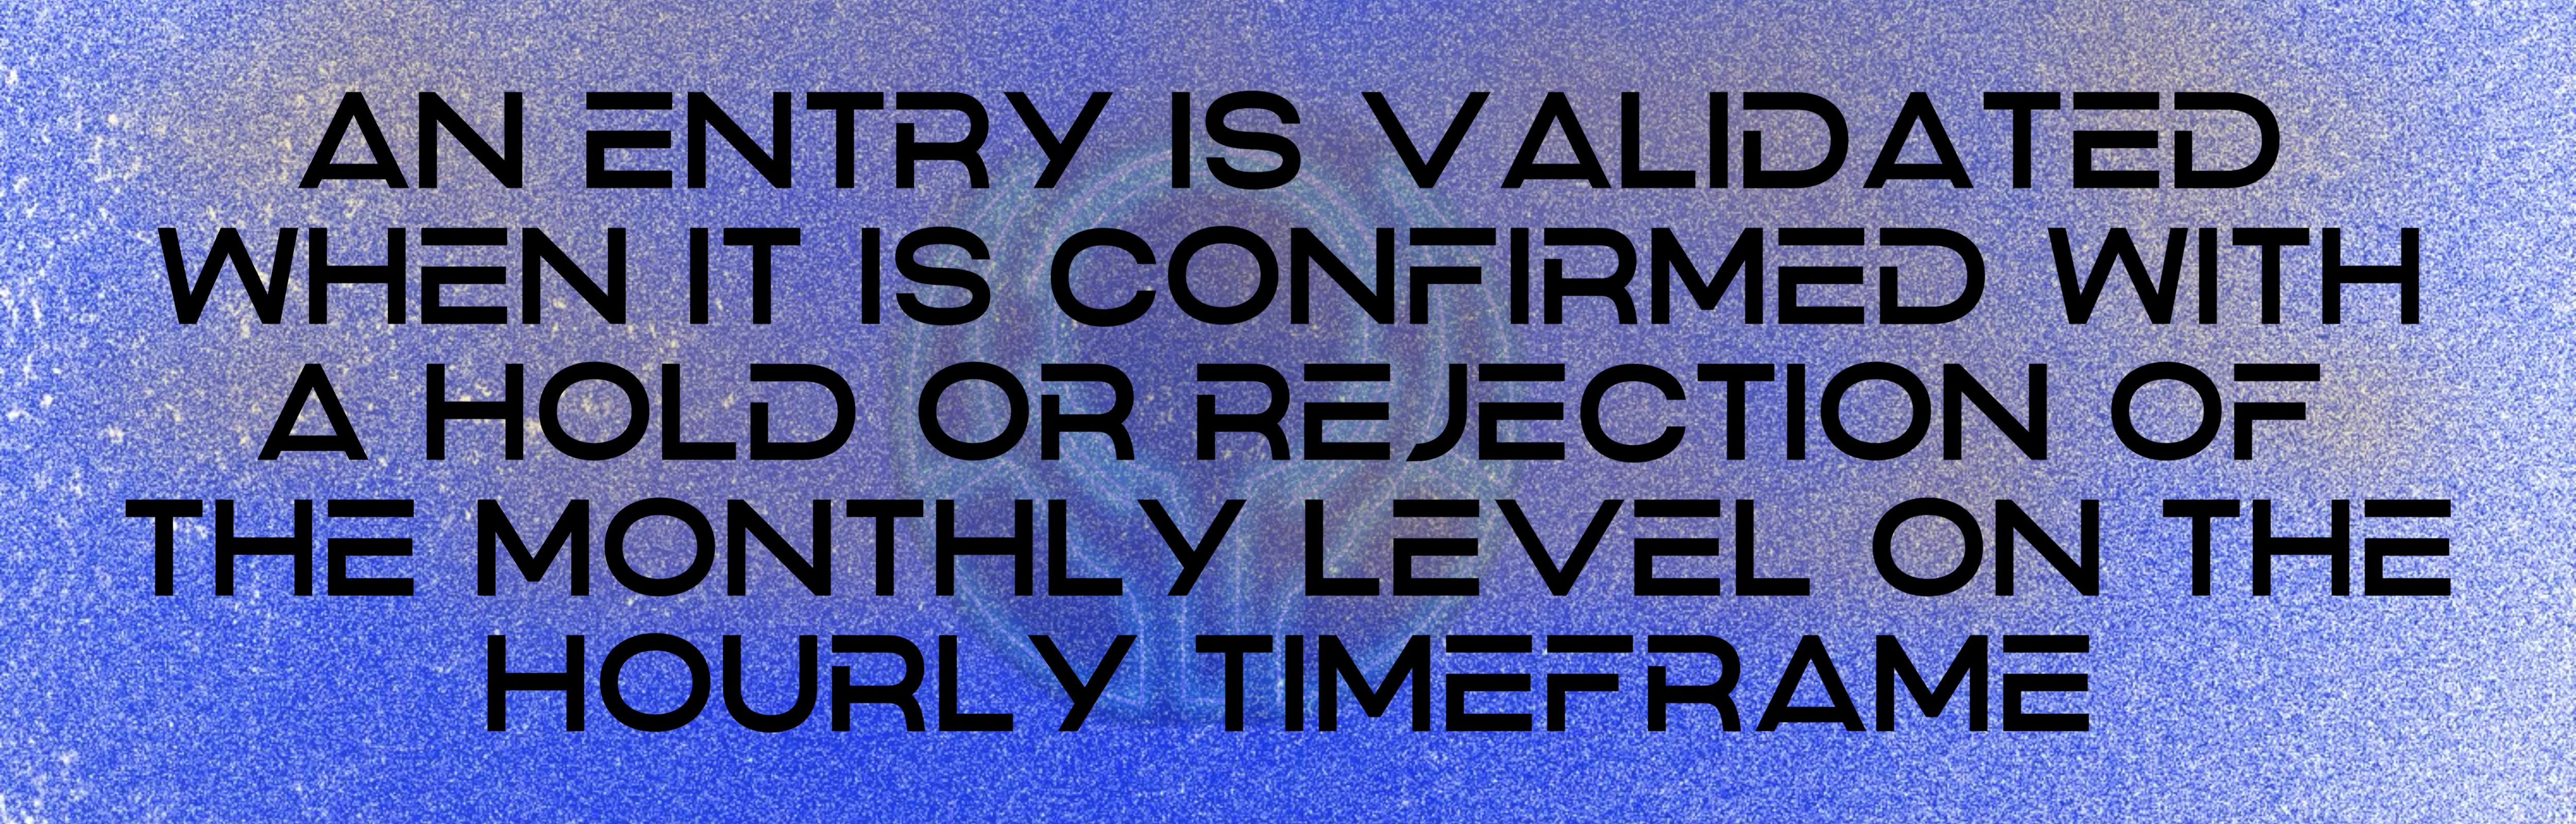
Confirmation Backtest: Just because you’ve broken through a monthly doesn’t mean you[re clear to move onto the next one—it needs to prove that it wasn’t a fluke with a confirmation backtest. That’s when a candle that has broken through the key level then revisits that level (it has to touch it—no cheating—and confirms that the resistance it broke through is now support, or vice versa.
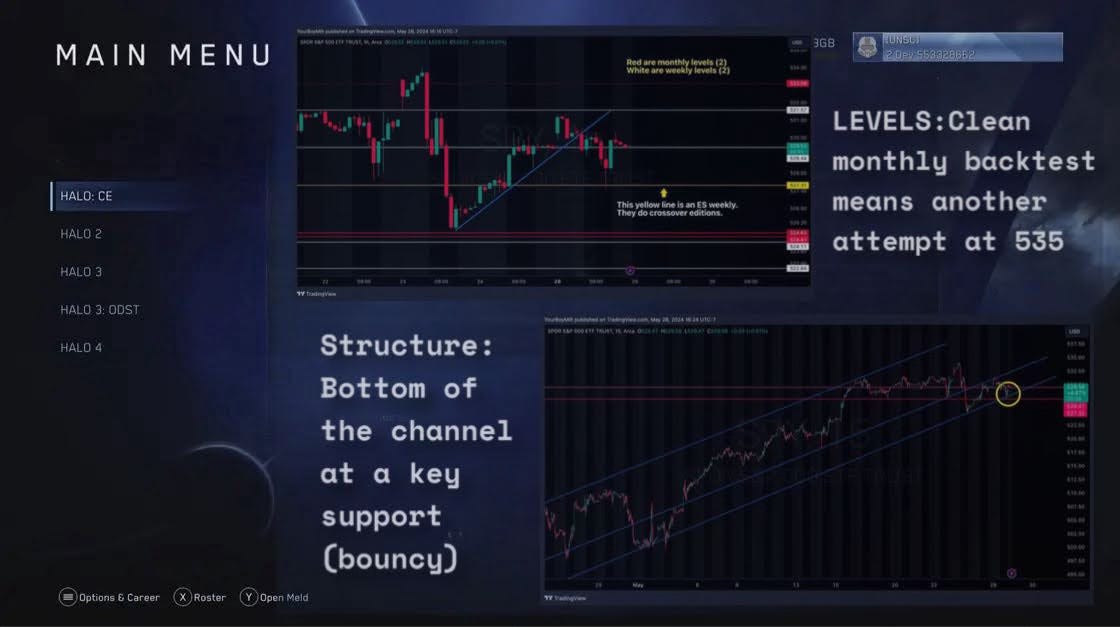
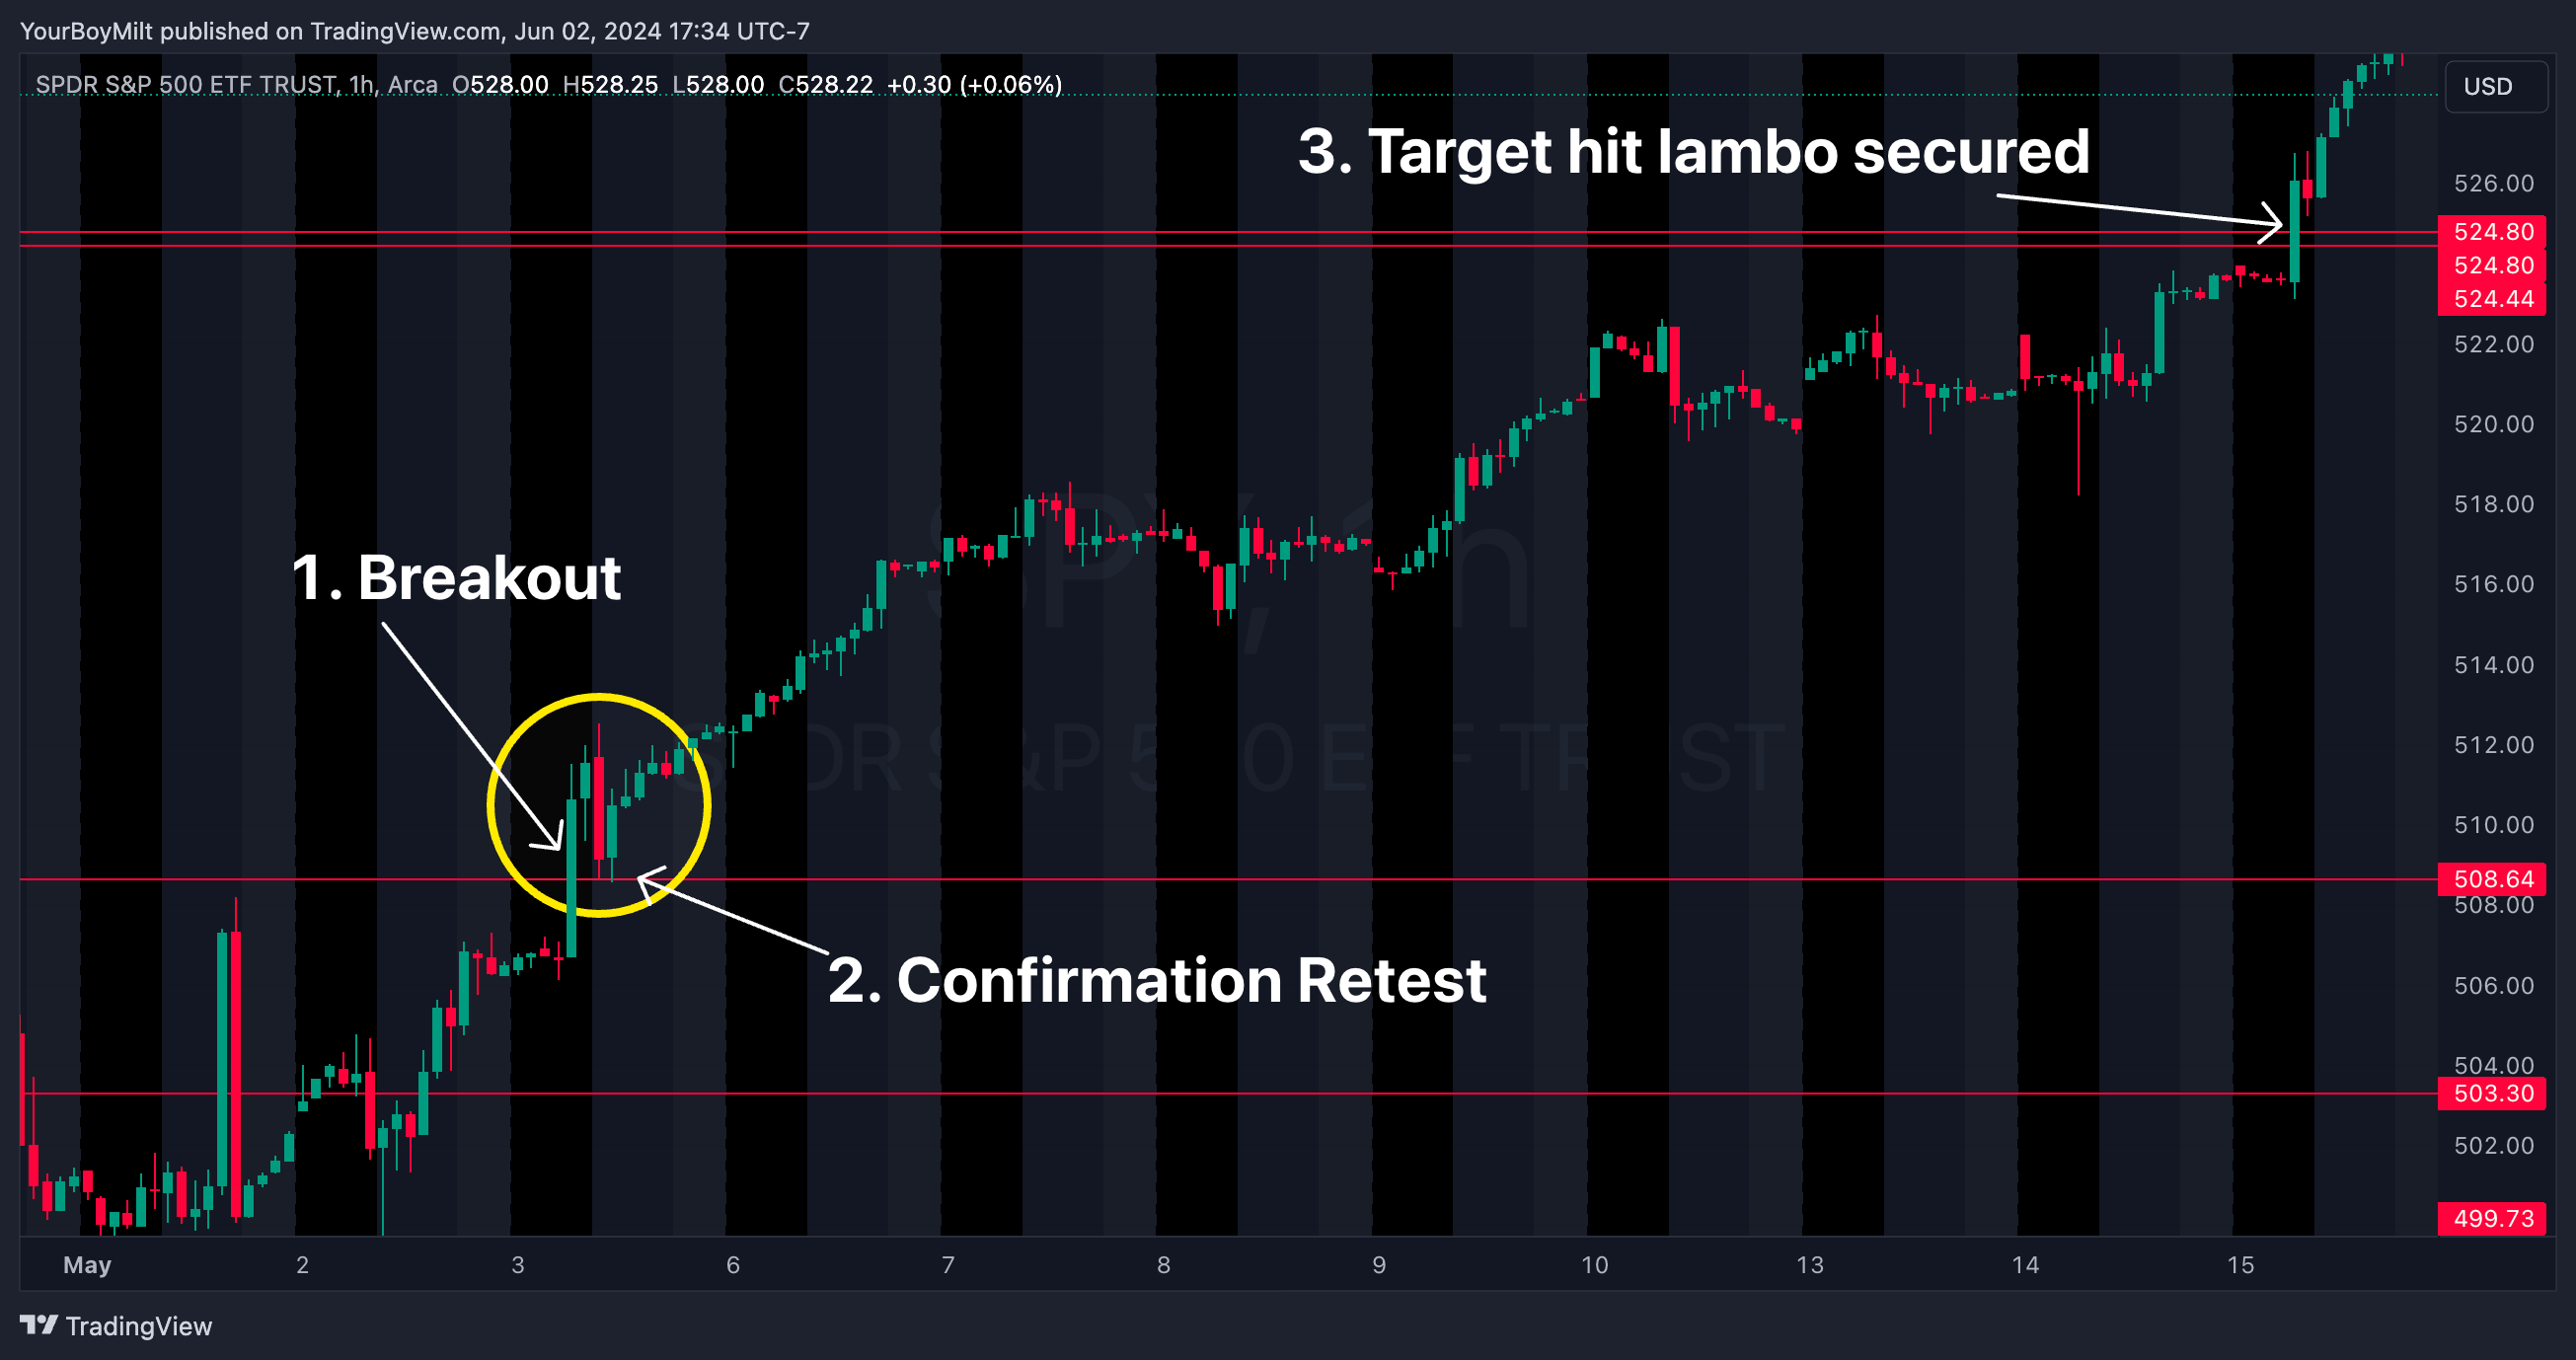
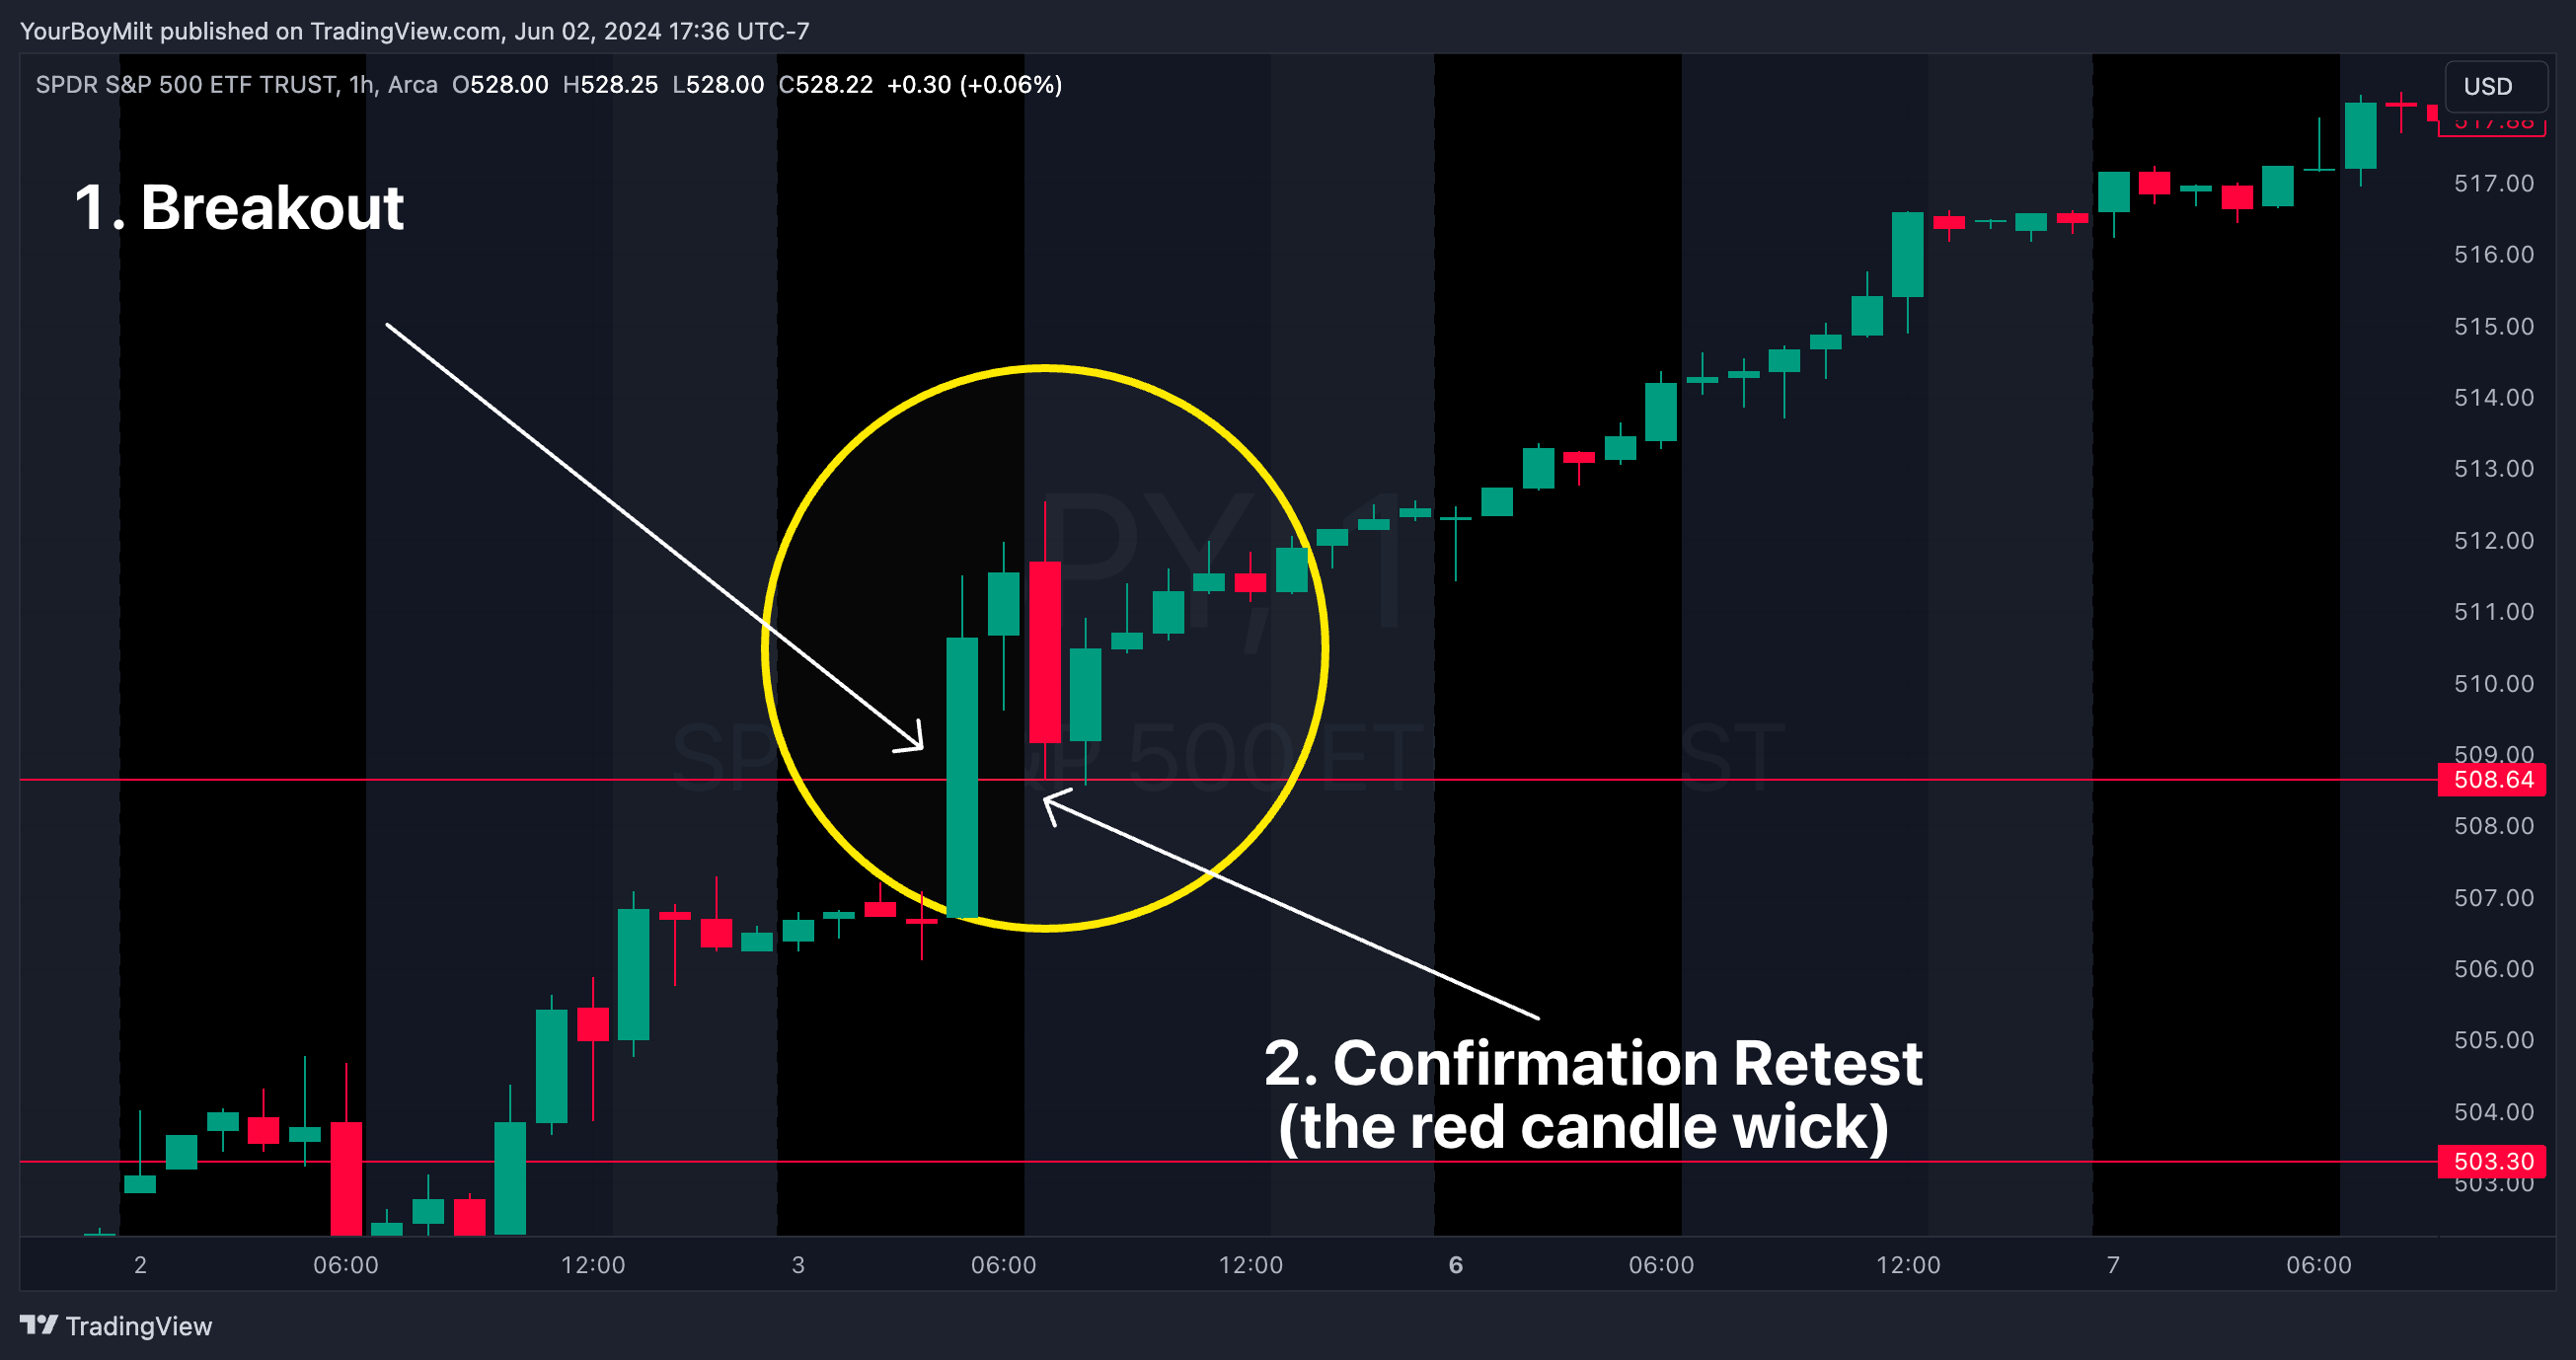
Here’s an example of SPY performing a textbook retest of the MONTHLY level on the HOURLY interval
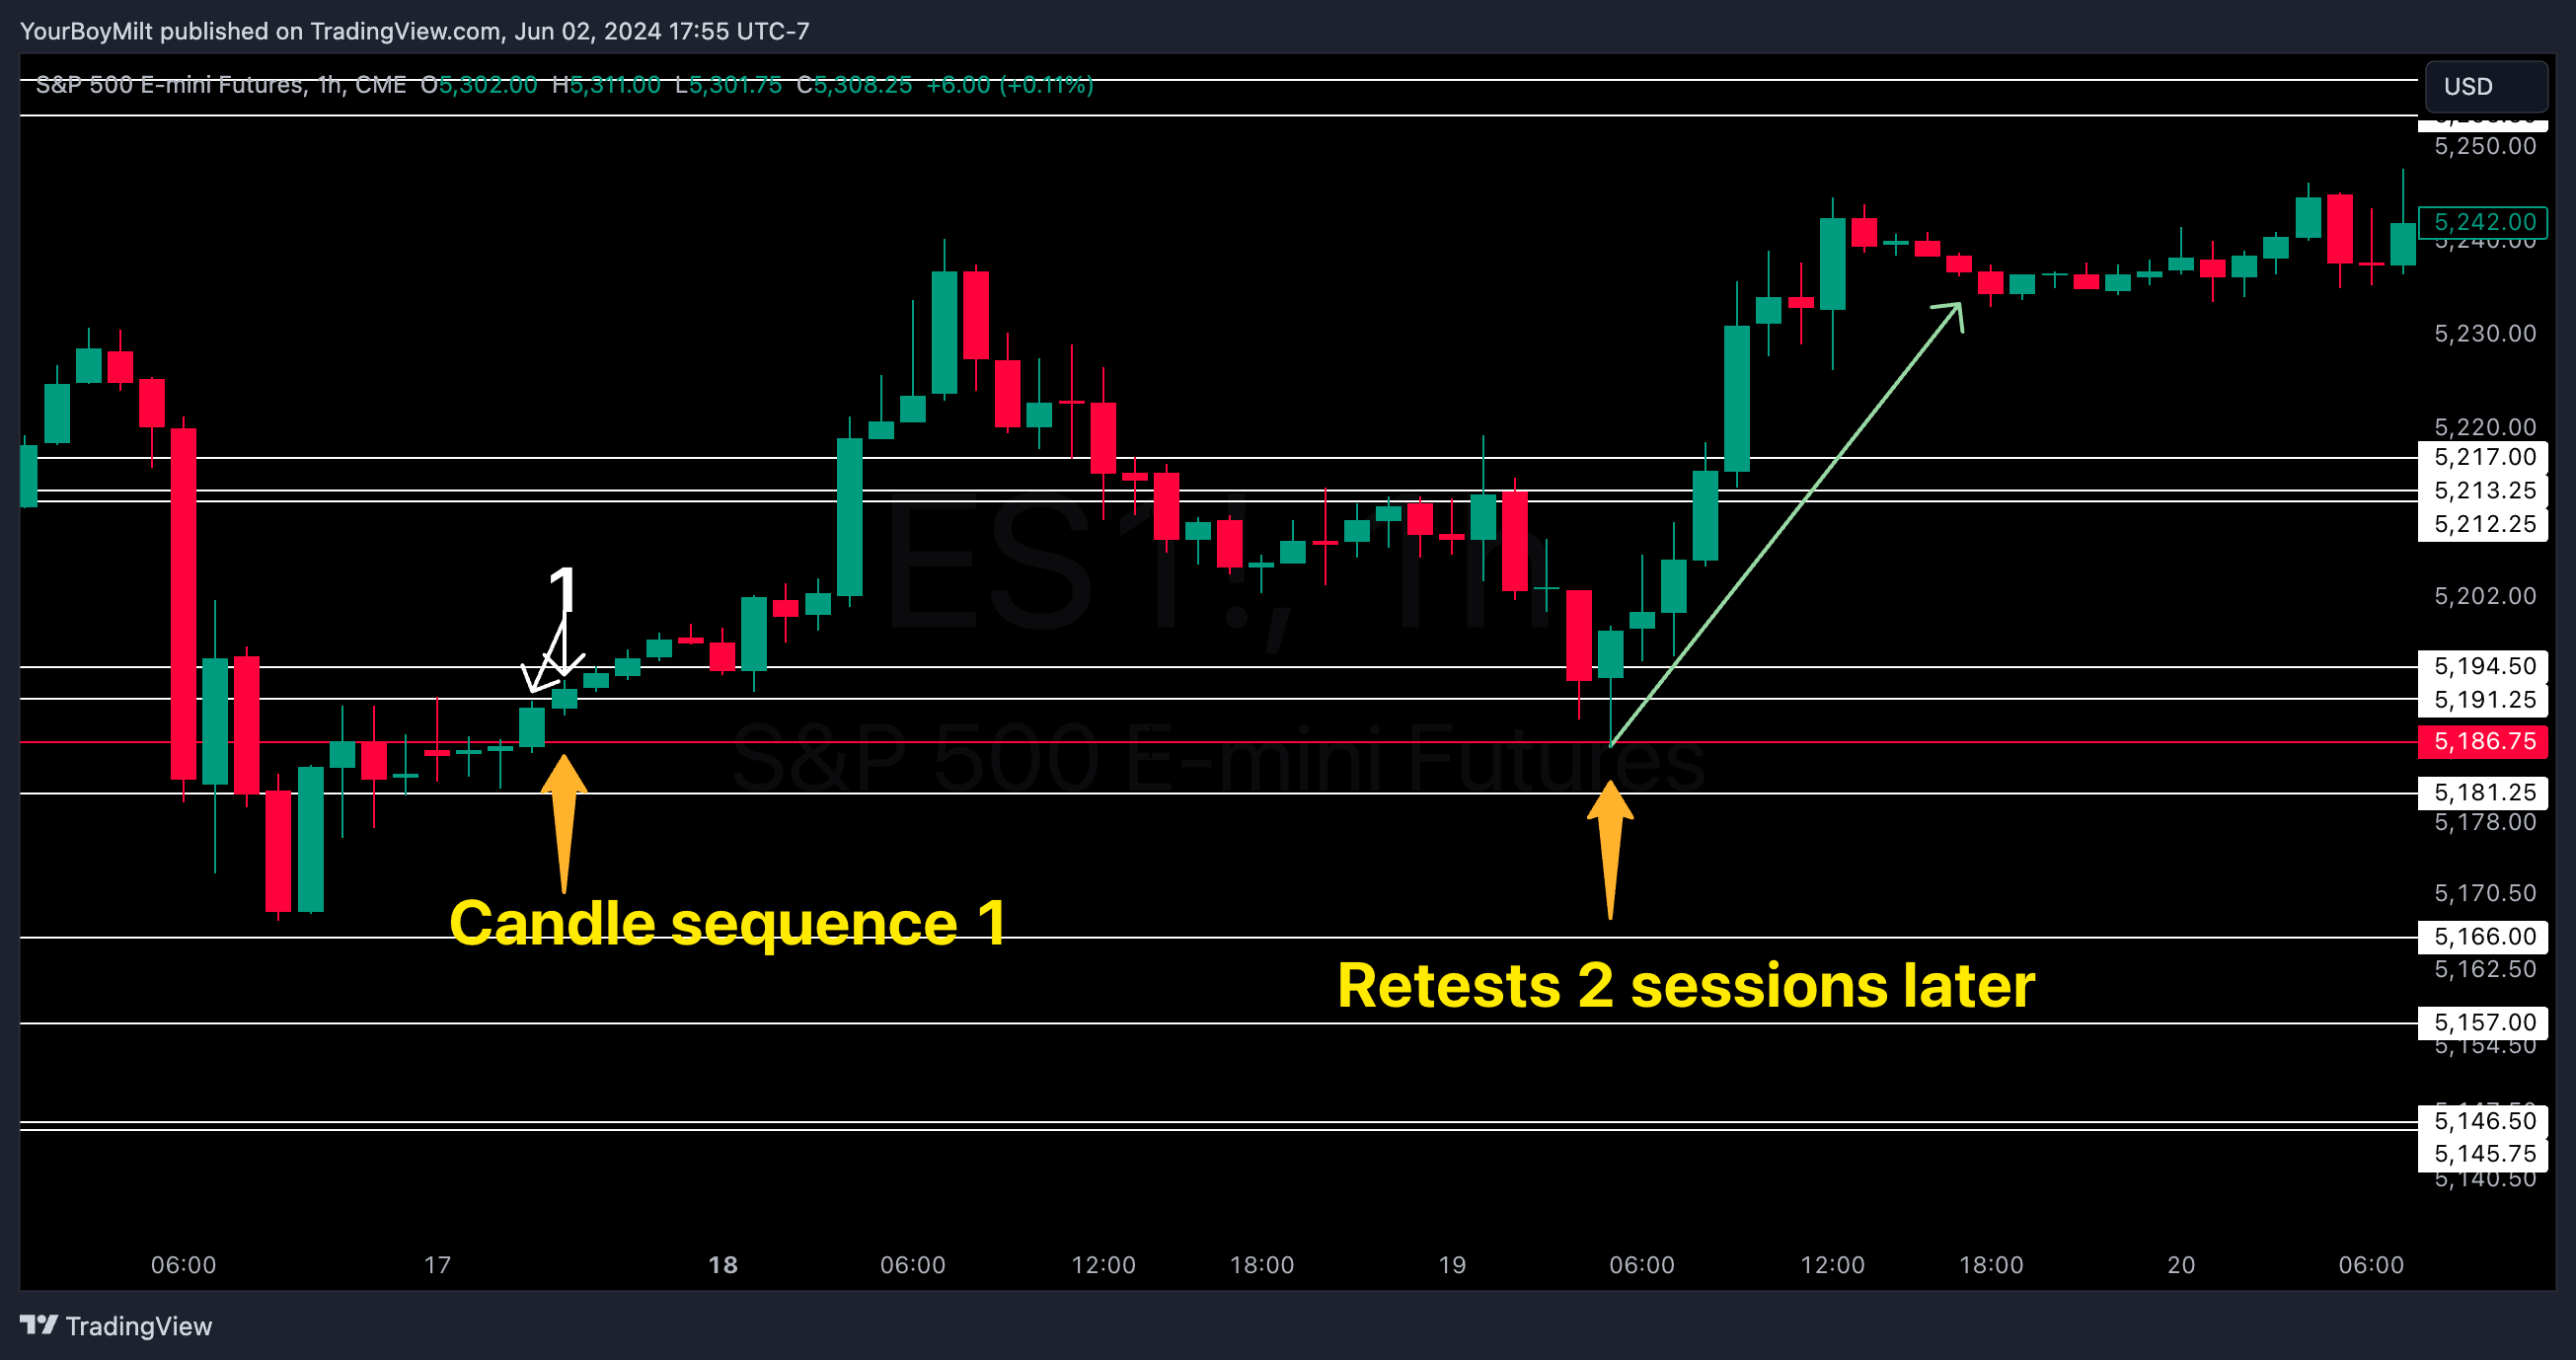
Compare that to this ES monthly level (you’ll get to the know the levels in white shortly), where the retest is missed, and notice precisely where they come back to to receive permission to launch, validating the break of the level.
Retests of the Level are retests that happen due to resistance at some point being met that necessitates another validation of the monthly. It sounds random…because it is…kinda.
Luckily this is where our WEEKLY levels come into play. Drawing them is the same concept as with the monthlies—switch to the weekly timeframe, and slap a horizontal line on the top wick and bottom wick of each week nearby the price action and/or as far back as you can without getting too bored.
WEEKLY levels also follow the same rules—retest are a universal Price Action Principal—as our monthly entries do. Think of the weeklies as the skirmishes on our way to the monthly base. We can move forward or we can fall back—sometimes it’s a cakewalk to the MONTHLY goal, and sometimes it’s full of ups and downs.
For those who want to chart these things on their own, here is what your SPY monthly-weekly should be from 533-503.
All levels you should have:533.09 531.57 530.54 529.44 528.22 527.41 525.50 524.63 524.41 524.11 522.64 520.76 518.56 518.41 516.72 515.80 515.32 513.32 512.74 512.55 511.70 511.13 509.89 509.09 508.57 506.77 503.37 503.37 503.19
🫡2. Spartan SPY Read
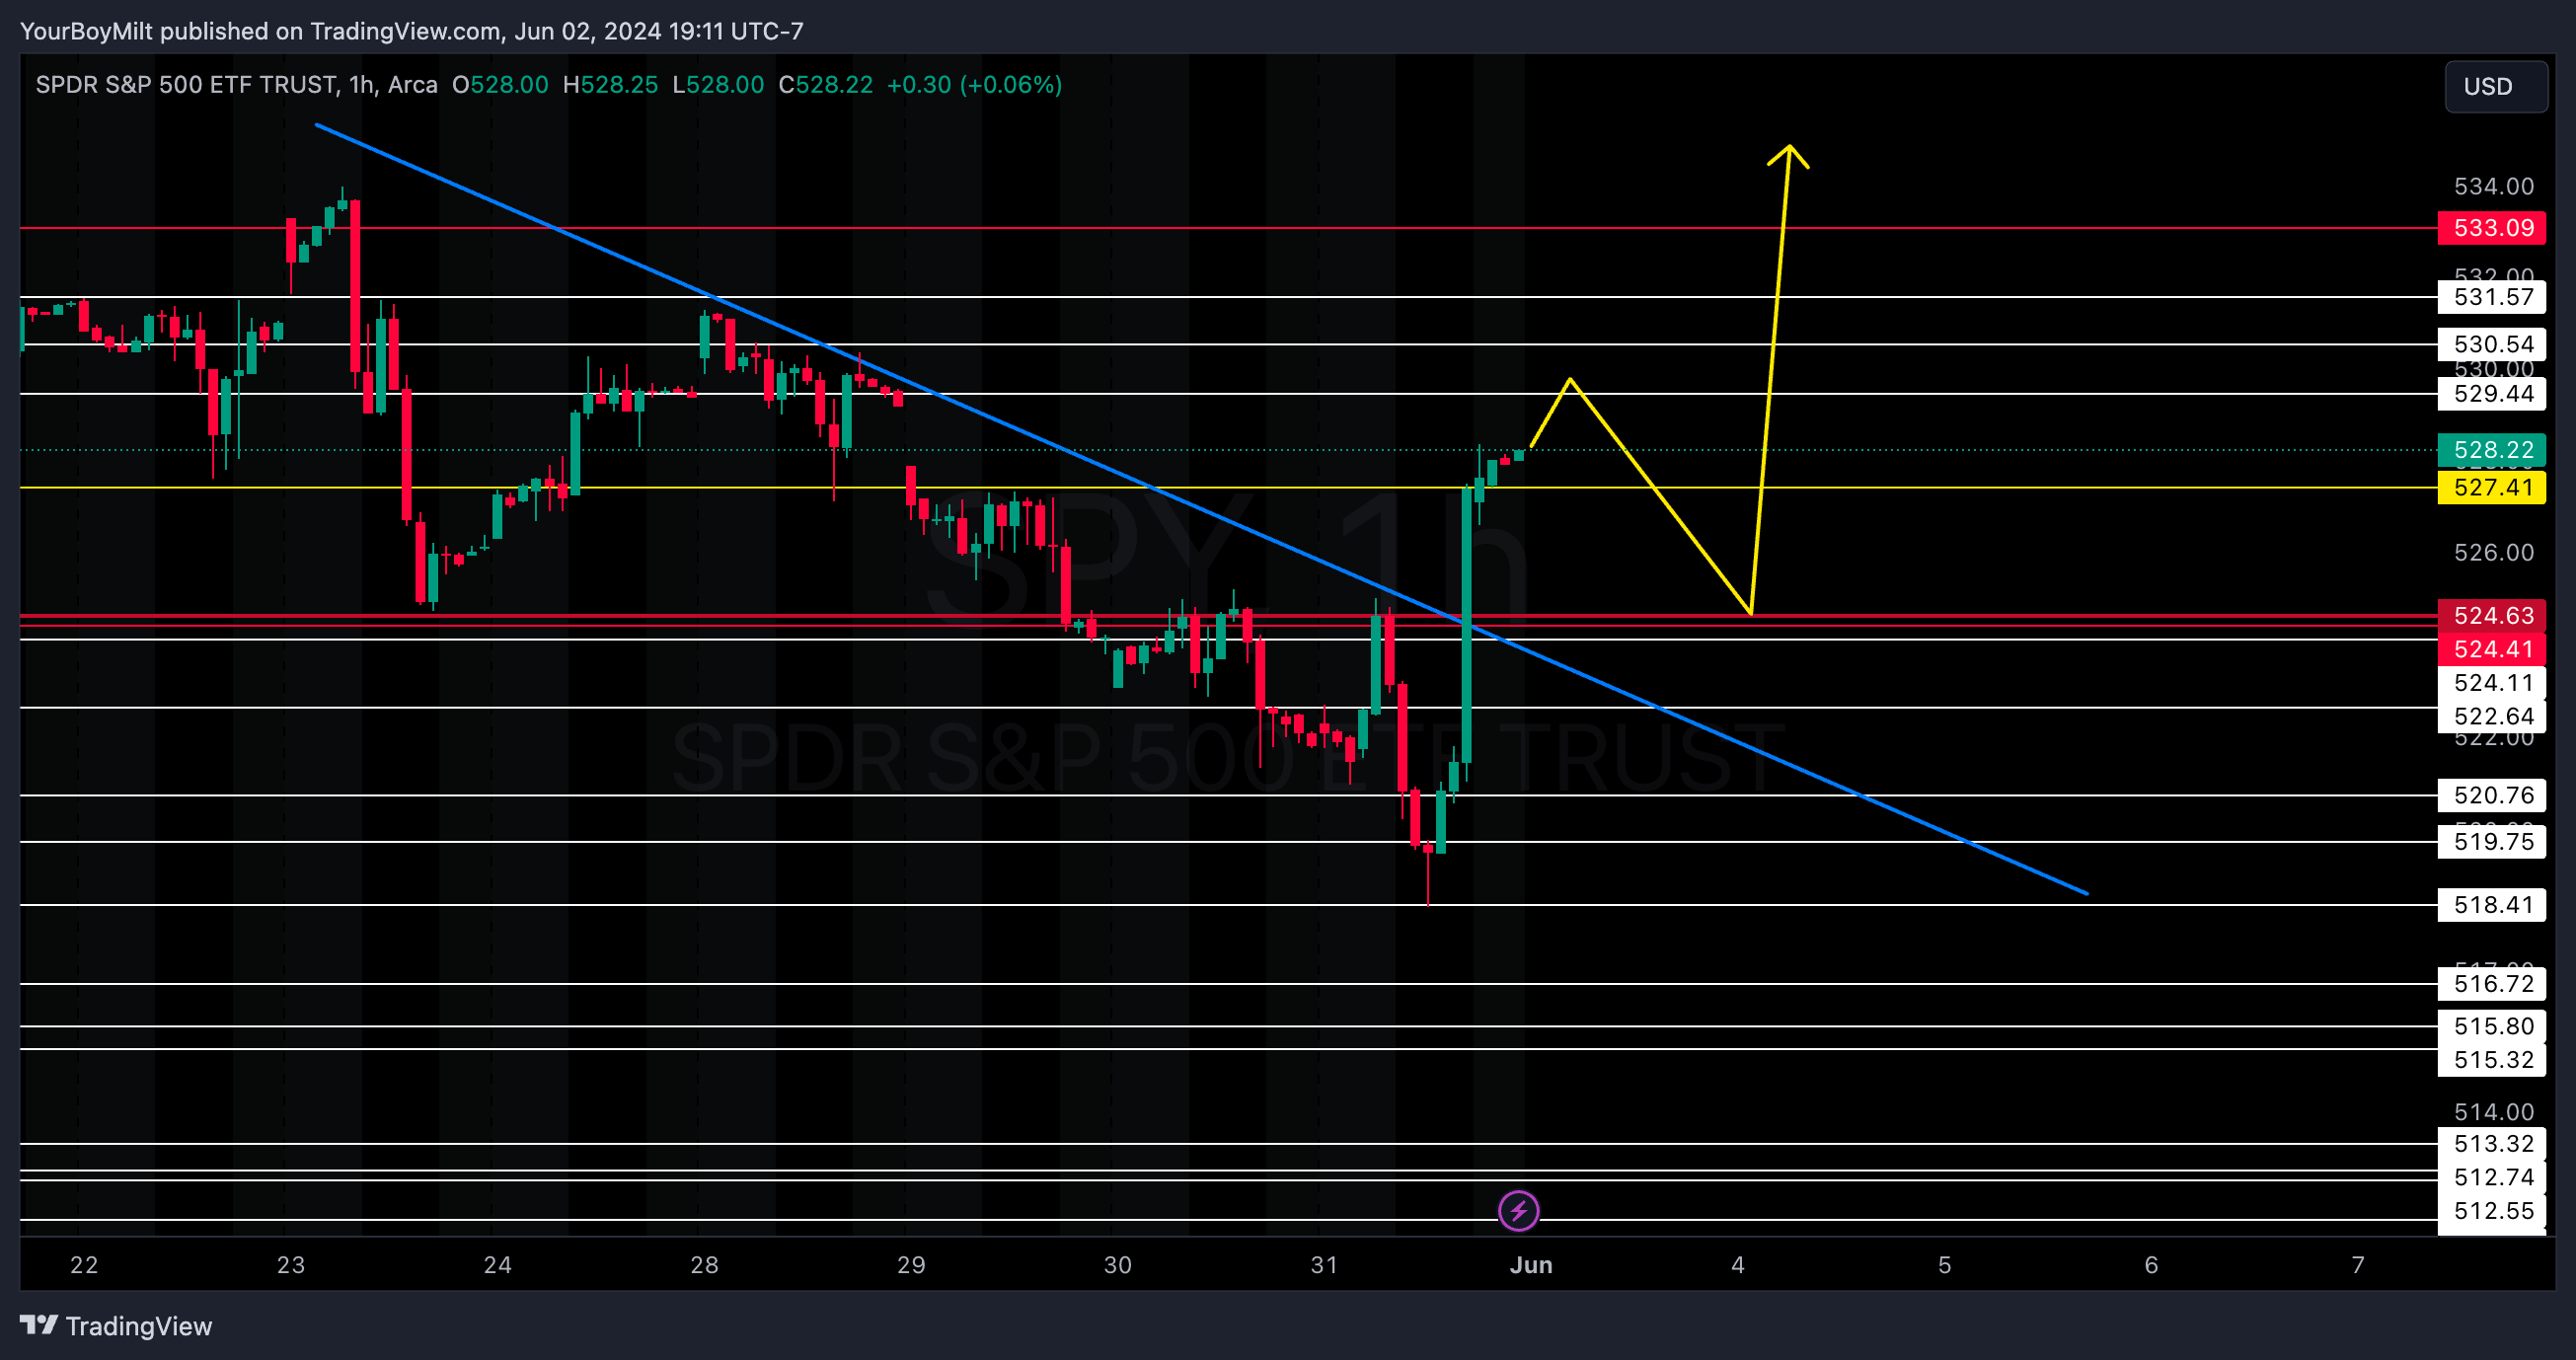
Ultimately we are: Playing it safe and waiting for confirmation of a rejection to catch SPY on the monthly retest they shot past on Friday. If it continues upward, we won’t touch it between 529 and 532—see why in the video.
💣 EXPLOSIVES: The Flow Section💣
Note: The Worksheet for YEET Plus with key concepts is attached at the bottom of the email after flow.